Vegetation Structure, Composition and Plant Community types in Tropical Dry Deciduous Forests of Jaipur, Rajasthan, India
Naveen Kumar
*
 , Sonali Tiwari
, Priyanka Jatav
and Archana Meena
, Sonali Tiwari
, Priyanka Jatav
and Archana Meena
1
Department of Botany,
University of Rajasthan,
Jaipur,
Rajasthan
India
http://dx.doi.org/10.12944/CWE.19.2.28
Copy the following to cite this article:
Kumar N, Tiwari S, Jatav P, Meena A. Vegetation Structure, Composition and Plant Community types in Tropical Dry Deciduous Forests of Jaipur, Rajasthan, India. Curr World Environ 2024;19(2). DOI:http://dx.doi.org/10.12944/CWE.19.2.28
Copy the following to cite this URL:
Kumar N, Tiwari S, Jatav P, Meena A. Vegetation Structure, Composition and Plant Community types in Tropical Dry Deciduous Forests of Jaipur, Rajasthan, India. Curr World Environ 2024;19(2).
Download article (pdf) Citation Manager Publish History

Introduction
Forest management, as an important environmental indicator, has a significant impact on plant species diversity. 1,2,3 Forest structure and function dynamics are influenced by several biotic and abiotic elements.4 The ecological qualities of locations, abundance, variety, species richness, regeneration and distribution state of species all have a significant impact on the nature of forest communities.5 The overall population structure represented by tree diameter and class distribution gives useful data about each given stand's reproductive capabilities.6,7 Furthermore, evaluating the variety of species indicators reflects the resilience and long-term viability of forest ecosystems.8 All of these elements are required for maintaining biodiversity and conservation. Therefore, properly assessing the ecological makeup of every forest area is critical for scientific oversight. The study gives data on species diversity, community structure, resource allocation in niches, and the rate at which species change in an ecosystem.9 Species diversity, community structure, resource allocation for niches, and species turnover rate in a forest ecosystem can all be learned via a thorough vegetation analysis. Trees, as a key component of vegetation, need careful monitoring and management in order to preserve habitat as well as species variety,10,11 which, in consequently, are crucial features of the dynamics of forests that influence succession processes.12 The collection of tree varieties will thus be a helpful tool for providing knowledge of forest varieties and maximizing biodiversity protection.13 To examine floristic structure, diversity of species, structural analysis and community are essential for providing the required information on forest diversity and species richness, and different species of vegetation are helpful for forest administration and help to understand ecosystem activities and forest ecology. 14,15,16,17,18,19,20 Furthermore, understanding the structure and floristic composition of a forest is beneficial for describe biologically or efficient significant plants and their diversity, as well as safeguarding endangered and commercially important plant species.21 Forests play a crucial role in maintaining environmental balance and offer numerous benefits to people and other animals.22 Northern India's tropical dry forests are biologically rich, with a variety of floristic compositions. It also boasts a varied range of commercial and medicinal plant species on which the residents rely to satisfy their basic needs and sustain their livelihoods.23,24
Drylands covers 45 % of our Earth’s land area and inhabits 38% of total population of the world. These are classified as areas having an aridity index less than 0.65. Global climate change along with increased in Earth’s temperature has potential threats on world’s biodiversity. The spatial and temporal changes climatic conditions in drylands leads to vegetation shift and loss of overall ecosystem services, intensify the land degradation.25 Nevertheless, there is a lack of evidence on plant diversity patterns and community structure in dryland forests. The semi-arid tracts in India covers 37 % of its whole geographic region. Rajasthan being the largest state in India, covering 10.40% of the nation’s geographic area. On the basis of climatic conditions, Rajasthan can be classified as viz western and eastern parts as arid and semi-arid, respectively.26 The forest area covers 8% of the state’s whole geographical area and belongs to Tropical Dry Deciduous and Thorn Forests.27 Low and erratic rainfall events, extreme diurnal and annual temperature and reduced soil ramify the frequent occurrence of drought in these regions. Climate and topography have a considerable impact on the distribution of vegetation in these locations. Nevertheless, to our understanding, plant community types and vegetation structure have not been well revealed in India's semi-arid area.
The Aravalli Mountain range, which stretches in a south-westerly and north-western direction from Gujarat to Delhi via Rajasthan to Haryana, is the oldest fold mountain range. It is around 692 kilometres long. It safeguards the plain of Indo-Gangetic by serving as an impediment to the spread of drought over a 50,000 km2 area.28 However, to our knowledge, the plant community types and vegetation structure have not been well revealed in India’s semi-arid geographical region. The ongoing urbanisation causes these forests to be destroyed and fragmented, and the invasion of exotic species has a negative impact on the local tree species.29 The present investigation provides vital baseline data for protecting and managing the current flora and native tree species found in these forests. However, no research has been undertaken on the floristic composition and plant types of Jaipur's Semi-arid Forest. The purpose of the work is to assess the importance value index, basal area and density of tree species at Naharagarh and Jamwa forest divisions of Jaipur, Rajasthan. The study also measures the diversity indices i.e. evenness and species diversity of tree and shrubs in these forest divisions. Furthermore, the study also aims to make the vegetation classification of the selected forests.
Materials and Methods
Study area
The study was conducted in the forests of Jaipur district, Rajasthan. The city is located in the northern-eastern end of the Aravalli range and lies between 26°25’ to 27°51’ N and 74°55’ to 76°15’ E. The entire geographical area of the district is 11,143 Km2, with the total forest area of Jaipur is 554.86 Km2 which is 4.98% out of the district’s entire area.30 Except for the monsoon season, the region has a semi-arid climate that is dry. For the study, two forests were selected viz Nahargarh Wildlife Sanctuary (NWLS) and Jamwa Ramgarh Wildlife Sanctuary (JRWLS). The NWLS is located in the Aravalli ranges at Amber hills of Jaipur. The region covers 50 km2 and is located between 26?56'15.08" to 26?57'5.81" N and 75?48'55.70" to 75?46'54.65" E. The JRWLS is the southern expansion of Sariska Tiger Reserve's and is situated to the north-east of Jaipur. It lies between 76? 03’E–27? 02’N (Fig. 1). Champion and Seth27 classified both forests as north tropical thorn forests and dry deciduous forest.
The study area received an average rainfall of 74.8 mm and average maximum and minimum humidity of 87% to 24.42% during the study periods, the average maximum and minimum temperature were 32.41° C and 20.96°C, respectively (Fig. 2) (IMD, 2022). Most of the region is covered with rocks from the Delhi and Aravalli systems, including quartzite, conglomerates, grits, limestone, phyllite, granites, and schist. The sanctuary is mainly covered by red sandy soils. Red soil is often low in nitrogen, phosphorus, and humus content, as well as being alkaline. The forest is spread over different geological and soil formations and hilly forests across the area, Aravalli’s terrain and thus differs in composition.31
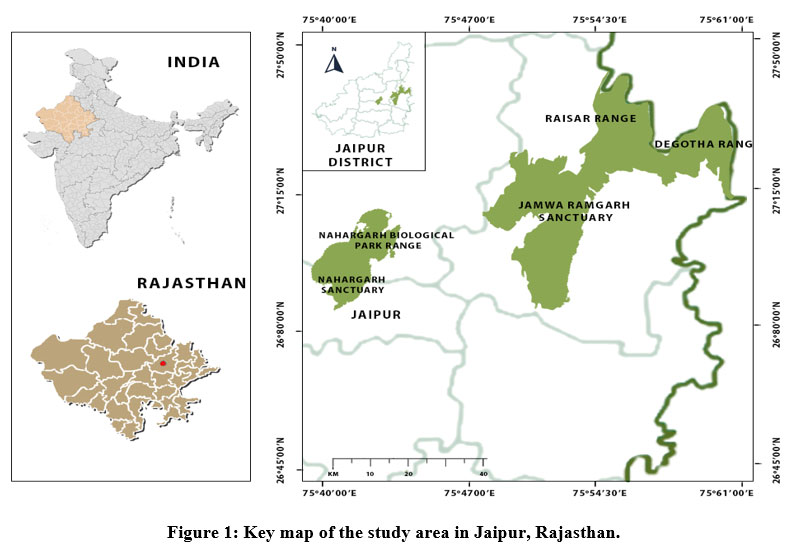 | Figure 1: Key map of the study area in Jaipur, Rajasthan.
|
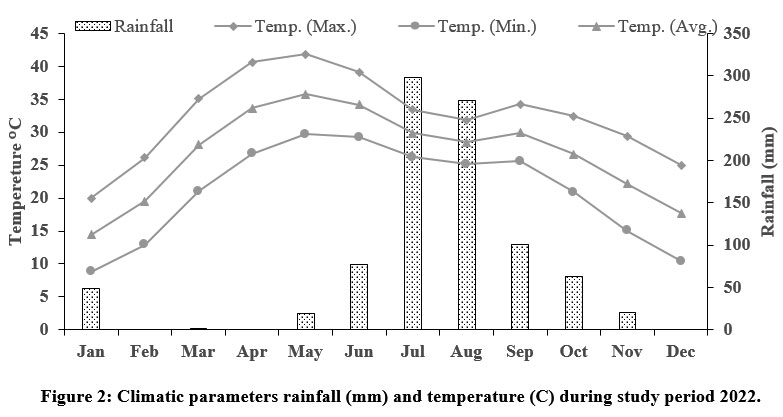 | Figure 2: Climatic parameters rainfall (mm) and temperature (C) during study period 2022.
|
We have selected five forest stands for the study, two in NWLS viz Nahargarh Biological Park, Nahargah Sanctuary, and three sites in JRWLS viz Ramgarh, Raisar, Digota, respectively. The stands were chosen based on forest’s accessibility. All the stands are classified as reserve forests, which have the highest level of protection. The chosen stand’s specifics are provided in (Table 1).
Table 1: Characteristics of the selected forest stands.
Nahargarh WLS | Jamwa Ramgarh WLS | ||||
Parameter | S1 | S2 | S3 | S4 | S5 |
Forest Location | Sisiyawas | Vidhyadhar Nagar | Jamwa Ramgarh | Raisar | Digota, Sankotda |
Altitude (m) | 465 | 514 | 488 | 504 | 652 |
Latitude (N) | 27°1’0 | 26°58’54.18 | 27°1’9.60 | 27°9’5.60 | 27°5’17.29 |
Longitude (E) | 75°50’56 | 76°49’4.26 | 76°0’6.46 | 76°7’8.05 | 76°9’39.67 |
Fores Status | Reserved | Reserved | Reserved | Reserved | Reserved |
Soil moisture (%) | 9.79±0.14 | 9.20±0.48 | 9.50±0.32 | 9.10±0.29 | 10±0.41 |
Soil pH | 6.71±0.07 | 7.17±0.35 | 7.11±0.37 | 7.62±0.19 | 7.20±0.38 |
Values are in means (±) standard deviation
Sampling and Data analysis
Sampling and Data Analysis
For the vegetative analysis of these locations, the phytosociological studies were carried out during the rainy seasons, while for the trees and shrubs, they were done only once, between July to October 2022 among the selected sites in both the forest sanctuaries. To determine the vegetation's most representative composition, a random sample of the vegetation was used for analysis. We use the nested quadrat technique to conduct the vegetation survey. For the study, 68 and 96 quadrats, each of 20×20 m were laid on-site to observe the plants and shrubs, in NWLS and JRWLS respectively, the circumference at breast height for each tree quadrat (cbh; i.e. 164 quadrats, each of 20×20 m) were placed there for the aim of examining trees and sub-quadrats 5×5 m size for shrubs, in Nahargarh WLS and Jamwa Ramgarh WLS respectively, every quadrat’s circumference measured at breast height (cbh; i.e. at 1.37 m above from the base) of every tree (>10 cm cbh) was measured, and those with cbh <10 cm were records as saplings.32 These species Importance Value Index (IVI) were used to determine the dominance of the plant species. Through the examination of the relative frequency, frequency, relative density, density, relative dominance, abundance, and IVI, vegetation composition was assessed using the formula given by Mishra.33
Diversity Indices
The indices viz. shannon-wiener34, simpson35, margalef,36 and pielou37 were calculated to analyse the diversity, concentration of dominance, species richness, and evenness respectively.
Statistical Analysis
The vegetation was classified by agglomerative hierarchical cluster analysis using free version of XLSTAT (version 2023). The ward’s group linkage method and similarity ratio were used to classify plots into comparable groups based on species abundance data.38,39 One-way analysis was used to analyse the significant differences in tree and shrub density and basal area among the different forest stands and also between the sanctuaries using XLSTAT.
Results
Floristic Composition
Out of 164 plots, 92 different plant species were found belonging to 66 genera and 39 families. Out of which 60 species represented from angiosperms, of these, 65.22% species were trees, 24 species (26.09%) were shrubs, and 8 species (8.7%) were climbers. Fabaceae was the most diverse of the plant families, with 20 species and 11 genera. This was followed by with species and genera as Malvaceae (10 species; 6 genera), Capparaceae (4 species; 3 genera), Boraginaceae, Euphorbiaceae, Menispermaceae each representing 3 species and 2 genera, Ebenacea, Moraceae each representing 3 species and 1 genus, respectively. The other families are either represented by 2 or 1 genera. Among the genus, Acacia was the most diversely found genera with 6 species, whereas Grewia was the most frequently found shrub in the forest genera with 5 species. (Appendix A)
Vegetation Density and Basal Area
In the field of study, the total basal area (TBA) and tree density ranges from 18.56 to 34.36 m2/ha and 923 to 1433 tree/ha, respectively. A significantly higher density of trees was found at JRWLS (1319.53 tree/ha than NWLS (994.15 tree/ha) with p < 0.0001, respectively. Among the forest stands, the maximum tree density was estimated at S3 (1433 tree/ha), followed by S4 (1171 tree/ha), S5 (1014 tree/ha), S2 (1086 tree/ha), and S1 (923 tree/ha), respectively. Tree density was significantly different among the five stands (p <0.0001).
Among the tree species, Anogeissus pendula have the with highest density in all the stands except in S4 i.e. with maximum density at S3 (884 tree/ha) followed by S2 (626 tree/ha), S1 (437 tree/ha) and S5 (388 tree/ha), respectively. However, at S4 the species Prosopis juliflora showed maximum density with 217 tree/ha. The other tree species of increased density (tree/ha) were Acacia senegal, Acacia tortilis, Holoptelea integrifolia, P juliflora, Boswellia serrata, respectively.
The basal area in all the studied sites ranged from 18.56 m2/ha (S2) to 34.36 m2/ha (S3), with the mean basal area (MBA) as 27.13 ± 6.43 m2/ha, respectively. A higher value of MBA was for JRWLS (32.89 ± 2.53 m2/ha) than NWLS (21.08 ± 2.99 m2/ha). Among the forest stands, highest TBA was found for S3 (34.36 m2/ha), followed by S5 (31.08 m2/ha), S4 (29.39 m2/ha), S1 (22.27 m2/ha), and S2 (18.56 m2/ha), respectively. The TBA was significantly different among the five stands and between the two sanctuaries i.e. NWLS and JRWLS, respectively (p <0.0001).
Similarly, the TBA was also largest for A. pendula in both the forest stands viz i.e. S1 (14.66 m2/ha) and S2 (6.28 m2/ha) of NWLS and S5 (5.96 m2/ha) of JRWLS. However, in the forest stands S3 and S4 of JRWLS it was B serrata recorded with highest TBA i.e. 13.31 m2/ha, 8.78 m2/ha, respectively. Further there were few species recorded with high TBA were Butea monosperma (3.66 m2/ha), Ailanthus excelsa (3.17 m2/ha), Acacia senegal (2.84 m2/ha), Lannea coromandelica (2.34 m2/ha), Holoptelea integrifolia (1.55 m2/ha), Acacia tortilis (0.23 m2/ha), Prosopis cineraria (0.41 m2/ha), respectively. Among the sanctuaries, B serrata had highest TBA (11.71 m2/ha) at JRWLS, while A pendula (11.61 m2/ha) at NWLS.
For the shrubs, the density ranges from 598 to 1845 tree/ha with higher values at JRWLS (1349.74 tree/ha) than NWLS (783.47 tree/ha). The density of shrubs was found significantly different across the forest stands five stands and among the sanctuaries (p<0.002). At NWLS, Grewia tenax was the most frequently found species both at stand S1 (235 tree/ha) and S2 (209 tree/ha). The other important shrubs found in NWLS were Adhatoda zeylanica, Grewia flavescens and Capparis sepiaria with 58.33%; 72.92 tree/ha. At JRWLS stands, the maximum shrub density was for Adhatoda zeylanica i.e. 376 tree/ha at S3, 575 tree/ha at S4, and 416 tree/ha at S5, respectively. The other commonly found shrubs were Euphorbia caducifolia, Capparis sepiaria, Hibiscus micranthus, and Securinega leucopyrus.
Frequency and IVI
In the study area, A pendula was found to be the most frequently found species all the forest stands also with highest IVI value i.e. S1 (90%; 127.2), S2 (83%; 105.56), S3 (93.65%; 96.18), S5 (85.71%, 68.54), respectively. At S4, the maximum frequency and IVI was for P juliflora (63.16%; 33.15) (Appendix A).
Among the shrubs at NWLS, G tenax was the most frequently found species both at stand S1 (69.77%) and S2 (84%). At JRWLS stands, Grewia flavescens had the highest frequency i.e. 55.56% (S3), 68.42 % (S4), and G tenax with 64.29% at S5 (Table 2).
Table 2: Frequency and density of shrubs in Nahargarh (NWLS) and Jamwa Ramgarh (JRWLS) Sanctuary of Aravalli Forest ranges in Jaipur.
NWLS | JRWLS | ||||
Parameter | S1 | S2 | S3 | S4 | S5 |
Frequency (%) | 427.91 | 332 | 331.75 | 389.47 | 428.57 |
Density (tree/ha) | 901.74 | 574 | 1275 | 1844.74 | 1128.57 |
Diversity Indices
Diversity Indices
The Shannon index (H’) ranges between 1.64 to 2.57 for tree layer, with highest values at stand S5 (2.57) i.e. Raisar, followed by S4 (2.41), S1 (2.01), S2 (1.89) and S3 (1.64). Regarding the tree species, the Simpson index (CD) has a range of 0.12 to 0.40, being maximum at stand S3 (Ramgarh), Margalef index from 3.09 to 6.15 with maximum richness value at S5 (Digota) and Pielou index ranges from 0.45 to 0.78 with maximum evenness at S4 (Raisar) (Table 3).
Table 3: Biodiversity Indices in Nahargarh (NWLS) and Jamwa Ramgarh (JRWLS) Sanctuary of Aravalli Forest ranges in Jaipur.
NWLS | JRWLS | ||||
Indices | S1 | S2 | S3 | S4 | S5 |
Species Diversity Shannon Index (H’) Trees Shrubs | 2.01 2.07 | 1.89 1.81 | 1.64 2.12 | 2.41 2.09 | 2.57 1.92 |
Simpson Index (CD) Trees Shrubs | 0.26 0.20 | 0.35 0.24 | 0.40 0.17 | 0.12 0.17 | 0.17 0.21 |
Species evenness (SE) Pielou Index Trees Shrubs | 0.61 0.70 | 0.53 0.64 | 0.45 0.72 | 0.78 0.74 | 0.70 0.71 |
Species richness (d) Margalef Index Trees Shrubs | 3.53 2.45 | 4.86 2.52 | 4.52 2.23 | 3.09 2.21 | 6.15 2.17 |
For the shrubs, the Shannon diversity was highest (2.12) at S3 (Ramgarh) and lowest (1.81) in S2 (Nahargarh Sanctuary), respectively. Among the other indices, the species richness (2.52) and dominance (0.24) were maximum in stand S2 (Nahargarh Sanctuary), species evenness (0.74) in S4 (Raisar) (Table 3). Among the two sanctuaries, species diversity (H’) and richness were higher for JRWLS (2.83; 8.45) than NWLS (2.80; 7.31). Whereas, the concentration of dominance (CD) and species evenness of NWLS (0.12; 0.68) were high than JRWLS (0.11; 0.65), respectively.
Plant Community Analysis
Five plant community clusters were found using the results of agglomerative hierarchical cluster analysis (Fig. 3). The communities were arranged based on the dominating plant species that had the greatest mean abundance cover for the specific community.
Community type 1 (A pendula-Adhatoda zeylanica) is the major vegetation community comprising largest forest area with 164 sampling plots and highest plant species (87) and is widely distributed all over both the sanctuaries i.e. JRWLS and NWLS. Adhatoda zeylanica and A pendula were the most dominant shrub and tree species identified in that community. The other associated tree species were Flacourtia indica, Naringi crenulata, Euphorbia caducifolia, Grewia flavescens, Grewia tenax, Ziziphus nummularia and Barleria prionitis. The diversity indices determined for this community were shannon diversity, species richness, margalef index, simpson concentration dominance for this community was 2.98, 87, 9.35, and 0.11, respectively. Community type 2 (Acacia Senegal-Grewia flavescens) comprises 3 sampling plots with main associated tree species such as Acacia tortilis, Balanites aegyptiaca, Maytenus emarginata, P juliflora. The diversity indices showed 2.93, 27, 4.63, 0.06 as shannon diversity, species richness, margalef index, and simpson dominance values for this community. This community is mostly dispersed in NWLS. Community type 3 (Wrightia tinctoria) covering one sampling plot of the total samples forest area. The associated tree species of this community are Butea monosperma, Mallotus philippensis. The shannon diversity, species richness, margalef index, simpson dominance for this community was 2.07, 14, 2.94, and 0.17, respectively. The community was observed in JRWLS. Community type 4 (Adhatoda zeylanica) with one sampling plot in JRWLS. Community type 5 (Holoptelea integrifolia-Grewia damine) covers 2 sampling plots. The associated tree species in this community are such as Ceiba pentandra, Grewia flavescens and Gloriosa superba. The diversity was highest for this community with shannon diversity, species richness, margalef index, simpson dominance for this community was 3.52, 55, 8.58, and 0.038, respectively. The location of the community was found to be in NWLS.
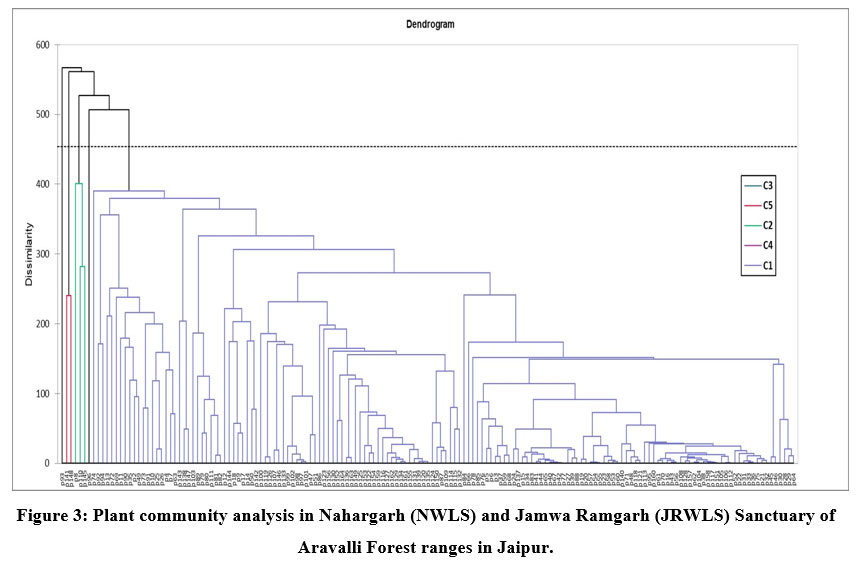 | Figure 3: Plant community analysis in Nahargarh (NWLS) and Jamwa Ramgarh (JRWLS) Sanctuary of Aravalli Forest ranges in Jaipur.
|
Discussion
Tropical dry forests are less complicated structurally and floristically than wet forests, with just half or fewer of the plant species present in moist forests.40 Regarding this, the current investigations indicated that the species composition and variety of the dry forest are comparable to many other dry forests. These studies were carried out in the tropical dry deciduous forests of the NWLS and the JRWLS near Jaipur.
Forest Stand Structure
In the studied forests, a prominence of family Fabaceae has been reported with 20 species and 11 genera. The dominance of leguminous species has also been reported from previous studies on dry forest of Vindhayan highlands of India,41 Ecuador.42 The low soil moisture and nutrient constraint environment in these forests promotes the establishment and survival of nitrogen fixation species.41,43,44 Further, the successful establishment of Fabaceae reflects the environmental conditions governing the pollination and dispersal of these species.39,45
IVI determines the sociological interaction of dominating species in a community in a forest. A pendula was found to be the most prominent species with highest frequency, density, and IVI in all the forest stands (S1, S2, S3, and S5) of both the sanctuaries. Previous studies on similar forests have also reported the dominance of this species in the forests of Sariska National Park.46,47 However, at Raisar (S4) of JRWLS the dominance species of P juliflora was observed with highest frequency, density, and IVI. Being an exotic species, a check is required for its distribution as it might be a potential risk to the locally growing species.48
Tree Density and Basal Area
Basal area of trees it is an essential property for quantifying vegetation composition and site attribute.49 The tree species included in the current study range in basal area from 18.56 to 34.36 m2/ha, with a mean of (27.13 m2/ha). It was within the range reported by previous studies on dry forests (20.79 m2/ha);50 (26.52 m2/ha),51 and is greater than the figures stated for Madhya Pradesh’s tropical dry forests (25 m2/ha),52 tropical thorn forests of North India (3.69–11.99 m2/ha)53 and Peninsula India (15.38 m2/ha).54 However, the basal area was lower as reported for sub-tropical forests of Udaypur district, Nepal (29.52 m2/ha),55 and dry deciduous forests of Raipur (48.29–50.35 m2/ha)56 (Table 4). Basal area of a tree is influenced by level of disturbances, species composition and successional strategies of the forest stands.57 A higher MBA at stand S3 (Ramgarh) of JRWLS could be due to presence of mature individuals of trees species B serrata, A. pendula, Lannea coromandelica which are well adapted in forests.
The tree density estimated for the study area ranges from 923 to 1433 tree/ha with a total of 1134.8 tree/ha and is comparable with tropical dry deciduous forest of Rajasthan (702–1671 tree/ha);58 (650–1520 tree/ha);56 (917–1716 tree/ha),46 Western Ghats of South India (351–1173 tree/ha).59 However, it was higher than range reported in previous studies for tropical dry deciduous forests of India i.e. 517 tree/ha in Tamil Nadu (517 tree/ha),60 Madhya Pradesh (519–859 tree/ha),52 Budelkhand (5.88–7.15 tree/ha),61 West Bengal (547–979 tree/ha),50 tropical thorn forest (159.03 tree/ha),54 semi-arid forest of Delhi and Argentina (633–684 tree/ha),51 (533 tree/ha),62 deciduous dry forest of Central Brazil (513–733 tree/ha),63 sub-tropical forest of Udaypur district, Nepal (1.40 to 431.58 trees/ha).55
A higher density could be attributed to low level of disturbances as these forests are protected areas where anthropogenic activities are regulated. Conversely, tree density of present study area is lower than what has been reported from Mexican tropical deciduous forest (1386 tree/ha).64
Table 4: Comparison of current studies (density and basal area) with other tropical dry deciduous forest stands.
Region and forest type | Density (tree/ha) | Basal Area (m2/ha) | Reference |
Tropical dry deciduous forest, Mexico | 31.3 | 65 | |
Tropical dry forests in Vietnam’s Central Highlands Region | 431.05-562.40 | 5.74-23.7 | 45 |
Deciduous Dry Forest Central Brazil | 513-733 | 19.3-28.3 | 63 |
Chaco semi-arid forest Argentina | 533.33 | 14.59 | 62 |
Mexican tropical deciduous forest | 1386 | 15.9 | 64 |
Sub-tropical forest of Udaypur District of Nepal | 1.40-431.58 | 29.52 | 55 |
Tropical dry deciduous forest, India | 702-1671 | 15.43-71.76 | 58 |
Semi-Arid Forest Delhi, India | 633-684 | 19.87-33.16 | 51 |
Moist deciduous forest, Kollam Kerala | 877 | 26.88 | 66 |
Tropical dry deciduous forest, West Bengal, India | 549.52-979.65 | 8.86-33.22 | 50 |
Tropical dry deciduous forest, Bundelkhand India | 5.88-7.15 | 41.37-59.78 | 61 |
Tropical thorn forest Northern India | 290-850 | 3.69-11.99 | 53 |
Tropical dry deciduous forest Western India | 458-728 | 5.96-19.31 | 67 |
Tropical dry forest of Northern India | 13.54-18.53 | 41 | |
Tropical thorn forest, Peninsular India | 159.03 | 15.38 | 54 |
Tropical dry deciduous forest Madhya Pradesh, India | 519-859 | 20.5-29.5 | 52 |
Tropical deciduous forests of Northcentral Eastern Ghats, India | 395-573 | 13.05-28.42 | 68 |
Tropical forests in Eastern Ghats of Andhra Pradesh, India | 435-767 | 25.82 | 69 |
Dry deciduous forest Raipur, India | 650-1520 | 48.29-50.35 | 56 |
Semi-Evergreen Forest of North-East, India | 90-125 | 70 | |
Tropical dry deciduous forest of Malyagiri hill ranges, Eastern Ghats, India | 443 | 13.73 | 71 |
Tropical dry forests of Eastern Ghats, India | 479 | 15.20 | 72 |
Tropical dry deciduous forest Tamil Nadu, India | 517 | 16.72 | 60 |
Tropical dry deciduous forest India | 917.2-1716.7 | 3-32.73 | 46 |
Pench Tiger Reserve, Maharashtra, India | 433.75 | 13.7 | 73 |
Tropical dry deciduous forests of Tiruvannamalai, Tamil Nadu, India | 450.5-727 | 18.85-27.2 | 74 |
Western Ghats, South India | 352-1173 | 28.05-81.38 | 59 |
Tropical deciduous forests of Eastern Ghats, India | 268.33-655.47 | 6.65-22.28 | 75 |
Dry tropical forest in Balamdi Watershed of Chhattisgarh Plain | 237.50-231.25 | 4.99-5.14 | 76 |
Singara Range, Western Ghats, India | 524 | 25.32 | 77 |
Tropical dry deciduous forest of Eastern Ghats, Andhra Pradesh, India | 674-796 | 8.55-26.89 | 78 |
Tropical dry deciduous forest of Rajasthan, India | 923-1433 | 18.56-34.36 | Present Study |
Shrubs Density and Frequency
Grewia was the most frequently found shrub in the forest genera with 5 species. The S4 (Raisar) stand has a higher shrub density than the other disturbed forest stands. In the current study, the S4 (Raisar) stand showed strong regeneration, and anthropogenic disturbances like fuelwood collecting, lopping, cutting, and grazing were found to be minimal. The lowest density was recorded in S2 (Nahargarh Sanctuary), indicating inadequate regeneration in this stand. This poor regeneration of shrubs could be attributed to low levels of fertility which effect the seed germination or fruiting significantly decreasing the sapling population.8 Several biotic and abiotic factors including drought, soil water availability, light, level of disturbances, ground cover, and herbivory also shown to affect the successful development and establishment of shrubs seedlings. 79,80,81,82
Diversity Indices
Species diversity is determined by species adaptability and increases in tandem with community stability. In the current forests viz NWLS and JRWLS, the Shannon-Weiner (H?) index varied from 1.65 to 2.57, which is between the 0.67–4.86 reported range seen in the Indian sub-continent tropical forests (1.85–2.05);75 (0.67–0.79);67 (2.20–2.65).59 These numbers suggest that the tropical deciduous forest of currently is an ecosystem rich in species. The variation in species diversity among the different forest stands could be explained by various physiographic, edaphic and biotic factors affecting the distribution of species both at landscapes and forest sites.39,83 Species diversity when compared with other tropical dry forests of India is lower than deciduous forest of Northcentral Eastern Ghats, (3.80);68 Eastern Ghats, Andhra Pradesh, (4.97);78 Bundelkhand (3.60);61 Tamil Nadu (2.83).60 However, the diversity indices were higher than previous studies from tropical dry deciduous forests Tiruvannamalai, Tamil Nadu (1.95);74 Maharashtra (2.92);73 Western India (0.73);67 Northern India (3.32)41 and tropical thorn forest Peninsular (1.76).54
Further, the equal representation of the species in a community can be understood by species evenness. The high values of species evenness, diversity, and lower dominance from Raisar and Digota stands of JRWLS, indicates preferential environmental conditions for the existence of the community.
An overall high species diversity of both trees and shrubs at JRWLS as compared to NWLS could be attributed to favourable environmental gradients to which biotic communities interact.38 The variation in diversity indices among the forest stands could be due to level and type of disturbances, physiographic factors such as altitude, slope, soil type and other environmental elements that were not taken into account for the present study. The current phytosociological examination offers researchers and policymakers with data on forest inventory and its significance for future conservation initiatives of tropical dry deciduous forests in these regions. The study also observed the remarkable occurrence of two IUCN listed critically endangered species of Indian Thar Desert viz Commiphora wightii and Tecomella undulata in the research area.
Plant Community Types
The five types of plant communities are occupying the forests of NWLS and JRWLS of Jaipur. There is a little fluctuation in species diversity, evenness, and dominance among these communities. Overall, the community type 1 dominated with A pendula-Adhatoda zeylanica is the most widespread community of the study area. However, the other communities viz community 2, and 3 also showed higher diversity. This could also be due to few sampling plots occupied by these communities. Also, the variation in diversity among the communities could be further explained by biotic and abiotic factor along with anthropogenic influences.39
Conclusion
The current study analyses the composition, biodiversity and community types of vegetation in NWLS and JRWLS forests of Jaipur. A total of 92 species and 39 families were documented with the dominance of family Fabaceae with 20 species and 11 genera. Among the shrubs Adhatoda zeylanica found to be the most dominating species. The study reported higher the density, basal area and IVI in JRWLS forest as compared NWLS. Among the trees A pendula was found to be the most dominating species in both the sanctuaries. The hierarchal clustering classified five community types indicating the maximum distribution of A pendula-Adhatoda zeylanica community in these forests. Further, the biodiversity indices suggested an overall higher diversity in JRWLS forest as compared NWLS, respectively.
The variation in vegetation composition and species diversity are determined mainly by various environmental and biotic factors at a specific site. The data on phytosociological factors, distribution patterns, and tree species variety in a forest are valuable to forest managers, researchers, and scientists in developing efficient forest conservation management plans. Since the study was focused on species composition and biodiversity levels among the two forest sanctuaries (NWLS, JRWLS). However, for framing future management strategies in dry forests a further investigation on distribution of plant community types on the basis of climate variables and physiographic level, soil properties in required.
Acknowledgement
We thank University of Rajasthan for providing research and Development Grant. We are also grateful to the forest officials of different areas for allowing and providing facilities to pursue the study. Acknowledgements are also due to various field assistants for their help in surveys in different sites.
Funding Sources
Authors are grateful to the Council of Scientific and Industrial Research (CSIR) for funding.
Naveen Kumar – Ref.no: 17/12/2017(ii) EU-V
Priyanka Jatav – Ref.no: 617/ (CSIR-UGC NET DEC. 2018)
Conflict of Interest
The authors declare that there are no conflicts of interest.
Authors’ Contribution
Naveen Kumar: Contributed by formulating the concept, composing the paper, compiling data, creating graphs and writing the first drafts. Sonali Tiwari: Review and validation of the article, Priyanka Jatav: Review and validation of the article. Dr. Archana Meena: Recommended a critical evaluation of the paper and concluded the approval of the version to be submitted to the journal.
Data Availability Statement
The manuscript incorporates all datasets produced or examined throughout this research study are available on request from the corresponding author.
Ethics Statement
It has not been studied on humans or animals.
References
- Cosovic M., Bugalho M. N., Thom D., and Borges J. G. Stand structural characteristics are the most practical biodiversity indicators for forest management planning in Europe. Forests. (2020); 11:343.
CrossRef - Haq S. M., Lone F. A., Waheed M., Siddiqui M. H., Arshad F., and Bussmann R. W. Analyzing anthropogenic determinants of vegetation distributions pattern in high elevation forests of the Himalayas. Pak. J. Bot. (2024a); 56, 1441–1450.
CrossRef - Haq S. M., Waheed M., Darwish M., Siddiqui M. H., Goursi U. H., Kumar M. Biodiversity and carbon stocks of the understory vegetation as indicators for forest health in the Zabarwan Mountain range, Indian Western Himalaya. Ecol. Indic. (2024b); 159:111685.
CrossRef - Chawla A., Rajkumar S., Singh K. N., Lal B., Singh R. D. Plant species diversity along an altitudinal gradient of Bhabha Valley in western Himalaya. J. Mt. Sci. 2008; 5(2), 157-177.
CrossRef - Pandita S., Kumar V., Dutt H. C. Environmental variables vis-a-vis distribution of herbaceous tracheophytes on northern sub-slopes in Western Himalayan ecotone. Ecol. Proces. 2019; 8(1):1-9.
CrossRef - Sinha S., Badola H. K., Chhetri B., Gaira K. S. Effect of altitude and climate in shaping the forest compositions of Singalila National Park in Khangchendzonga Landscape, Eastern Himalaya, India. J. Asia-Pacific biodiverse. 2018; 11(2):267-275.
CrossRef - Joshi V. C., Chandra N. Pattern of diversity and regeneration potential along altitudinal gradient in selected forest stands of Kumaun Himalaya. Indian For. 2020; 146(4):301-305.
CrossRef - Sarkar M., Devi A. Assessment of diversity, population structure and regeneration status of tree species in Hollongapar Gibbon Wildlife Sanctuary, Assam, Northeast India. Trop. Plant Res. 2014; 1 (2):26-36.
- Mandal G., Joshi S. P. Analysis of vegetation dynamics and phytodiversity from three dry deciduous forests of Doon Valley, Western Himalaya, India. J. Asia-Pacific biodiverse. 2014; 7:292-304.
CrossRef - Turner M. G. Landscape heterogeneity and disturbance. Springer-Verlag, New York, 1987; 240pp.
CrossRef - Attua E. M., Pabi O. Tree species composition, richness and diversity in the northern forest-savanna ecotone of Ghana. J. Appl. Biosci. 2013; 69:5437-5448.
CrossRef - Rennolls K., Laumonier Y. Species diversity structure analysis at two sites in the tropical rain forest of Sumatra. J. Trop. Ecol. 2000; 16:253-270.
CrossRef - Baraloto C., Molto Q., Rabaud S., Hérault B., Valencia R., Blanc L., Fine P.V.A. & Thompson J. Rapid simultaneous estimation of above ground biomass and tree diversity across Neotropical forests: a comparison of field inventory methods. Biotropica. 2013; 45: 288-298.
CrossRef - Giriraj A., Murthy M., Ramesh B. Vegetation composition, structure and patterns of diversity: a case study from the tropical wet evergreen forests of the Western Ghats, India. Edin. J. Bot. 2008; 65, 1-22.
CrossRef - Pappoe A. N., Armah F. A., Quaye E. C., Kwakye P. K., Buxton G. N. Composition and stand structure of a tropical moist semideciduous forest in Ghana. Int. Res. J. Plant Sci. 2010; 1(4):095-106.
- Burju T., Hundera K., Kelbessa E. Floristic composition and structural analysis of Jibat humid afromontane forest, West Shewa zone, Oromia national regional state, Ethiopia. Ethiop. J. Educ. Sci. 2013; 8(2):11-34.
CrossRef - Masresha G., Soromessa T., Kelbessa E. Status and species diversity of Alemsaga forest, Northwestern Ethiopia. Adv. Life Sci. Technol. 2015; 34, 87-99.
- Kuma M., Shibru S. Floristic composition, vegetation structure, and regeneration status of woody plant species of Oda Forest of Humbo Carbon Project, Wolaita, Ethiopia. J. Bot. 2015; (2):1-9.
CrossRef - Addi A., Soromessa T., Kelbessa E., Dibaba A., Kefalew A. Floristic composition and plant community types of Agama Forest, an Afromontane Forest in Southwest Ethiopia. J. Ecol. Nat. Environ. 2016; 8(5):55-69.
CrossRef - Siraj M., Zhang K., Sebsebe D., Zerihun W. Floristic composition and plant community types in Maze National Park, southwest Ethiopia. Appl. Ecol. Environ. Res. 2017; 15(1):245-262.
CrossRef - Addo-Fordjour P., Obeng S., Anning A., Addo M. Floristic composition, structure and natural regeneration in a moist semideciduous forest following anthropogenic disturbances and plant invasion. Int. J. Biodvers. Conserv. 2009; 1(2):021-037.
- Ali F., Khan N., Ali K., Khan M. E. H., Jones D.A. Vegetation pattern and regeneration dynamics of the progressively declining Monotheca buxifolia forests in Pakistan: implications for conservation. Sustainability. 2022; 14 (10), 6111.
CrossRef - Sharma A., Patel S. K., Singh G. S. Traditional knowledge of medicinal plants among three tribal communities of Vindhyan highlands, India: an approach for their conservation and sustainability. Environ. Sustain. 2021; 1e35.
CrossRef - Patel S. K., Sharma A., Singh R., Tiwari A. K., Singh G. S. Diversity and distribution of traditional home gardens along different disturbances in a dry tropical region, India. Front. for. glob. change. 2022; 5:822320.
CrossRef - Macheroum A., Achoubi L. K., Neffar S., Chenchouni H. Environmental drivers of taxonomic and phylogenetic diversity patterns pf plant communities in semi-arid steppe rangelands of North Africa. Ecol. Indic. 2021; 132(3):108279.
CrossRef - Jhurawat R., Pani P., Mahala A. Aridity assessment of semi-arid agro-climatic zones: a study of Eastern Rajasthan. Annals, Nagi. 2020; 40(1):77-93.
CrossRef - Champion H. G., Seth S. K. A revised survey of the forest types of India. Government of India Publications, New Delhi, India. 1968; 404 pp.
- Sinha G. N. An Introduction to the Delhi Ridge. Department of Forests & Wildlife, Govt. of NCT of Delhi, New Delhi, India, 2014; xxiv + 154 pp.
- Ouinsavi C., Sokpon N. Morphological variation and ecological structure of Iroko (Milicia excelsa Welw. C.C. Berg) populations across different biogeographical zones in Benin. Int. J. For. Res. 2010; 1-10.
CrossRef - FSI (2021) State of forest report. Forest Survey of India, FSI (Ministry of Environment and forests) Government of India, Dehradun. 2021.
- Government of Rajasthan (GOR) Forest Department Nahargarh Wildlife Sanctuary Management Plan 2008-9 to 2017-18. Deputy Conservation of Forest, Jaipur, Rajasthan, India. 2018; pp. 157.
- Pande P. K., Bisht A. P. S., Sharma S. C. Comparative vegetation analysis of some plantation ecosystems. Indian For. 1988; 114:379-388.
- Mishra R. Ecology work book. Calcutta, New Delhi: Oxford and IBH Publishing Company. 1968.
- Shannon C. E., Weaver W. The mathematical theory of communication. University of Illinois Press, Urbana, USA. 1963; 117 pp.
- Simpson E. H. Measurement of diversity. Nature, 1949; 163:688.
CrossRef - Margalef R. Perspectives in ecological theory. University of Chicago Press, Chicago. 1968; 111 pp.
- Pielou E. C. Shannon’s formula as a measure of specific diversity: Its use and misuse. Am. Nat. 1966; 100(914):463-465.
CrossRef - Sewale B., Mammo Siraj. Analysis of floristic composition and plant community types in Kenech natural forest, Kaffa Zone, Ethiopia. Trees For. People.2022; 7:100170.
CrossRef - Dibaba A., Soromessa T., Warkineh B. Plant community analysis along environmental gradients in moist afromontane forest of Gerba Dima, South-western Ethiopia. BMC Ecol. Evol. 2022; 22:12.
CrossRef - Murphy P. G., Lugo A. E. Ecology of tropical dry forest. Annual Review of Ecology and Systematics. 1986; 17(1):67-88.
CrossRef - Sharma A., Patel S. K., Singh G. S. Variation in species composition, structural diversity, and regeneration along disturbances in tropical dry forest of Northern India. J. Asia-Pacific biodiverse. 2023; 16:83-95.
CrossRef - Graefe S., Rodrigo R., Cueva E., Butz P., Werner F. A., Homeier J. Impact of disturbance on forest structure and tree species composition in a tropical dry forest of South Ecuador. Ecotropica. 2020; 22:202002.
- Singh R., Sagar R., Srivastava P., Singh P. Herbaceous species diversity and soil attributes along a forest-savanna-grassland continuum in a dry tropical region. Ecol. Eng. 2017; 103:226-235.
CrossRef - Vargas G. G., Werden L. K., Powers J. S. Explaining legume success in tropical dry forests based on seed germination niches. Biotropica. 2015; 47:277-280.
CrossRef - Tuan N. T., Bao T. Q., Rodríguez-Hernández D. I., Gliottone I. Tree diversity and species composition of tropical dry forests in Vietnam’s Central Highlands region. For. Studies, 2021; 75:80-103.
CrossRef - Sultana A., Hussain M. S., Rathore D. K. Diversity of tree vegetation of Rajasthan, India. Trop. Ecol. 2014; 55(3):403-410.
- Kidwai Z. Vegetation structure and composition in core area of Sariska National Park, Rajasthan. Indian For. 2013; 139(7):636-644.
- Robinson M. D. The importance of native trees in sustaining biodiversity in arid lands. In: Conserving Biodiversity in Arid Regions. Best Practices in Developing Nations. Lemons, J; Victor, R. & Schaffer, D. (eds.) Kluwer Academic Publishers, Boston 2003; 395-412 pp.
CrossRef - Suthari S. Biodiversity characterization and aboveground vegetation carbon pool assessment in Northern Telangana at landscape level using geospatial technique (PhD Thesis). Department of Botany, Kakatiya University, Warangal. 2013.
- Pradhan B., Rahaman C. H. Phytosociological study of plant species in three tropical dry deciduous forests of Birbhum District, West Bengal, India. Journal of Biodiversity and Environmental Sciences. 2015; 7:22-31.
- Meena A., Hanief M., Bidalia A., Rao K.S. Structure, composition and diversity of tree strata of semi-arid forest community in Delhi, India. Phytomorphology, 2016; 66(3&4):95-102.
- Raha D., Dar J. A., Pandey P. K., Lone P. A., Verma S., Khare P. K., Khan M. L. Variation in tree biomass and carbon stocks in three tropical dry deciduous forest types of Madhya Pradesh, India. Carbon Manag. 2020; 11: 109-120.
CrossRef - Sharma V., Chaudhry S. Vegetation composition and plant diversity in mining disturbed tropical thorn forest of Asola-Bhatti Wildlife Sanctuary, Northern India. Taiwania, 2018; 63(3):267-280.
- Izayas J. E., Udayakumar M. Density, diversity and community composition of trees in tropical thorn forest, peninsular India. Curr. Bot. 2021; 12:138-145.
CrossRef - Ayer S., Gautam J., Chaudhary P., Poudel S., Ayer K. Assessment of Species Composition, Diversity and Carbon Stock in a Community Managed Forest of Udaypur District of Nepal. Our Nature. 2024; 22 (1): 28-40.
CrossRef - Bargali S. S., Pandey V. P., Bargali K. Floral composition and diversity pattern in open and closed dry deciduous forest. Int. J. Plant Res. 2014; 27(2):149-157.
- LaFrankie J. V., Ashton P. S., Chuyong G. B., Co L. Contrasting structure and composition of the understory in species-rich tropical rainforests. Ecology, 2006; 87:2298-2305.
CrossRef - Joshi R. K., Dhyani S. Biomass, carbon density and diversity of tree species in tropical dry deciduous forests in Central India. Acta. Ecol. Sin. 2018; 39(4):289-299.
CrossRef - Sundarapandian S. M., Swamy P. S. Forest ecosystem structure and composition along an altitudinal gradient in the Western Ghats, South India. J. Trop. For. Sci. 2000; 12:104-123.
- Karthikeyan C., Dhamotharan R. Density, species richness and diversity of trees in a sacred grove-tropical dry deciduous forest, Dharmapuri district, Tamil Nadu, South India. Sch. Acad. J. Biosci. 2015; 3:536-540.
- Verma M., Pal A. Species diversity, dominance and equitability in tropical dry deciduous forest of Bundelkhand region, India. Biodivers. Int. J. 2019; 3:145-154.
CrossRef - Casenave J. L., Pelotto J. P., Protomastro J. Edge-interior differences in vegetation structure and composition in a Chaco semi-arid forest, Argentina. For. Ecol. Manag. 1995; 72:61-69.
CrossRef - Sampaio A., Scariot A. Edge effect on tree diversity, composition and structure in a deciduous dry forest in Central Brazil. Rev. Arvore. 2011; 35(5):1121-1134.
CrossRef - Duran E., Meave J. A., Lott E. J., Segura G. Structure and tree diversity patterns at the landscape level in a Mexican tropical deciduous forest. B. Soc. Bot. Mex. 2006; 79:43-60.
CrossRef - Cairns M. A., Olmsted I., Granados J., Argaez J. Composition and aboveground tree biomass of a dry semi-evergreen forest on Mexico's Yucatan Peninsula. For. Ecol. Manag. 2003; 186(1-3):125-132.
CrossRef - Bilyaminu H., Vidyasagaran K., Gopakumar S.,Vijaykumar N. Ecological studies on southern secondary moist deciduous forest of Shendurney Wildlife Sanctuary, Kollam, Kerala, India. Indian J. Ecol. 2021; 48: 1747-1754.
- Kumar J. I. N., Kumar R. N., Bhoi R. K., Sajish P. R. Tree species diversity and soil nutrient status in three sites of tropical dry deciduous forest of western India. Trop. Ecol. 2010; 51: 273-279.
- Naidu M. T., Premavani D., Suthari S., Venkaiah M. Assessment of tree diversity in tropical deciduous forests of Northcentral Eastern Ghats, India. Geol. Ecol. Landsc. 2018; 2: 216-227.
CrossRef - Naidu M. T., Kumar O. A. Tree diversity, stand structure, and community composition of tropical forests in Eastern Ghats of Andhra Pradesh, India. J. Asia-Pacific biodiverse. 2016; 9(3):328-334.
CrossRef - Lalfakawma., Sahoo U. K., Roy S., Vanlalhriatpuia K., Vanalalhluna P. C. Community composition and tree population structure in undisturbed and disturbed tropical semi-evergreen forest stands of North-East India. Appl. Ecol. Environ. Res. 2010; 7: 303-318.
CrossRef - Sahu S. C., Dhal N. K., Mohanty R. C. Tree species diversity, distribution and population structure in a tropical dry deciduous forest of Malyagiri hill ranges, Eastern Ghats, India. Trop. Ecol. 2012; 53:163-168.
- Sahu S. C., Suresh H. S., Ravindranath N. H. Forest structure, composition and above ground biomass of tree community in tropical dry forests of Eastern Ghats, India. Not Sci Biol. 2016; 8(1):125-133.
CrossRef - Dudipala R., Kolagani C., Shukla P., Shukla P. Species diversity, phytosociological attributes and regeneration status of Pench Tiger Reserve, Maharashtra, India. Int. J. Environ. Clim. 2023; 13(10):1743-1757.
CrossRef - Gandhi D. S., Sundarapandian S. Inventory of trees in tropical dry deciduous forests of Tiruvannamalai district, Tamil Nadu, India. Biodiversitas. 2014; 15(2):169-179.
CrossRef - Panda P. C., Mahapatra A. K., Acharya P. K., Debata A. Plant diversity in tropical deciduous forests of Eastern Ghats, India: A landscape level assessment. Int. J. Biodivers. 2013; 5(10):625-639.
- Bijalwan A. Structure, composition and diversity of degraded dry tropical forest in Balamdi Watershed of Chhattisgarh plain, India. Biodivers. J. 2010; 1(2):119-124.
CrossRef - Singh D., Verma S., Jayakumar S. Tree inventory along the altitudinal gradients in Singara Range, Western Ghats, India. International Academy of Ecology and Environmental Sciences 2016; 6(4):97-109.
- Reddy C. S., Babar S., Giriraj A., Reddy K. N., Rao K. T. Structure and floristic composition of tree diversity in tropical dry deciduous forest of Eastern Ghats, Southern Andhra Pradesh, India. J. Asian Sci. Res. 2008; 1:57-64.
CrossRef - Tripathi S. N., Raghubanshi A. S. Seedling growth of five tropical dry forest tree species in relation to light and nitrogen gradients. J. Plant Ecol. 2014; 7:250-263.
CrossRef - Bhadouria R., Singh R., Srivastava P. Understanding the ecology of tree seedling growth in dry tropical environment: a management perspective. Energy Ecol. Environ. 2016; 1:296-309.
CrossRef - Bhadouria R., Srivastava P., Singh R., Tripathi S., Singh H., Raghubanshi A. S. Tree seedling establishment in dry tropics: an urgent need of interaction studies. Environ. Syst. Decis. 2017; 37:88-100.
CrossRef - Kumar R., Saikia P. Population structure and regeneration status of Shorea robusta and associated trees in Sal forests of Ranchi, Eastern India. Trop. Ecol. 2021; 62:34-51.
CrossRef - Tuomisto H., Ruokolainen K., Yli-Halla M. Dispersal, environment, and floristic variation of Western Amazonian forests. Science, 2003; 299:241-4.
CrossRef
Appendix A. Density, frequency, basal area and importance value index (IVI) of the tree species across the selected sites, in Nahargarh and Jamwa Ramgarh Wildlife Sanctuaries.
Nahargarh Biological Park (S1)
Species | Family | F (%) | Density tree/ha | IVI | Basal Area m2/ha |
Acacia catechu (L.) Willd. Oliv. | Fabaceae | 2.33 | 1.16 | 0.63 | 0.02 |
Acacia leucophloea (Roxb.) Willd. | Fabaceae | 32.56 | 29.65 | 11.34 | 0.57 |
Acacia nilotica (L.) Del, | Fabaceae | 4.65 | 1.74 | 1.07 | 0.02 |
Acacia senegal Sensu O.B.Mill | Fabaceae | 55.81 | 112.79 | 26.91 | 1.14 |
Acacia tortilis (Forssk.) Hayne | Fabaceae | 53.49 | 59.3 | 24.06 | 1.89 |
Anogeissus pendula Edgew. | Combretacea | 90.7 | 436.63 | 127.2 | 14.33 |
Bauhinia racemosa Lam. | Fabaceae | 13.95 | 6.98 | 4.63 | 0.33 |
Balanites aegyptiaca (L.) Delile. | Zygophyllaceae | 20.93 | 31.98 | 7.37 | 0.07 |
Boswellia serrata Roxb. ex Cocleb | Burseraceae | 4.65 | 1.74 | 1.04 | 0.01 |
Butea monosperma (Lam.) Taub. | Fabaceae | 9.3 | 4.07 | 3.02 | 0.22 |
Cocculus pendulus (J.R.Forst. & G.Forst.) Diels | Menispermaceae | 13.95 | 6.4 | 3.16 | 0.02 |
Commiphora wightii (Arn.) Bhandari | Burseraceae | 11.63 | 6.4 | 2.76 | 0.02 |
Crateva religiosa G. Forst. | Capparaceae | 2.33 | 6.4 | 1.14 | 0.01 |
Dichrostachys cinerea Wight et Arn. | Fabaceae | 46.51 | 60.47 | 14.98 | 0.10 |
Ehretia laevis Roxb. | Boraginaceae | 9.3 | 2.91 | 1.92 | 0.01 |
Holoptelea integrifolia (Roxb.) Planch. | Ulmaceae | 13.95 | 6.4 | 4.48 | 0.31 |
Lannea coromandelica (Houtt.) Merr. | Anacardiaceae | 20.93 | 13.37 | 5.75 | 0.16 |
Maytenus emarginata (Willd.) Ding Hou | Celastraceae | 55.81 | 45.93 | 16.35 | 0.40 |
Mitragyna parvifolia (Roxb.) Korth. | Rubiaceae | 4.65 | 5.23 | 1.8 | 0.10 |
Moringa oleifera Lam. | Moringaceae | 2.33 | 1.16 | 1.07 | 0.12 |
Pongamia pinnata (L.) Pierre | Fabaceae | 2.33 | 0.58 | 0.49 | 0.01 |
Prosopis ceneraria (L.) Druce. | Fabaceae | 37.21 | 20.93 | 16.01 | 1.64 |
Prosopis juliflora (Swartz.) DC. | Fabaceae | 51.16 | 47.09 | 16.28 | 0.54 |
Salvadora persica L. | Salvadoraceae | 2.33 | 0.58 | 0.47 | 0.01 |
Sterculia urens Roxb. | Sterculiaceae | 2.33 | 3.49 | 1.43 | 0.14 |
Wrightia tinctoria (Roxb.) R. Br. | Apocynaceae | 6.98 | 4.65 | 2.01 | 0.07 |
Ziziphus mauritiana Lam. | Rhamnaceae | 11.63 | 4.65 | 2.64 | 0.03 |
Nahargarh Sanctuary (S2)
Species | Family | F (%) | Density tree/ha | IVI | Basal Area m2/ha |
Acacia jacquemontii Benth. | Fabaceae | 4 | 1 | 0.84 | 0.02 |
Acacia leucophloea (Roxb.) Willd. | Fabaceae | 4 | 1 | 1.23 | 0.09 |
Acacia nilotica (L.) Del, | Fabaceae | 8 | 3 | 2.44 | 0.16 |
Acacia senegal Sensu O.B.Mill. | Fabaceae | 52 | 69 | 21.15 | 1.17 |
Acacia tortilis (Forssk.) Hayne | Fabaceae | 12 | 10 | 5.68 | 0.51 |
Albizia lebbeck (L.) Benth. | Fabaceae | 4 | 2 | 1.83 | 0.18 |
Anogeissus pendula Edgew. | Combretacea | 80 | 626 | 105.56 | 6.28 |
Azadirecta indica A. Juss. | Meliaceae | 16 | 6 | 7.30 | 0.75 |
Bauhinia racemosa Lam. | Fabaceae | 28 | 13 | 9.22 | 0.64 |
Balanitis aegyptiaca (L.) Delile. | Zygophyllaceae | 4 | 1 | 0.78 | 0.01 |
Boswellia serrata Roxb. ex Cocleb | Burseraceae | 8 | 6 | 3.62 | 0.32 |
Butea monosperma (Lam.) Taub. | Fabaceae | 8 | 2 | 2.80 | 0.24 |
Clerodendrum phlomidis L. f. | Lamiaceae | 8 | 13 | 2.52 | 0.01 |
Cocculus hirsutus | Menispermaceae | 12 | 7 | 2.77 | 0.04 |
Commiphora wightii (Arn.) Bhandari | Burseraceae | 36 | 30 | 10.03 | 0.28 |
Cordia sinensis Lam. | Boraginaceae | 4 | 1 | 1.17 | 0.08 |
Crateva religiosa G. Forst. | Capparaceae | 16 | 35 | 7.21 | 0.26 |
Dalbergia lanceolaria L. f. | Fabaceae | 12 | 5 | 2.70 | 0.06 |
Dalbergia sissoo DC. | Fabaceae | 4 | 2 | 0.99 | 0.03 |
Dichrostachys cineraria Wight et Arn. | Fabaceae | 48 | 22 | 9.73 | 0.02 |
Diospyros melanoxylon Roxb. | Ebenaceae | 4 | 4 | 1.73 | 0.13 |
Ehretia laevis Roxb. | Boraginaceae | 24 | 13 | 5.44 | 0.08 |
Euphorbia neriifolia L. | Euphorbiaceae | 4 | 2 | 0.87 | 0.01 |
Flacourtia indica (Burm.f.) Merr. | Salicaceae | 12 | 5 | 2.64 | 0.05 |
Grewia damine Gaertn. | Malvaceae | 24 | 38 | 9.26 | 0.35 |
Holoptelea integrifolia (Roxb.) Planch. | Ulmaceae | 52 | 58 | 28.22 | 2.61 |
Lannea coromandelica (Houtt.) Merr. | Anacardiaceae | 44 | 29 | 17.49 | 1.4 |
Maytenus emarginata (Willd.) Ding Hou | Celastraceae | 28 | 32 | 12.04 | 0.83 |
Mitragyna parvifolia (Roxb.) Korth. | Rubiaceae | 8 | 3 | 3.23 | 0.3 |
Naringi crenulate (Roxb.) Nicolson | Rutaceae | 4 | 3 | 0.97 | 0.01 |
Prosopis cineraria (L.) Druce. | Fabaceae | 4 | 1 | 1.34 | 0.11 |
Sterculia urens Roxb. | Sterculiaceae | 4 | 1 | 0.78 | 0.01 |
Tecomella undulata (Sm.) Seem. | Bignoniaceae | 8 | 3 | 7.44 | 1.05 |
Wrightia tinctoria (Roxb.) R. Br. | Apocynaceae | 40 | 37 | 12.21 | 0.44 |
Ziziphus mauritiana Lam. | Rhamnaceae | 4 | 2 | 0.99 | 0.03 |
Jamwa Ramgarh (S3)
Species | Family | F (%) | Density tree/ha | IVI | Basal Area m2/ha |
Acacia leucophloea (Roxb.) Wild. | Fabaceae | 7.94 | 3.57 | 1.83 | 0.06 |
Acacia nilotica (L.) Del. | Fabaceae | 3.17 | 0.79 | 0.68 | 0.02 |
Acacia senegal Sensu O.B.Mill. | Fabaceae | 28.57 | 51.59 | 10.69 | 0.68 |
Acacia tortilis (Forssk.) Hayne | Fabaceae | 12.70 | 11.51 | 4.1 | 0.35 |
Aegle marmelus (L.) Corr. | Rutaceae | 1.59 | 2.38 | 0.47 | 0.01 |
Albizia lebbeck (L.) Bent | Fabaceae | 1.59 | 0.4 | 0.36 | 0.02 |
Anogeissus pendula (L.) Wild. | Combretacea | 93.65 | 884.13 | 96.18 | 6.10 |
Azadirecta indica Juss. | Meliaceae | 1.59 | 0.4 | 0.32 | 0.01 |
Bauhinia racemosa Lam. | Fabaceae | 4.76 | 1.19 | 1.07 | 0.05 |
Boswellia serrata Roxb. ex Coleb | Burseraceae | 68.25 | 124.21 | 59.59 | 13.31 |
Butea monosperma (Lam.) Taub. | Fabaceae | 47.62 | 53.57 | 21.29 | 3.11 |
Cassia fistula L. | Fabaceae | 34.92 | 38.49 | 11.56 | 0.91 |
Ceiba pentandra (L.) Gaertn. | Malvaceae | 1.59 | 1.19 | 0.39 | 0.01 |
Commiphora wightii (Arn.) Bhandari | Burseraceae | 3.17 | 9.92 | 1.28 | 0.01 |
Cordia dichotoma G. Forst. | Boraginaceae | 3.17 | 1.59 | 0.89 | 0.07 |
Crateva religiosa G. Forst. | Capparaceae | 1.59 | 0.79 | 0.36 | 0.01 |
Dalbergia sissoo DC. | Fabaceae | 1.59 | 0.4 | 0.32 | 0.01 |
Dichrostachys cinerea Wight et Arn. | Fabaceae | 31.75 | 44.05 | 8.96 | 0.08 |
Diospyros melanoxylon Roxb. | Ebenaceae | 3.17 | 0.79 | 0.7 | 0.02 |
Ehretia laevis Roxb. | Boraginaceae | 3.17 | 1.19 | 0.654 | 0.002 |
Eucalyptus camaldulensis Dehnh. | Myrtaceae | 1.59 | 0.4 | 0.48 | 0.06 |
Ficus benghalensis L. | Moraceae | 3.17 | 1.19 | 3.61 | 1.02 |
Ficus racemosa L. | Moraceae | 11.11 | 5.16 | 6.83 | 1.54 |
Ficus religiosa L. | Moraceae | 1.59 | 0.4 | 0.49 | 0.06 |
Grewia asiatica L. | Malvaceae | 1.59 | 0.4 | 0.34 | 0.01 |
Holoptelea integrifolia (Roxb.) Planch. | Ulmaceae | 36.51 | 23.02 | 12.85 | 1.62 |
Lannea coromandelica (Houtt.) Merr. | Anacardiaceae | 44.44 | 37.3 | 19.26 | 3.00 |
Maytenus emarginata (Wild.) Ding Hou | Celastraceae | 7.94 | 7.94 | 2.32 | 0.12 |
Mitragyna parvifolia (Roxb.) Korth. | Rubiaceae | 1.59 | 1.19 | 0.45 | 0.03 |
Moringa oleifera Lam. | Moringaceae | 1.59 | 0.4 | 0.34 | 0.01 |
Phoenix sylvestris (L.) Roxb. | Fabaceae | 1.59 | 0.79 | 0.44 | 0.04 |
Prosopis ceneraria (L.) Druce. | Fabaceae | 11.11 | 4.76 | 2.96 | 0.22 |
Prosopis juliflora (Swartz.) DC. | Fabaceae | 23.81 | 44.44 | 7.44 | 0.03 |
Salvadora persica L. | Salvadoraceae | 3.17 | 0.79 | 0.94 | 0.11 |
Sterculia urens Roxb. | Sterculiaceae | 20.63 | 13.49 | 7.96 | 1.15 |
Syzygium heyneanum (Duthie) Well. Ex Gamble | Myrtaceae | 1.59 | 0.4 | 0.45 | 0.05 |
Wrightia tinctoria (Roxb.) R. Br. | Apocynaceae | 30.16 | 57.94 | 10.78 | 0.47 |
Ziziphus mauritiana Lam. | Rhamnaceae | 1.59 | 0.4 | 0.32 | 0.004 |
Raisar (S4)
Species | Family | F (%) | Density tree/ha | IVI | Basal Area m2/ha |
Acacia leucophloea (Roxb.) Wild. | Fabaceae | 31.58 | 52.63 | 14.08 | 1 |
Acacia nilotica (L.) Del. | Fabaceae | 5.26 | 1.32 | 1.63 | 0.15 |
Acacia senegal Sensu O.B.Mill. | Fabaceae | 52.63 | 153.95 | 33.13 | 2.84 |
Ailanthus excelsa Roxb. | Simaroubaceae | 15.79 | 34.21 | 16.8 | 3.17 |
Anogeissus pendula (L.) Wild. | Combretacea | 36.84 | 198.68 | 26.25 | 0.61 |
Balanites aegyptiaca (L.) Delile. | Zygophyllaceae | 5.26 | 7.89 | 1.74 | 0.01 |
Bauhinia racemose Lam. | Fabaceae | 5.26 | 2.63 | 1.34 | 0.03 |
Boswellia serrata Roxb. ex Coleb | Burseraceae | 36.84 | 119.74 | 47.3 | 8.78 |
Butea monosperma (Lam.) Taub. | Fabaceae | 36.84 | 71.05 | 27.75 | 4.25 |
Cassia fistula L. | Fabaceae | 15.79 | 9.21 | 4.55 | 0.20 |
Dalbergia sissoo DC. | Fabaceae | 5.26 | 2.63 | 3.4 | 0.63 |
Dichrostachys cineraria Wight et Arn. | Fabaceae | 47.37 | 139.47 | 21.28 | 0.03 |
Diospyros melanoxylon Roxb. | Ebenaceae | 5.26 | 5.26 | 1.7 | 0.07 |
Flacourtia indica Roxb. | Salicaceae | 10.53 | 56.58 | 7.11 | 0.07 |
Holoptelea integrifolia (Roxb.) Planch. | Ulmaceae | 26.32 | 26.32 | 14.12 | 1.97 |
Lannea coromandelica (Houtt.) Merr. | Anacardiaceae | 31.58 | 18.42 | 12.82 | 1.49 |
Maytenus emarginata (Wild.) Ding Hou | Celastraceae | 10.53 | 3.95 | 2.67 | 0.08 |
Phoenix sylvestris (L.) Roxb. | Arecaceae | 5.26 | 3.95 | 1.55 | 0.05 |
Prosopis ceneraria (L.) Druce. | Fabaceae | 31.58 | 17.11 | 12.17 | 1.33 |
Prosopis juliflora (Swartz.) DC. | Fabaceae | 63.16 | 217.11 | 33.15 | 0.66 |
Sterculia urens Roxb. | Sterculiaceae | 26.32 | 25 | 14.04 | 1.99 |
Wrightia tinctoria (Roxb.) R. Br. | Apocynaceae | 5.26 | 3.95 | 1.41 | 0.01 |
Digota (S5)
Species | Family | F (%) | Density tree/ha | IVI | Basal Area m2/ha |
Acacia catechu (L.) Willd. Oliv. | Fabaceae | 28.57 | 21.43 | 6.31 | 0.16 |
Acacia leucophloea (Roxb.) Wild. | Fabaceae | 42.86 | 35.71 | 11.1 | 0.64 |
Acacia nilotica (L.) Del. | Fabaceae | 7.14 | 3.57 | 3.05 | 0.55 |
Acacia senegal Sensu O.B. Mill. | Fabaceae | 21.43 | 16.07 | 4.97 | 0.20 |
Albizia lebbeck (L.) Benth. | Fabaceae | 7.14 | 1.79 | 1.12 | 0.01 |
Anogeissus pendula (L.) Wild. | Combretacea | 85.71 | 387.50 | 68.54 | 5.96 |
Anogeissus latifolia (Roxb. Ex DC.) Wall. Ex Guill. & Perr. | Combretacea | 14.29 | 8.93 | 3.74 | 0.32 |
Balanites aegyptiaca (L.) Delile. | Zygophyllaceae | 14.29 | 17.86 | 3.94 | 0.11 |
Bauhinia racemose Lam. | Fabaceae | 14.29 | 7.14 | 2.6 | 0.02 |
Boswellia serrata Roxb. ex Coleb | Burseraceae | 42.86 | 44.64 | 24.28 | 4.46 |
Butea monosperma (Lam.) Taub. | Fabaceae | 28.57 | 80.36 | 28.68 | 5.30 |
Cassia fistula L. | Fabaceae | 14.29 | 5.36 | 2.76 | 0.13 |
Clerodendrum phlomidis L. f. | Lamiaceae | 7.14 | 8.93 | 2.32 | 0.16 |
Dichrostachys cinerea Wight et Arn. | Fabaceae | 42.86 | 16.07 | 7.26 | 0.05 |
Diospyros cordifolia Roxb. | Ebenaceae | 14.29 | 14.29 | 3.47 | 0.07 |
Diospyros melanoxylon Roxb. | Ebenaceae | 14.29 | 14.29 | 4.39 | 0.36 |
Diospyros montana Roxb. | Ebenaceae | 7.14 | 1.79 | 1.5 | 0.13 |
Ehretia levis Roxb. | Boraginaceae | 14.29 | 3.57 | 2.29 | 0.04 |
Euphorbia neriifolia L. | Euphorbiaceae | 7.14 | 5.36 | 1.62 | 0.05 |
Ficus racemosa L. | Moraceae | 14.29 | 3.57 | 13.73 | 3.59 |
Flacourtia indica (Burm.f.) Merr. | Salicaceae | 7.14 | 1.79 | 1.16 | 0.02 |
Grewia asiatica L. | Malvaceae | 14.29 | 12.50 | 3.12 | 0.01 |
Helictares ixora L. | Malvaceae | 7.14 | 3.57 | 1.29 | 0.01 |
Holoptelea integrifolia (Roxb.) Planch. | Ulmaceae | 21.43 | 12.50 | 6.06 | 0.64 |
Hymenodictyon orixense (Roxb.) Mabb. | Rubiaceae | 7.14 | 3.57 | 1.33 | 0.02 |
Lannea coromandelica (Houtt.) Merr. | Anacardiaceae | 57.14 | 23.21 | 11.54 | 0.59 |
Mallotus philippensis (Lam.) Mull. Arg. | Euphorbiaceae | 7.14 | 12.50 | 3.31 | 0.36 |
Maytenus emarginata (Wild.) Ding Hou | Celastraceae | 21.43 | 5.36 | 7.01 | 1.16 |
Miliusa tomentosa (Roxb.) J. Sinclair | Annonaceae | 14.29 | 12.50 | 4.16 | 0.34 |
Mitragyna parvifolia (Roxb.) Korth. | Rubiaceae | 28.57 | 16.07 | 15.31 | 3.13 |
Moringa concanensis Nimmo | Moringaceae | 7.14 | 1.79 | 1.5 | 0.13 |
Moringa oleifera Lam. | Moringaceae | 14.29 | 16.07 | 8.94 | 1.25 |
Naringi crenulata (Roxb.) Nicolson | Rutaceae | 14.29 | 28.57 | 5.23 | 0.18 |
Phoenix sylvestris (L.) Roxb. | Arecaceae | 7.14 | 3.57 | 1.96 | 0.21 |
Prosopis ceneraria (L.) Druce. | Fabaceae | 7.14 | 1.79 | 1.21 | 0.04 |
Prosopis juliflora (Swartz.) DC. | Fabaceae | 42.86 | 57.14 | 11.38 | 0.07 |
Salvadora oleoides Decne. | Salvadoraceae | 7.14 | 1.79 | 1.11 | 0.004 |
Sterculia urens Roxb. | Sterculiaceae | 7.14 | 3.57 | 1.9 | 0.20 |
Wrightia tinctoria (Roxb.) R. Br. | Apocynaceae | 42.86 | 96.43 | 16.36 | 0.41 |
Ziziphus mauritiana Lam. | Rhamnaceae | 7.14 | 1.79 | 1.16 | 0.02 |
Values F = Frequency; IVI = Importance Value Index


