Measuring the Ecosystem Services Value of Kalimpong District (West Bengal), India with Respect to Land Use Land Cover Dynamicity
Paban Ghosh1
*
 and Kabita Lepcha2
1
Department of Geography,
Gour Mahavidyalaya,
Mangalbari, Malda,
West Bengal
India
2
Department of Geography,
University of Gour Banga,
English bazaar, Malda,
West Bengal
India
http://dx.doi.org/10.12944/CWE.19.2.15
Copy the following to cite this article:
Ghosh P, Lepcha K, Measuring the Ecosystem Services Value of Kalimpong District (West Bengal), India with Respect to Land Use Land Cover Dynamicity. Curr World Environ 2024;19(2). DOI:http://dx.doi.org/10.12944/CWE.19.2.15
Copy the following to cite this URL:
Ghosh P, Lepcha K, Measuring the Ecosystem Services Value of Kalimpong District (West Bengal), India with Respect to Land Use Land Cover Dynamicity. Curr World Environ 2024;19(2).
Download article (pdf) Citation Manager Publish History

Introduction
Ecosystem is the locally obvious place of the surface of the earth on which materials and energy exchange among organisms and it physical environment selected place6. The ecosystems give a direct and indirect material, such as food production, fresh water and services like carbon sequestration, climate regulation, aesthetic benefits and water purification, 20. Ecosystem services are defined as the advantages which human gain from the procedure of ecology that profit for people wellbeing19, 10. Each and every ecosystem gives a unique and different category of services such as woodland ecosystem provides dissimilar services in compare to grassland or desert ecosystem8. Ecosystem services trust on the transformation spatial processes which are interacting and acting continuously but considering relationship and spatial processes are limited1. LULC dynamics are the prime factors for change of the surface of the earth28. In the recent time, LULC are transformed by population growth, urban expansion and economic development in all over the world. The dynamics of LULC has a main influence on the ecosystems of the world. Natural landscapes such as forest cover areas are converted into other LULC categories such as build up area and cropland etc.7, 16. Natural ecosystem converted into plantations, cropland and build up areas that increase fiber, timber, food production and housing, therefore, caused a decrease in other ecosystem services11, 21. About, 60% ecosystem service of the earth was expected to be decreased in past five decades20, by increase of the human population4.
The changes of ecosystem services have been taken areas due to human activities like LULC dynamics 2, 25, over-exploitation13, wildfires29, urbanization18, and natural hazards26. The LULC transformation patterns are more unique and complicated in India in compare to another countries11. The productive agriculture land, water bodies, forest converted into settlement areas that cannot able to give ecosystem services in India22. A group of scientists worked on the topic and reported same thing9, 14,15,23,24. Recently, the impact of LULC dynamics on ecosystem services which have befit the more demotic and pertinent topic for researches3, 5, 25, 12, 27, 30, 31. The study area gives maximum no of ecosystem services of various LULC pattern and no work has been done in the study place yet on the topic. So, keeping its in mind, the main aims of this paper are (i) Assess the spatio-temporal transformation of LULC during the period of 1991 to 2021, (ii) Assess the changes of ecosystem service value (ESV) with LULC dynamics and (iii) Finally evaluate the elasticity of ecosystem services value (ESV) with respect to LULC change.
Location and description of study area
Kalimpong district is situated in eastern Himalaya. It’s extending from 88022’49’’E to 88052’35’’E and 26052’27’’N to 27011’37’’N (Fig. 1). Elevation of the district ranges from 64 to 3187 metres and slope ranges from 00 to 78.100. The district is characterized by five categories of soil such as Coarse loamy, Fine loamy - Coarse loamy, Gravelly loamy, Gravelly loamy - Coarse loamy and Gravelly loamy - Loamy skeletol. The district consists with four geomorphological units such as Fluvial origin and piedmont alluvial plain, Fluvial origin and active flood plain, Structural origin and highly dissected hills and valleys, Structural origin and moderately dissected hills and valleys as per Bhuban mapper. Major River of this district is Teesta, Dharla, Jaldhaka, Rangpo and Relli river. Total area of this district is 1053.60 km2 (105360 hectares) which incorporates 3 blocks such as Kalimpong-1, Kalimpong-2 and Gorubathan. Total population of the district was 225,220 in 2001 and 251,642 in 2011 (Census of India).
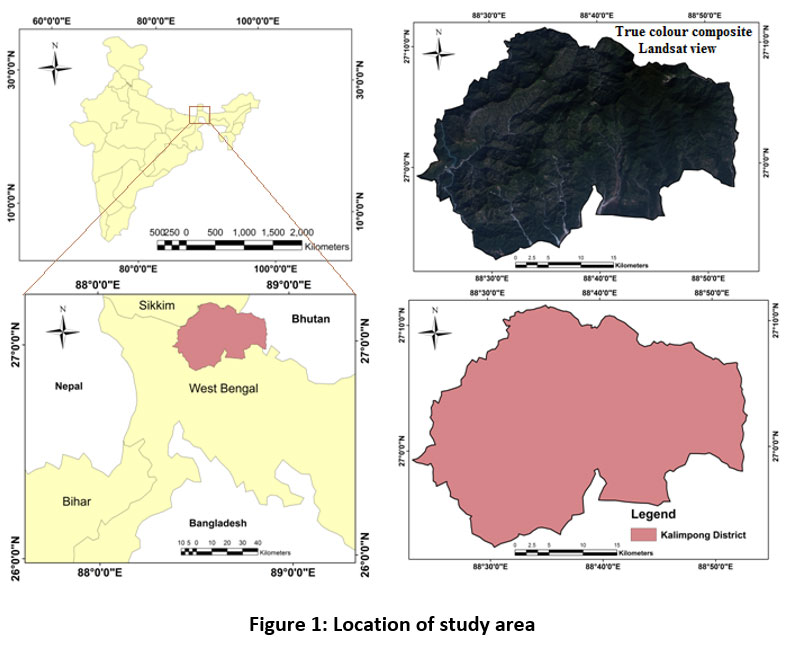 | Figure 1: Location of study area
|
Materials and Methods
Descriptions and processing of satellite images
Landsat-5 TM satellite image for 1991 and Landsat-8 OLI for 2021 are used for long term LULC classification and mapping of Kalimpong district. Table 1 shows the details description of satellite images. The techniques involve (a) re-projecting all satellite data, (b) atmospheric and radiometric correction of satellite image (based on atmospheric and solar angle correction), (c) Clipping the satellite images based on purposive study area, (d) supervised classification of clipping satellite images by image classification tools of ArcGIS 10.3 and (e) lastly apply union tool for analysis of the LULC changes.
Table 1: The details of satellite images
Satellite data | Sensors | Path/Row | date | Spatial resolution |
Landsat-5 | TM | 139/041 | 24/11/1991 | 30 m |
Landsat-8 | OLI/TIRS | 139/041 | 10/11/2021 | 30 m |
Method for LULC classification and validation
In this paper, a supervised classification technique is used in ArcGIS 10.3 software. In this, an image classified applying polygons (training samples/signature) which marked individual sample areas of various LULC groups to be classified based on supervised classification (maximum likelihood) in ArcGIS 10.3.1. LULC map are constructed based on satellite image landsat-5 for 1991 and landsat-8 for 2021 using ArcGIS 10.3.1 software. Kappa coefficient is utilised for the validation of LULC map of the district. The equation 1 is used for the measure of Kappa statistic K.
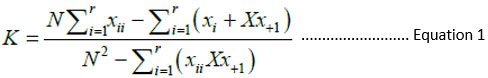
Where; r means no of columns and no of rows in matrix, N means sum no of observations, Xii means observation of column i and observation of row i, X+i means sum of column i in marginal and Xi+ means sum of row i in marginally
Calculation of ecosystem service value
In this paper, benefit transfer method is applied for measure the values of ecosystem service in different LULC and their transformation8. Ecosystem service values in different LULC has been calculated based on tantamount value of coefficient (Table 6) and area using the following equations 2 and 3 which is evolved from the framework that propounded by Costanza and his group (1997).
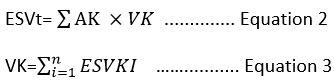
Where, ESVt indicates sum ESV, VK indicates coefficient of K, AK indicates the area of K, and ESVKI indicates I category of ESV for K.
Changes of ecosystem service value (ESV)
The dynamics of ESV are measured by the equation 4 that derived from Kindu et al (2016).

Where, ESV recent year indicates the end period of the study area and ESV previous year indicates beginning period of the study area.
Contribution of changes in ESV (CCk) has been measured by the equation 5.

Where, ESV recent year indicates the end period of the study area, ESV previous year indicates beginning period of the study area and total ESV previous year indicates Total ESV in beginning period of the study area.
Analysis of Sensitivity Index (SI)
In this study, sensitivity index is calculated for evaluate the credibility of ecosystem service value result due to the biomes that are used as assumes for the LULC of the study area which are not matched with the biomes that propounded by Costanza and his group (1997, 2014). A simple method has been used to estimate the coefficient of sensitivity as shown in equation 6.
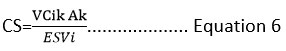
Where, ESVi indicates the total ESV in i year, VCik indicates sum value of ecosystem services given by k at i year and Ak indicates the area of k at i year. In case, the value of sensitivity index is >1 that indicates elastic and <1 that indicates inelastic and resultant ESV is more reliable.
Results and Discussion
Changes in land use land cover classes and validation
LULC map are prepared by supervised classification techniques within ArcGIS 10.3.1 software environment. LULC of the district is categorised into seven types such as water body, build up area, agriculture land, agriculture plantation, agriculture fallow land, social forestry and forest during the period of 1991 to 2021 (fig. 2). Spatial ordination and categories of seven LULC of the district are extracted from Landsat images such as Landsat-5 for 1991 and Landsat-8 OLI for 2021 and it details are given in table 1 and 2.
The result acquired from classified image of Landsat-5 TM (Fig. 2.A) shows that the major part of the district in 1991 was covered by forest accounted for 54233.90 ha (51.47 %) while social forestry accounted for 12620.10 ha (11.97 %) followed by agriculture fallow land 11376.20 ha (10.79 %), agriculture plantation 10344.20 (9.81 %), agriculture land 8953.93 (8.49 %), build up area 4380.98 (4.15 %) and water body 3450.69 (3.27 %) respectively (Table 2).
Finally, the result of LULC analysis for 2021 from Landsat-8 OLI (Fig. 2.B) shows that large part of the land in the district was covered by forest which accounted for 38926.52 ha (36.94 %) followed by agriculture land 17707.54 ha (16.80 %), agriculture fallow land 17247.91 ha (16.37 %), social forestry 13647.64 ha (12.95 %), 7893.48 ha (7.49 %), build up area 5375.55 ha (5.10 %) and 4561.36 ha (4.32 %) respectively. From the result of long term analysis of LULC in the study area, it is clear that forest and agriculture plantation have continuously decreased and build up area, agriculture land, agriculture fallow land and social forestry have gradually increased in the period of 1991 to 2021(Table 2).
The results of Kappa Coefficient and overall accuracy for selected years of 1991 and 2021 are shown in table 3 and 4. The output results in the classified images of the district are above 80 percent which indicated to highly acceptable and these are useful for present study. Fig. 3 represents LULC transformation from 1991 to 2021.
Table 2: presents the various LULC types with percentage
Year LULC | 1991 | 2021 | ||
Area | Area | |||
(Ha) | (%) | (Ha) | (%) | |
Water body | 3450.69 | 3.27 | 4561.36 | 4.32 |
Build up area | 4380.98 | 4.15 | 5375.55 | 5.10 |
Agriculture land | 8953.93 | 8.49 | 17707.54 | 16.80 |
Agriculture plantation | 10344.20 | 9.81 | 7893.48 | 7.49 |
Agriculture fallow land | 11376.20 | 10.79 | 17247.91 | 16.37 |
Social forestry | 12620.10 | 11.97 | 13647.64 | 12.95 |
Forest | 54233.90 | 51.47 | 38926.52 | 36.94 |
Total | 105360 | 100 | 105360 | 100 |
Table 3: Accuracy assessments in 1991
LU/LC classes | WB | B | AL | AP | AFL | SF | F | Sum (User) | Commission error (%) | User’s accuracy (%) |
WB | 44 | 1 | 0 | 1 | 2 | 1 | 1 | 50 | 10 | 90 |
B | 0 | 46 | 1 | 1 | 0 | 2 | 0 | 50 | 8 | 92 |
AL | 0 | 0 | 48 | 0 | 1 | 1 | 0 | 50 | 2 | 98 |
AP | 1 | 0 | 1 | 46 | 0 | 1 | 1 | 50 | 8 | 92 |
AFL | 0 | 0 | 1 | 0 | 47 | 1 | 1 | 50 | 6 | 94 |
SF | 0 | 0 | 1 | 0 | 1 | 48 | 1 | 50 | 4 | 96 |
F | 0 | 1 | 0 | 1 | 0 | 1 | 47 | 50 | 8 | 92 |
Total (Producer) | 45 | 48 | 51 | 49 | 51 | 55 | 51 | 350 | ||
Omission error (%) | 2.22 | 4.16 | 5.88 | 6.12 | 7.84 | 12.72 | 7.84 | Overall accuracy (%) = 93.14 Kappa coefficient (%) = 92.00 | ||
Producer accuracy (%) | 97.77 | 95.83 | 94..11 | 93.87 | 92.15 | 87.27 | 92.15 | |||
Note: WB = Water body, B = Build up area, AL = Agriculture land (Single crop), AP = Agriculture plantation, AFL = Agriculture fallow land, SF = Social forestry and F = Forest
Table 4: Accuracy assessments in 2021
LU/LC classes | WB | B | AL | AP | AFL | SF | F | Sum (User) | Commission error (%) | User’s accuracy (%) |
WB | 48 | 0 | 0 | 0 | 0 | 1 | 1 | 50 | 10 | 96 |
B | 0 | 47 | 1 | 0 | 1 | 1 | 0 | 50 | 8 | 94 |
AL | 0 | 1 | 48 | 1 | 0 | 0 | 0 | 50 | 2 | 96 |
AP | 0 | 0 | 1 | 47 | 1 | 1 | 1 | 50 | 8 | 94 |
AFL | 0 | 0 | 0 | 1 | 47 | 1 | 1 | 50 | 6 | 94 |
SF | 0 | 0 | 0 | 0 | 1 | 48 | 1 | 50 | 4 | 96 |
F | 1 | 0 | 0 | 1 | 1 | 1 | 47 | 50 | 8 | 94 |
Total (Producer) | 48 | 48 | 49 | 50 | 51 | 53 | 51 | 350 | ||
Omission error (%) | 00 | 2.08 | 2.04 | 2.04 | 7.84 | 9.43 | 7.84 | Overall accuracy (%) = 94.85 Kappa coefficient (%) = 94 | ||
Producer accuracy (%) | 100 | 97.91 | 97.95 | 97.91 | 92.15 | 90.56 | 92.15 | |||
Note: WB = Water body, B = Build up area, AL = Agriculture land (Single crop), AP = Agriculture plantation, AFL = Agriculture fallow land, SF = Social forestry and F = Forest
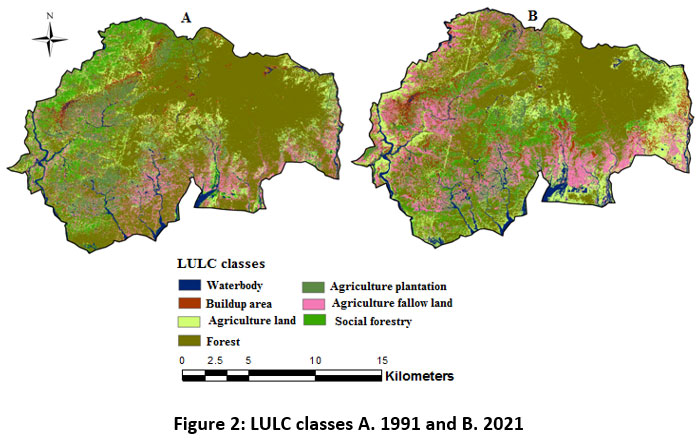 | Figure 2: LULC classes A. 1991 and B. 2021
|
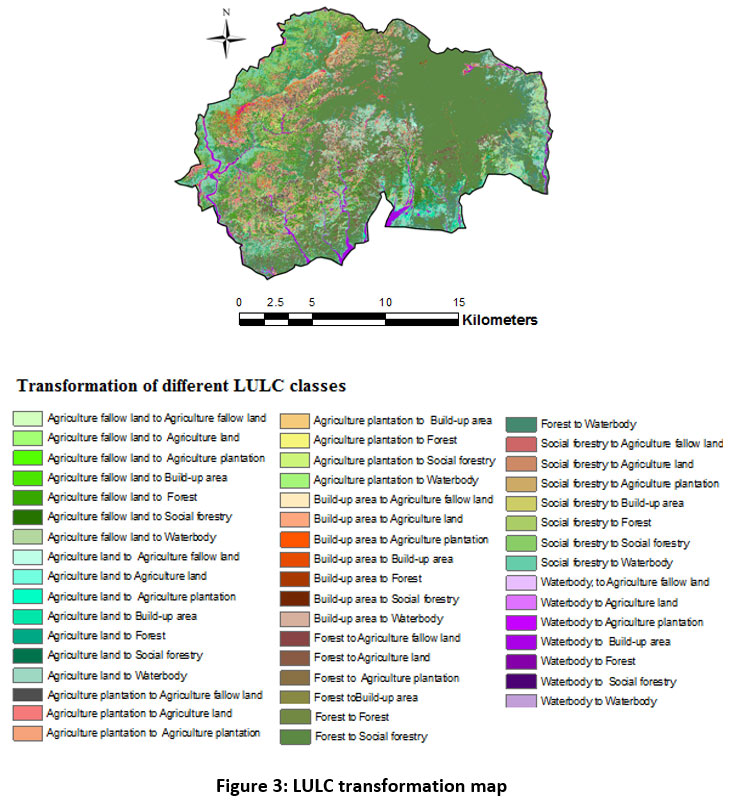 | Figure 3: LULC transformation map
|
Gain and loss of LULC classes
The result of overall analysis, it is clear that the area of forest and agriculture plantation remarkably decreased with the rate of 27.08 % and 2.32 % respectively in the period of 1991 to 2021 (Table 5 and fig. 4).
Table 5: Overview of area changing rate in the period of 1991 to 2021
Year | 1991 - 2021 | |
Area changing rate (%) | ||
(IR) | (DR) | |
Water body | 0.70 | |
Build up area | 2.17 | |
Agriculture land | 8.95 | |
Agriculture plantation | -2.23 | |
Agriculture fallow land | 7.13 | |
Social forestry | 8.65 | |
Forest | -27.08 | |
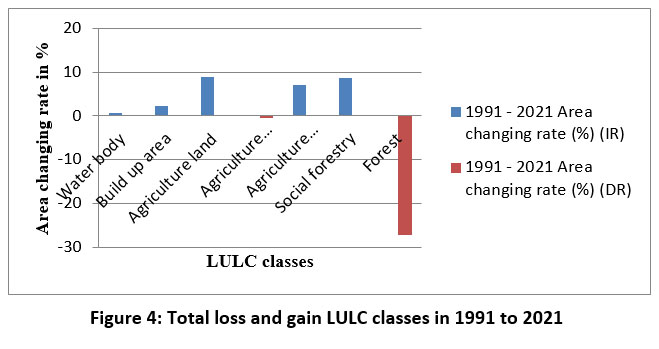 | Figure 4: Total loss and gain LULC classes in 1991 to 2021
|
Measure of ecosystem service value (ESV)
The total ecosystem services value of variant LULC is measured by Costanza and his group 1997 and 2014 for the years in 1991 and 2021 (Fig. 5). In 1991, total ecosystem services value was 95.86 US$ million/yr and 433.82 US$ million/yr as per Costanza and his group 1997 and 2014 in which the amount of contribution of forest was maximum 52.55 US$ million/yr and 206.08 US$ million/yr as per global coefficient value 1997 and 2014. The contribution of water body and social forestry were 29.32 US$ million/yr and 12.22 US$ million/yr as per Costanza and his group 1997 while 43.17 US$ million/yr and 47.95 US$ million/yr were measured as per Costanza and his group 2014 (Table 7).
In 2021, total value of ecosystem services was 92.03 US$ million/yr and 435.19 US$ million/yr as per Costanza and his group 1997 and Costanza and his group 2014 in which the amount of contribution of water body was maximum 38.76 US$ million/yr and the contribution of forest was highest 147.92 US$ million/yr as per global coefficient value 1997 and 2014. The amount of contribution of forest and social forestry were 37.71 US$ million/yr and 13.22 US$ million/yr as per Costanza and his group 1997 while the contribution of agriculture land and social forestry were 98.59 US$ million/yr and 51.86 US$ million/yr were estimated by Costanza and his group 2014 (Table 8). The amount of contribution of ecosystem services of water body is maximum increased in the period of 1991 to 2021 as per Costanza and his group 1997 while the amount of contribution of ecosystem services of agriculture land is maximum increased in the period of 1991 to 2021 as per Costanza and his group 2014 (Table 7 and 8).
Table 6: LULC and ESV based on Costanza and his group 1997 and 2014
LULC categories | tantamount biome | coefficient value (USD/ha/yr) | |
1997 | 2014 | ||
Water body | Wetlands and rivers | 8498 | 12,512 |
Build up area | Urban | - | 6661 |
Agriculture land | Cropland | 92 | 5567 |
Agriculture plantation | Cropland | 92 | 5567 |
Agriculture fallow land | Barren land | - | - |
Social forestry | Forest | 969 | 3800 |
Forest | Forest | 969 | 3800 |
Table 7: Total ecosystem services values in 1991 as per Costanza and his group 1997 and 2014
LULC types | Total ecosystem services value in US$ million/yr | |
Costanza and his group | ||
1997 | 2014 | |
Water body | 29.32 | 43.17 |
Build up area | - | 29.18 |
Agriculture land | 0.82 | 49.85 |
Agriculture plantation | 0.95 | 57.59 |
Agriculture fallow land | - | - |
Social forestry | 12.22 | 47.95 |
Forest | 52.55 | 206.08 |
Total | 95.86 | 433.82 |
Table 8: Total ecosystem services values in 2021 as per Costanza and his group 1997 and 2014
LULC types | Total ecosystem services value in US$ million/yr | |
Costanza and his group | ||
1997 | 2014 | |
Water body | 38.76 | 57.07 |
Build up area | - | 35.80 |
Agriculture land | 1.62 | 98.59 |
Agriculture plantation | 0.72 | 43.95 |
Agriculture fallow land | - | - |
Social forestry | 13.22 | 51.86 |
Forest | 37.71 | 147.92 |
Total | 92.03 | 435.19 |
Changes of ecosystem service value (ESV)
In this study, changes of net ecosystem service values have been estimated depend on two coefficient value of 1997 and 2014. Positive change rate was found in water body, agriculture land and social forestry as per Costanza and his group 1997 and water body, build up area, agriculture land and social forestry as per Costanza and his group 2014. Same condition was found in contribution of changes depend on Costanza and his group 1997 and 2014 (Table 9).
Table 9: Dynamics of ESV and contribution of dynamics of ESV in 1991 to 2021
LULC types | 1991 | 2021 | ||
Changes in US$ million/yr | CCK in % | Changes in US$ million/yr | CCK in % | |
Water body | 9.44 | 9.84 | 13.90 | 3.20 |
Build up area | - | - | 6.62 | 1.52 |
Agriculture land | 0.80 | 0.83 | 48.74 | 11.23 |
Agriculture plantation | -0.23 | -0.23 | -13.64 | -3.14 |
Agriculture fallow land | - | - | - | - |
Social forestry | 1 | 1.03 | 3.91 | 0.89 |
Forest | -14.84 | -15.47 | -58.16 | -13.40 |
Analysis of sensitivity index (CS)
Table no 1.10 represents coefficient of sensitivity of variant LULC. The coefficient of sensitivity of different LULC are less than 1 which indicated to the calculated ecosystem service values are low sensitive (inelastic) with respect to coefficient of valuation (CV). The lowest and highest coefficient of sensitivity value is recorded for 0.00 in agriculture land and 0.54 in forest cover area in 1991 as per Costanza and his group 1997 and 0.06 in build up area and 0.47 in forest cover area when CV for all different LULC types are adjusted by 50% (Table 10).
Table 10: ESVs after adjustment coefficient of valuation (CV) and coefficient of sensitivity (CS) in Kalimpong district
LULC types | 1991 | 2021 | ||||||
Costanza and his | Costanza and | Costanza and | Costanza and | |||||
% | CS | % | CS | % | CS | % | CS | |
Water body± 50 % | 15.29 | 0.30 | 4.97 | 0.09 | 21.05 | 0.42 | 6.55 | 0.13 |
Build up area± 50 % | - | - | 3.36 | 0.06 | - | - | 4.11 | 0.08 |
Agriculture land± 50 % | 0.42 | 0.00 | 5.74 | 0.11 | 0.88 | 0.01 | 11.32 | 0.22 |
Agriculture plantation± 50 % | 0.49 | 0.00 | 6.63 | 0.13 | 0.39 | 0.00 | 5.04 | 0.10 |
Agriculture fallow land± 50 % | - | - | - | - | - | - | ||
Social forestry± 50 % | 6.37 | 0.12 | 5.56 | 0.11 | 7.18 | 0.14 | 5.95 | 0.11 |
Forest± 50 % | 27.40 | 0.54 | 27.75 | 0.47 | 20.48 | 0.40 | 16.99 | 0.33 |
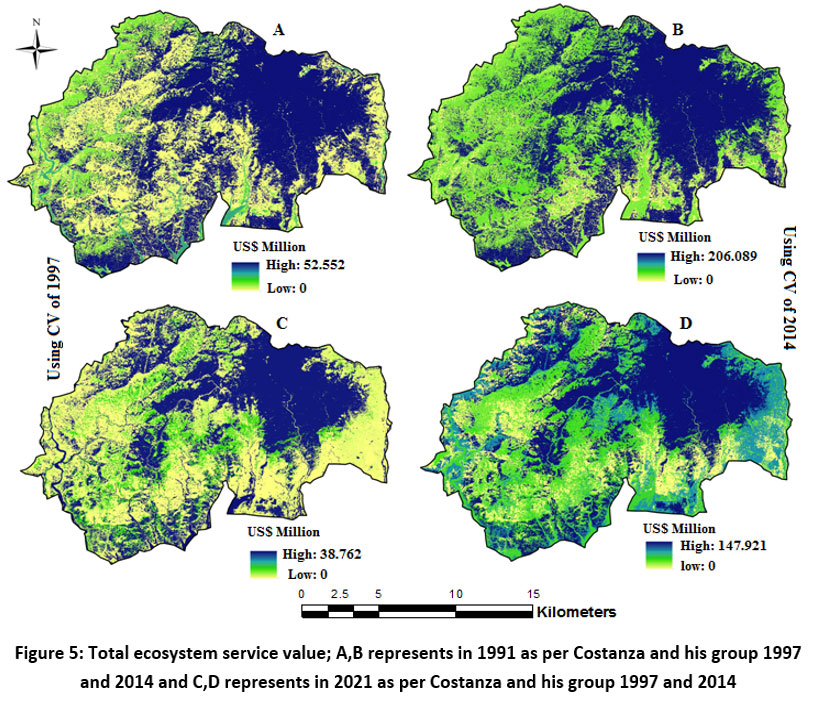 | Figure 5: Total ecosystem service value; A,B represents in 1991 as per Costanza and his group 1997 and 2014 and C,D represents in 2021 as per Costanza and his group 1997 and 2014
|
Conclusion
In this work, the dynamic of ecosystem service values are analyzed by the LULC dynamicity. The satellite images are applied to categories the LULC map of the district and estimated ecosystem services value using the coefficient value of Costanza and his group 1997 and 2014. The study shows agriculture plantation and forest cover area are continuously decreased in the study period. Ecosystem services of agriculture plantation and forest cover area are decreased as per Costanza and his group 1997 and 2014. This paper can be contribute to the help of the policy makers and planners to take decision for proper planning implementation for further improvement and development of environment and ecology of the district in future. It can further contribute in advancement the land use pattern in the district. At the same time, it is found that only minimum number of studies has been done in West Bengal, India at local and regional level. So, these kinds of works are need in India at the local and regional levels.
Acknowledgement
We are thankful to the USGS for satellite image, peoples who helped by giving valuable suggestions during our work.
Funding Sources
The author(s) received no financial support for the research, authorship, and/or publication of this article.
Conflict of Interest
The authors declare no conflict of interest."
Data Availability Statement
The manuscript incorporates all datasets produced or examined throughout this research study are available on request from the corresponding author.
Ethics Approval Statement
This research did not involve human participants, animal subjects, or any material that requires ethical approval.
Authors’ Contribution
Paban Ghosh: Conceptualization, Methodology, Software, Formal analysis, Visualization, Data curation, Writing – original draft, preparation, Investigation, Writing – review & editing.
Dr. Kabita Lepcha: Conceptualization, Methodology, Writing – original draft, preparation, Investigation, Writing – review & editing, Supervision.
References
- Anderson, E., McPhearson, T., Kremer, P., Gomez-Baggethun, E., Haase, D., Tuvendal, M., Wurster, D. Scale and context dependence of ecosystem service providing units. Ecosyst. Serv. 2015, 12, 157–164.
CrossRef - Akber, M.A., Khan, W.R., Islam, M.A., Rahman, M.M., Rahman, M.R. Impact of land use change on ecosystem services of southwest coastal Bangladesh. J. Land Use Sci. 2018, 13 (3), 238–250
CrossRef - Bai, Y., Ochuodho, T.O., yang, J. Impact of land use and climate change on waterrelated ecosystem services in Kentucky, USA. Ecol. Ind. 2019, 102, 51–64.
CrossRef - Brauman, K.A., Daily, G.C., Duarte, T.K.e., Mooney, H.A. The nature and value of ecosystem services: an overview highlighting hydrologic services. Annual Review of Environment and Resources. 2007, 32 (1), 67–98.
CrossRef - Bryan, B.A., Ye, Y., Zhang, J., Connor, J.D. Land-use change impacts on ecosystem services value: Incorporating the scarcity effects of supply and demand dynamics. Ecosyst. Serv. 2018, 32, 144–157.
CrossRef - Chapin, F.S., Matson, P.A., Vitousek, P.M. Principles of Terrestrial Ecosystem Ecology. Springer, New York. 2012
CrossRef - Chen, J., et al. Land use changes and their effects on the value of ecosystem services in the small Sanjiang plain in China. The Scientific World Journal 1–7, 2014.
CrossRef - Costanza, R., d’Arge, R., De Groot, R., Farber, S., Grasso, M., Hannon, B., Limburg, K., Naeem, S., O’neill, R.V., Paruelo, J. The value of the world’s ecosystem services and natural capital. Nature. 1997, 387, 253–260.
CrossRef - Costanza, R., de Groot, R., Sutton, P., Van der Ploeg, S., et al. Changes in the global value of ecosystem services. Global Environ. Change. 2014, 26, 152–158.
CrossRef - de Groot, R.S., Wilson, M.A., Boumans, R.M.J. A typology for the classification, description and valuation of ecosystem functions, goods and services. Ecol. Econ. 2002, 41, 393–408.
CrossRef - Dutta, D., Rahman, A., Paul, S.K., Kundu, A. Changing pattern of urban landscape and its effect on land surface temperature in and around Delhi. Environ. Monitor. Assessm. 2019, 191, 551.
CrossRef - Iverson, L., Echeverria, C., Nahuelhual, L., Luque, S. Ecosystem services in changing landscapes: an introduction. Landscape Ecol. 2014, 29, 181–186.
CrossRef - Kronenberg, J. Environmental Impacts of the Use of Ecosystem Services: Case Study of Birdwatching. Environ. Manage. 2014, 54 (3), 617–630.
CrossRef - Kindu, M., Schneider, T., Teketay, D., Knoke, T. Changes of ecosystem service values in response to land use/land cover dynamics in Munessa-Shashemene landscape of the Ethiopian highlands. Sci. Total Environ. 2016, 547, 137–147.
CrossRef - Kubiszewski, I., Costanza, R., Anderson, S., Sutton, P. The future value of ecosystem services: global scenarios and national implications. Ecosyst. Serv. 2017, 26, 289–301.
CrossRef - Lambin, E.F., Meyfroidt, P. Global land use change, economic globalization, and the looming land scarcity. Proceedings of the National Academy of Sciences. 2011, 108 (9), 3465–3472.
CrossRef - Lawler, J.J., et al. Projected land-use change impacts on ecosystem services in the United States. Proceedings of the National Academy of Sciences. 2014, 111 (20), 7492–7497.
CrossRef - Liu, W., Zhan, J., Zhao, F., Yan, H., Zhang, F., Wei, X. Impacts of urbanizationinduced land-use changes on ecosystem services: a case study of the Pearl River Delta Metropolitan Region, China. Ecol. Ind. 2019, 98, 228–238.
CrossRef - Millennium Ecosystem Assessment (MEA). Ecosystems and Human Well-being: Current State and Trends. Island Press, Washington, DC. 2003
- Millennium Ecosystem Assessment (MEA). Ecosystems and Human Well-being: Synthesis. Island Press, Washington, DC. 2005
- Park, S., Park, S., Park, Y.B. An architecture framework for orchestrating context-aware IT ecosystems: a case study for quantitative evaluation. Sensors, 2003, 18 (2).
CrossRef - Rahman, A., Aggarwal, S.P., Netzband, M., Fazal, S. Monitoring urban sprawl using remote sensing and GIS Techniques of a Fast Growing Urban Centre, India. IEEE J. Sel. Top. Appl. Earth Obs. Remote Sens. 2011, 4 (1), 56–64.
CrossRef - Sharma, R., Rimal, B., Baral, H., Nehren, U., Paudyal, K., Sharma, S., Rijal, S., Ranpal, S., Acharya, R.P., Alenazy, A.A., Kandel, P. Impact of land cover change on ecosystem services in a tropical forested landscape. Resources, 2019b, 8, 18.
CrossRef - Sharma, R., Rimal, B., Baral, H., Nehren, U., Paudyal, K., Sharma, S., Rijal, S., Ranpal, S., Acharya, R.P., Alenazy, A.A.,. Impact of land cover change on ecosystem services in a tropical forested landscape. Resources, 2019a, 8, 18.
CrossRef - Song, W., Deng, X. Land-use/land-cover change and ecosystem service provision in China. Sci. Total Environ. 2017, 576, 705–719.
CrossRef - Talbot, C.J., Bennett, E.M., Cassell, K., Hanes, D.M., eta l. The impact of flooding on aquatic ecosystem services. Biogeochemistry, 2018, 141 (3), 439–461.
CrossRef - Turner II, B.L., Skole, D., Sanderson, S., Fischer, G., Fresco, L. and Leemans, R. Land-use and land cover change science/research plan. International Geosphere- Biosphere Program, IGBP Report No. 35/HDP Report No.7/1995, Stockholm. 1995
- Verburg, P.H., Neumann, K., Nol, L.,. Challenges in using land use and land cover data for global change studies. Global Change Biology, 2011, 17 (2), 974–989.
CrossRef - Vukomanovic, J., Steelman, T. A Systematic review of relationships between mountain wildfire and ecosystem services. Landscape Ecol.2019, 34 (5), 1179–1194.
CrossRef - Subedi, Y.R., Kristiansen, P., Cacho, O., Drivers and consequences of agricultural land abandonment and its reutilisation pathways: a systematic review. Environmental Development. 2022 42, 100681. https://doi.org/10.1016/j.
CrossRef - Schirpke, U., Tscholl, S., Tasser, E., 2020. Spatio-temporal changes in ecosystem service values: effects of land-use changes from past to future (1860–2100). J. Environ. Manag. 2020, 272, 111068 https://doi.org/10.1016/j.jenvman.2020.111068.
CrossRef


