Land Use Land Cover Dynamics around a Western Himalayan Wetland using Geospatial Techniques
Moonisa Aslam Dervash1
*
 , Bashir Ahmad Ganai2
and Abrar Yousuf3
, Bashir Ahmad Ganai2
and Abrar Yousuf3
1
Indian Council of Social Science Research (ICSSR, Ministry of Education, GoI),
Aruna Asif Ali Marg,
Delhi
India
2
Centre of Research for Development,
University of Kashmir,
Srinagar,
Jammu and Kashmir
India
3
Punjab Agricultural University-Regional Research Station,
Ballowal Saunkhri, Balachaur,
SBS Nagar,
Punjab
India
Copy the following to cite this article:
Dervash M. A, Ganai B. A, Yousuf A. Land Use Land Cover Dynamics around a Western Himalayan Wetland using Geospatial Techniques. Curr World Environ 2024;19(2).
Copy the following to cite this URL:
Dervash M. A, Ganai B. A, Yousuf A. Land Use Land Cover Dynamics around a Western Himalayan Wetland using Geospatial Techniques. Curr World Environ 2024;19(2).
Citation Manager Publish History

Introduction
Wetlands are ecosystems characterized by their unique hydrology, where the presence of water, either permanently or seasonally, plays a fundamental role in shaping their physical and biological attributes. As per the definition, “Wetlands are transitional areas between land and water environments, where the water table is typically at or near the surface, or the land is covered by shallow water.”1. Wetlands are included in the most prolific and diversified ecosystems of Earth and play a dynamic role in regulating hydrological processes within watersheds2. Indeed, wetlands offer a consortium of ecosystem goods and services that are important for both human welfare and the environmental health 3,4. For example, carbon sequestration, biological conservation, water filtration, regulation of hydrological cycles (regional & global), maintaining the equilibria between various food chains in a food web, nutrient removal through bioremediation, groundwater recharge, irrigation water, flood control, fisheries, forest products, and recreation are some of the productive services which are extended by the wetlands. Additionally, wetlands serve as a natural filter for pollutants in numerous agricultural and urban settings5. In such scheme, wetlands indeed offer numerous economic benefits, particularly in mitigating both point and non-point pollution at a relatively low cost compared to traditional infrastructure solutions6. Wetlands regulate water flows and can serve as highly effective flood control mechanisms7. Wetlands possess unique consortium of capabilities in acting as a natural barrier, floodplain expansion, soaking surplus water during the peak flows and then the gradual release into other aquatic bodies (sponge effect), and flood risk reduction. Likewise, wetlands play a critical role in recharging groundwater supplies and mitigating the impacts of drought through their water storage and slow release mechanisms. Wetlands contribute to climate change mitigation and adaptation while also providing critical habitat for a wide range of species8,9. Integrating wetland conservation into climate policies and adaptation strategies is essential for maximizing the benefits they provide to ecosystems and human communities. By recognizing the importance of wetlands as natural solutions to climate change, we can enhance their resilience and certify their inexorable provision of valuable amenities in a changing climate.
Indeed, despite their significant ecological and societal benefits, wetlands around the world continue to face numerous threats, leading to their loss and degradation10. Worldwide, the loss of wetlands has been primarily attributed to a combination of anthropogenic factors including: ecosystem transformation for infrastructure development and intensive agriculture, urban sprawl, pollution from industrial activities, domestic sewage, and agricultural runoff, climate change4,8, unsustainable levels of grazing and fishing activities11, cultural eutrophication, and nitrate toxicity to humans and animals and phosphate induced eutrophication12,13. The loss of wetland areas negatively affects their essential functions and ecosystem services, resulting in deteriorated water quality, increased flood risk, loss of biodiversity, and reduced capacity to mitigate climate change. Protecting and restoring wetlands is essential for maintaining these critical functions and ensuring the continued endowment of ecosystem goods and services to both ecosystems as well as human communities.
The land use land cover (LULC) changes in vicinity of wetland directly influence the wetland health. Therefore, it is important to study transformations in LULC around the wetland14. LULC change detection techniques are commonly employed to analyse and understand the spatio-temporal patterns of changes in wetland surroundings, which is important for sustainability and management of wetlands15. LULC change detection is important to devise suitable strategies for ecosystem restoration16. Remote sensing, GIS and satellite imageries are essential tools for studying LULC changes in wetland ecosystems. Among the various satellite imageries available, Landsat imageries have been most commonly used for to study the change in LULC. Bhattacharjee et al. 202117 studied the LULC changes of a wetland ecosystem of Bangladesh using RS, GIS and Landsat imageries over the period of 30 years (1989-2019). Ngondo et al. 202118 evaluated the LULC changes in the Wami–Ruvu Basin, Tanzania using Landsat imageries for 28 years period.
The Kashmir valley, Northern part of Jammu and Kashmir, is bestowed with many water bodies including lentic ecosystems, littorals and wetlands. The area under wetlands in Kashmir is more than 7000 hectares, Hokersar, Shallabugh, Hygam, Freskoori, Narkara, etc. Jamal and Ahmad 202014 assessed the changes in and around the wetland ecosystem of Wular Lake, Anchar Lake and Hokersar wetland using Landsat imageries. Alam et al. 201119 deliberated on the impact of LULC changes on Hokersar wetland. Similarly, Bano et al. 201820 analyzed changes LULC in Hokersar wetland and Bashir et al. 202221 evaluated the changes in LULC of Shallabugh wetland. In these studies, it has been reported that the wetlands in valley are facing various types of threats including accelerated eutrophication, increased siltation, over-grazing, decreased water spread, and immense LULC changes. Most of these studies have focused on LULC dynamics within the wetland14, neglecting the changes in LULC around the wetland. Many studies have been conducted on these wetlands but no such scientific study has been undertaken in Nowgam wetland. In this context, the present study was conducted to have an insight knowledge regarding changes encountered in the LULC around the Nowgam wetland using the RS, GIS and satellite imageries.
Methodology
Study area
The Kashmir valley is bestowed with a numerous consortium of wetlands extending in an area of about 7000 hectares20 but improper management strategies has left them into shambles and Nowgam wetland in Sumbal area of Bandipora (43 Kms in the northwest of Srinagar) is one of such neglected wetlands of the valley. The Nowgam wetland is located at the border of two northern districts, viz., Baramulla and Bandipora of Kashmir valley. Nowgam wetland is geographically located between the coordinates 34o12’03’’ to 34o 13’ 42’’ N and 74o 33’ 45’’ to 74o 36’ 24’’ E, occupying an area of about 9.6 km2. The Nowgam wetland experiences maximum and minimum temperatures of 30.4 oC and -3.3 oC in December, respectively. The study area receives an average annual rainfall of approximately 1281 mm, based on data from 1980 to 2022. The study area receives rainfall during March, April and May, followed by relatively dry period during June to August. The weather data, including temperature and rainfall, indicate that the study area experiences a temperate climate with clearly defined seasons, featuring warm summers and cold winters. The wetland is primarily fed by a tributary of river Jhelum, and, is depth wise shallow and temporary/ seasonal in occurrence with very rich biodiversity.
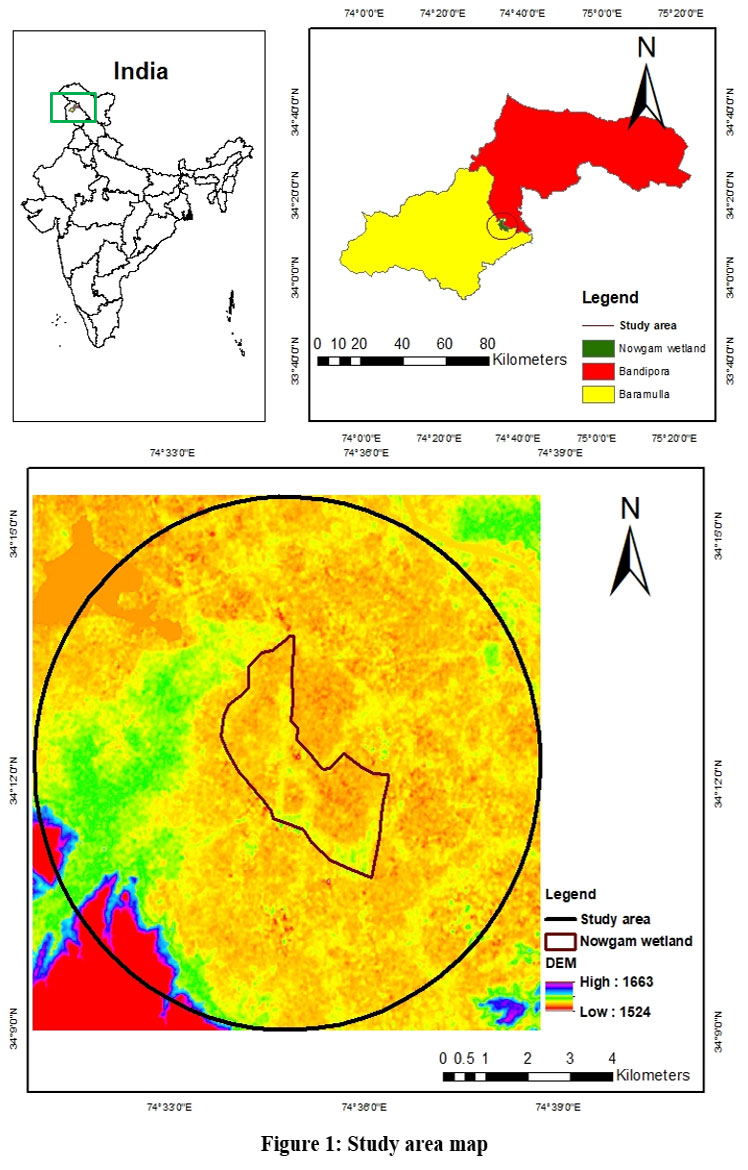 | Figure 1: Study area map
|
Data used
Satellite imageries are the primary data for detection of LULC change of any area in a given time. Satellite images of more than one time periods are compared to estimate the transformations in land use over the period of time. In the present study, three cloud-free Landsat imageries, “LANDSAT-7 Enhanced Thematic Mapper Plus (ETM+) (dated 11th September 2000; image data ID: LE07_L2SP_149036_20000911_20200917_02_T1), LANDSAT-7ETM+ (dated 17th September 2010; image data ID: LT05_L2SP_149036_20101017_20200823_02_T1) and LANDSAT-08 Operational Land Imager (OLI) (dated 10th September 2022; image data ID: LC08_L2SP_149036_20220831_20220910_02_T1)” of three separate dates were downloaded from the website (https://earthexplorer.usgs.gov/). Many studies have used Landsat imageries for LULC detection owing to its free cost, better resolution and proper information22,23. Autumn images were chosen specifically to ensure cloud-free coverage of the landscape. The particulars of the satellite imageries used for detection of LULC around the Nowgam wetland are depicted in Table 1.
Table 1: Details of Landsat imageries used for the study
Imagery | Data type | Source | Specifications | Date |
LANDSAT-7ETM+ | Spatial | USGS | “Path/Row 149/36 Resolution 30 m” | 11 September 2000 |
LANDSAT-7ETM+ | Spatial | USGS | “Path/Row 149/36 Resolution 30 m” | 17 September 2010 |
LANDSAT-08 OLI | Spatial | USGS | “Path/Row 149/36 Resolution 30 m” | 10 September 2022 |
LULC classification
The classification of the images was carried out using the “maximum likelihood” method. The seven bands of the imagery were combined to generate the composite imagery using the image analysis option in ArcGIS 10.4. After conducting image enhancements, the subsequent step in the analysis included gathering an adequate number of training polygons to classify LULC categories. This process was carried out using the training sample manager in ArcGIS 10.424. The area of interest (AOI) (6 km around the wetland) was extracted from the composite imagery and image classification was done on the AOI. Five classes, viz., water, agriculture, settlements, vegetation and bareland have been identified. Approximately 100 training samples were identified for each class and subjected to statistical analysis for similarities. Field visits were carried out in the study area for ground-truthing. In order to check the accuracy of older images, ground-truthing was done with the help of Google earth. The LULC maps were prepared for 2000, 2010 and 2022. These maps were analysed to determine the LULC changes that ensued over the years. The magnitude of each LULC change on the temporal basis was assessed using percent change25 and transition matrix model26,27.
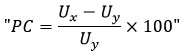
Where, “PC = percent change in LULC”, “Uy= area under particular LULC at beginning of time period”, and “Ux= area under particular LULC at the end of time period.”
The attribute tables of the classified imageries were transferred to MS Excel to calculate area under each LULC class and change in area of each class.
Accuracy assessment
An essential aspect of image classification is accuracy assessment, which aims to evaluate the accuracy of pixel sampling in a classified image. This assessment is conducted, measured, and quantified using an error matrix28. A total of 100 sample points were selected by adopting the stratified random sampling29, which were subsequently verified through extensive ground-truthing. The historical imagery from Google Earth for Landsat-5 TM (30 m, 2000) and Landsat-7 ETM+ (30 m, 2010), and Landsat-8 OLI imagery (30 m resolution, 2010) were utilized for this purpose. The producer’s efficiency, user’s efficiency, overall efficiency, and kappa coefficient were computed based on the error matrix30 and were derived using the prescribed formulae:
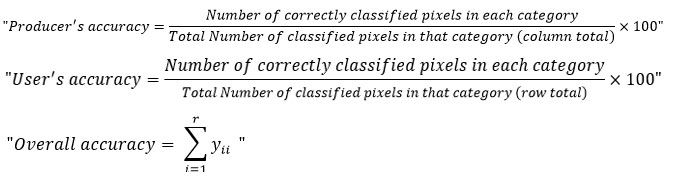
Where, “yii and y represent diagonal elements and total number of samples in error matrix, respectively.”
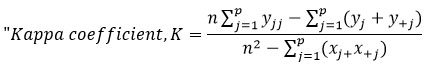
Where, “n and p represent the total number of observations and number of rows in the matrix, respectively; yjj represents the number of observations in row j and column j. yj+ and y+j represents the marginal totals of row j and column j respectively”
Results
Accuracy assessment
The accuracy assessment of generated LULC maps was conducted by the formulation of an error matrix. The overall accuracy for different maps for year 2000, 2010 and 2022 was 89.38%, 91.15% and 90.26%, respectively. Similarly, the kappa coefficient was found to be 0.865, 0.887 and 0.874 for year 2000, 2010 and 2022, respectively (Table 2). Therefore, the accuracy of the classified maps is deemed satisfactory, indicating that the obtained outcomes of LULC can be regarded reliable.
Table 2: Overall accuracy results of LULC classification for images of (a) 2000 (b) 2010 and (c) 2022
(a) 2000 | |||||||
Class | Water | Agriculture | Settlement | Vegetation | Bareland | Total (User) | User efficiency (%) |
Water | 15 | 1 | 0 | 0 | 1 | 17 | 88.24 |
Agriculture | 0 | 23 | 0 | 2 | 0 | 25 | 92.00 |
Settlement | 0 | 1 | 21 | 0 | 2 | 24 | 87.50 |
Vegetation | 0 | 1 | 0 | 30 | 1 | 32 | 93.75 |
Bareland | 0 | 0 | 2 | 1 | 12 | 15 | 80.00 |
Total (Producer) | 15 | 26 | 23 | 33 | 16 | 113 | |
Producer efficiency (%) | 100.00 | 88.46 | 91.30 | 90.91 | 75.00 | ||
Overall efficiency | 89.38 | ||||||
Kappa | 0.865 | ||||||
(b) 2010 | |||||||
Class | Water | Agriculture | Settlement | Vegetation | Bareland | Total (User) | User efficiency |
Water | 16 | 0 | 0 | 0 | 1 | 17 | 94.12 |
Agriculture | 0 | 28 | 0 | 3 | 1 | 32 | 87.50 |
Settlement | 0 | 0 | 19 | 1 | 0 | 20 | 95.00 |
Vegetation | 0 | 1 | 1 | 27 | 0 | 29 | 93.10 |
Bareland | 0 | 0 | 1 | 1 | 13 | 15 | 86.67 |
Total (Producer) | 16 | 29 | 21 | 32 | 15 | 113 | |
Producer efficiency (%) | 100.00 | 96.55 | 90.48 | 84.38 | 86.67 | ||
Overall efficiency | 91.15 | ||||||
Kappa | 0.887 | ||||||
(c) 2022 | |||||||
Class | Water | Agriculture | Settlement | Vegetation | Bareland | Total (User) | User efficiency |
Water | 19 | 0 | 0 | 1 | 1 | 21 | 90.48 |
Agriculture | 1 | 24 | 0 | 2 | 0 | 27 | 88.89 |
Settlement | 0 | 1 | 16 | 0 | 0 | 17 | 94.12 |
Vegetation | 0 | 3 | 0 | 32 | 0 | 35 | 91.43 |
Bareland | 0 | 0 | 2 | 0 | 11 | 13 | 84.62 |
Total (Producer) | 20 | 28 | 18 | 35 | 12 | 113 | |
Producer efficiency (%) | 95.00 | 85.71 | 88.89 | 91.43 | 91.67 | ||
Overall efficiency | 90.26 | ||||||
Kappa | 0.874 | ||||||
LULC Changes
Wetland ecosystems of the Nowgam wetland have observed significant changes in LULC over the period of 22 years (2000-2022.) The details of LULC of different land use classes around the Nowgam wetland (2000–2010–2022) including a buffer of 6 km2 are given in Figs. 2, 3 and 4 and Tables 3and 4, respectively.
Water
The analysis of classified imageries revealed that the area under the water has continuously decreased over the last 22 years. The total area under water was 36.40 km2 in 2000 which reduced to 27.89 km2 in 2010 and 16.0 km2 in 2022 (Table 3). The area under water was about 25.15%, 19.27 % and 11.06 % in 2000, 2010 and 2022, respectively. There was net decrease of about 56.04% in the area under water over the time period of 22 years (Table 4). The area under water has primarily been converted into agriculture and settlements.
Agriculture
The agricultural area has escalated gradually during the research period. The agricultural area measured approximately 29.44 km² in 2000, expanded to 31.31 km² in 2010, and further increased to 42.61 km² by 2022 (Tables 3). It was observed that the area under agriculture increased only by 6.33% from 2000 to 2010, however in the next 12 years (2010-2022), there has been drastic increase of 36.11%. Overall, agricultural area has increased by about 44.73% over the period of 22 years (Table 4). The increase in agricultural area may be due to the adoption of paddy cultivation in submerged and waterlogged areas of the wetland for earning their livelihoods by the inhabitants.
Settlement
The area under settlement has shown an increasing trend during the course of study. The area under this category was about 25.89 km2, 28.16 km2 and 33.91 km2 in 2000, 2010 and 2022, respectively (Table 3). Settlements increased by about 8.80% in one decade (2000-2010) and 20.40% in next 12 years (2010-2022). The net increase in settlements was about 31% from 2000 to 2022 (Table 4). Some area under vegetation and water has been converted into the settlements which may be due to the encroachments into the water and vegetation.
Vegetation
The area under vegetation has marginally decreased over the last 22 years. The analysis showed that the area under vegetation was 33 km2 in 2000, 31.47 km2 in 2010 and 30.60 km2 in 2022, which accounted for 22.80%, 21.74% and 21.14%, respectively (Table 3). This shows that the vegetation in the study area has more or less remained constant over the study period. Table 4 demonstrates the meagre reduction of 4.6% in vegetation area from 2000 to 2010, and further reduction of about 2.74% from 2010-2022. The overall decrease of about 7.27% has been observed in vegetation in 22 years which has been converted into settlements and barelands (Table 4).
Bareland
The area under bareland was about 20.0 km2 in 2000, which increased to 25.90% in 2010 and then decreased to 21.60% in 2022. The area under bareland increased by 5.90 km2 (29.47%) from 2000-2010 and decreased by 4.30 km2 (16.58%) from 2010-2022. Overall, from the last 22 years, the area under bareland has increased by 8.02% which accounts for the percent change of about 31%. The upsurge in the barren land may be endorsed to deforestation in the study area.
Table 3: LULC statistics of the study area in 2000, 2010 and 2022
Class | 2000 | 2010 | 2022 | |||
Area (km2) | Percent | Area (km2) | Percent | Area (km2) | Percent | |
Water | 36.40 | 25.15 | 27.89 | 19.27 | 16.00 | 11.06 |
Agriculture | 29.44 | 20.34 | 31.31 | 21.63 | 42.61 | 29.44 |
Settlement | 25.89 | 17.89 | 28.16 | 19.46 | 33.91 | 23.43 |
Vegetation | 33.00 | 22.80 | 31.47 | 21.74 | 30.60 | 21.14 |
Bareland | 20.00 | 13.82 | 25.90 | 17.89 | 21.60 | 14.93 |
Total | 144.72 | 100.00 | 144.72 | 100.00 | 144.72 | 100.00 |
Table 4: Overall LULC change in the study area
Class | 2000-2010 | 2010-2022 | 2000-2022 | |||
Area (km2) | % change | Area (km2) | % change | Area (km2) | % change | |
Water | -8.51 | -23.37 | -11.89 | -42.63 | -20.40 | -56.04 |
Agriculture | 1.87 | 6.33 | 11.30 | 36.11 | 13.17 | 44.73 |
Settlement | 2.28 | 8.80 | 5.75 | 20.40 | 8.02 | 30.99 |
Vegetation | -1.53 | -4.6 | -0.87 | -2.74 | -2.40 | -7.27 |
Bareland | 5.90 | 29.47 | -4.30 | -16.58 | 1.60 | 8.00 |
 | Figure 2: LULC map around Nowgam wetland (6 km buffer) for the year 2000
|
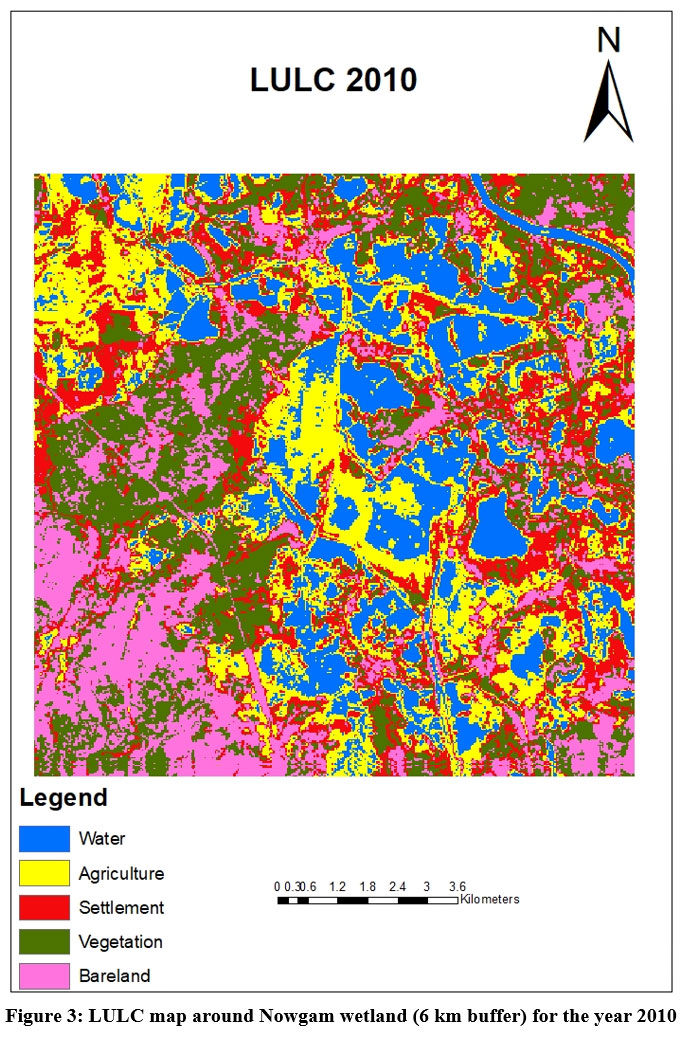 | Figure 3: LULC map around Nowgam wetland (6 km buffer) for the year 2010
|
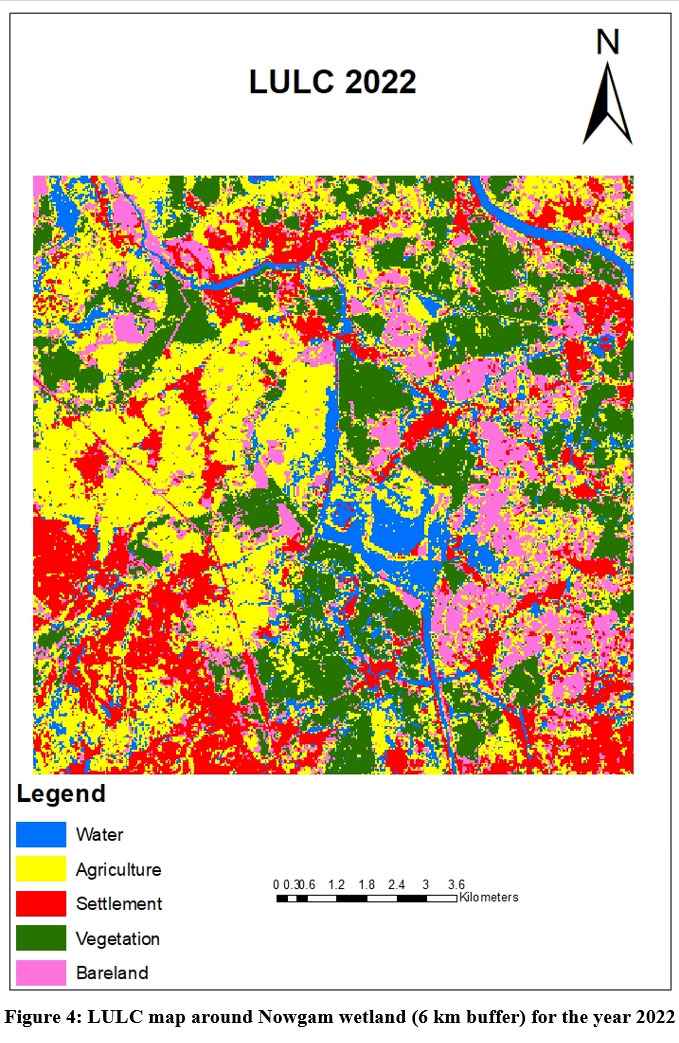 | Figure 4: LULC map around Nowgam wetland (6 km buffer) for the year 2022
|
Discussion
In context of the results, there are considerable changes in LULC around the Nowgam wetland. The areal decrease under the water may be due to conversion of small water bodies/marshy lands in the tree plantation. It can be observed from Fig. 2 the water bodies in the 2010 have converted into vegetation in 2022. However, some area under vegetation has been converted into the agriculture. Jamal and Ahmad 202114 have reported similar results for some other wetland ecosystems including Hokersar and Anchar located in Kashmir Himalayas. The plantation of willow trees (Salix alba) in the region has been carried out by state government agencies over the years, which may be the reason for decreased area under water. Bashir et al.21 also reported increase in vegetation area in Shallabugh wetland in Kashmir valley which was primarily due to afforestation/plantation efforts by local community and Forest Department. From the LULC maps, it is clear that some portion of the vegetation has been converted into the agriculture, which is reason of increased area under the agriculture.22 The motivational stimulus in this perspective is based on the traditional agrarian profession in Nowgam area whose dwellers have been working in the Government Rakhs and Farms from many generations. The area under settlements has increased which may be attributed to the residential needs of the increased demography (construction of new houses, educational institutes and health centres) in the study area14. Other research studies have also testified increased settlements in other countries.31 The increase in settlements may pose a serious threat to the wetland ecosystems. As reported by Bano et al.20, the migration of migratory birds has considerably reduced in other wetlands of the Kashmir valley32. Wetland ecosystems in regions experiencing rapid population growth and economic development tend to have diminished ecological value, a trend also observed in countries like Ethiopia and Zimbabwe.22,33. Mostly the bareland has converted into the settlements, which has resulted into decreased area under the bare-land during 2010-202231. Alam et al. 201119 also showed that the expanse under settlements and vegetation has amplified from 1986 to 2005, whereas, area under water has decreased considerably over a particular course of time. Assefa et al. 202122 also revealed that the area under water bodies around the wetland has decreased while those under the settlements have increased in 35 years period. Therefore, our results are in consonance with many other studies across the globe. These changes in LULC around the wetland may have catastrophic effects on the various characteristics of the wetland34. It is thus affirmed that the present investigation may offer a basic insight to policy makers about the LULC dynamics for mitigating the impact of changing landuse around the Nowgam wetland.
Conclusions
The present discourse assessed LULC changes around a 6 km buffer strip of Nowgam wetland located in Kashmir valley of Himalayas. The LULC changes were determined for last 22 years using the Landsat imageries of 2000, 2010 and 2022. The images were classified using the supervised image classification in ArcGIS. The area under the wetland has gone considerable changes in the LULC during the study period. The area under agriculture, bareland and settlement has escalated, whereas, area under water bodies and vegetation has decreased. The changes in LULC around the wetland may have some serious implications within the wetland ecosystem which need to be studied in future. It is suggested to relate the LULC changes with the soil erosion and sediment deposition within the wetland. This study may provide an insight to the researchers about the changes in LULC around the wetland to frame some conservation measures to mitigate the consequences of the changing LULC on the wetland ecosystem. It is further suggested to carry out the LULC change within the wetland also so as to determine the effect of LULC changes in surroundings on the wetland.
Acknowledgments
“The PDF-Fellow (Dr. Moonisa Aslam Dervash) is the awardee of ICSSR Post-Doctoral Fellowship. This paper is largely an outcome of the Post-Doctoral Fellowship sponsored by the Indian Council of Social Science Research (ICSSR). However, the responsibility for the facts stated, opinions expressed, and the conclusions drawn is entirely of the author”
Funding Sources
Dr. Moonisa Aslam Dervash is the awardee of ICSSR Post-Doctoral Fellowship (F. No. 3-151/2021-22/PDF/GEN).
Conflicts of Interest
The authors declare no conflict of interest.
Ethics Approval Statement
All the data and results pertaining to this current study is the own original work done by the authors in a truthful and complete manner.
Data Availability Statement
The manuscript incorporates all datasets produced or examined throughout this research study.
Authors’ Contribution
All authors contributed to the study conception and design. 1. Concept, Supervision, Review was done by Bashir Ahmad Ganai 2. Data collection, Survey, LULC detection, Formal Analysis, Manuscript preparation and editing was jointly done by Moonisa Aslam Dervash and Abrar Yousuf.
References
- Roy M. B., Nag S., Halder S., Roy S. S. Assessment of wetland potential and bibliometric review: a critical analysis of the Ramsar sites of India. Bull Natl Res Cent. 2022;46:59.
CrossRef - Ghermandi A., Bergh, J. C. J.M., Brander L., Groot H. L. F., Nunes P. A. L. D. The economic value of wetland conservation and creation: a meta-analysis. Nota di Lavoro, No. 79.2008, Fondazione Eni Enrico Mattei (FEEM), Milano
CrossRef - Alikhani S., Nummi P., Ojala A. Urban wetlands: a review on ecological and cultural values. Water. 2021;13:3301.
CrossRef - Bassi N., Kumar D., Sharma A., Paradha-Saradhi P. Status of wetlands in India: A review of extent, ecosystem benefits, threats and management strategies. J Hydrol: Reg Studies. 2014;2:1-19
CrossRef - Chandrakar A. K., Dhuria S. S. Sustainable wetland management in India: charting a course for a sustainable future. Life Sci Int Res J. 2020;7:46-52.
- Bystrom O., Andersson H., Gren I. Economic criteria for using wetlands as nitrogen sinks under uncertainty. Ecol Econ. 2000;35:35-45.
CrossRef - Minga J., Xian-guo L., Lin-shu X., Li-juan C., Shouzheng T. Flood mitigation benefit of wetland soil — A case study in Momoge National Nature Reserve in China. Ecol Econ. 2007;61:217-223.
CrossRef - Salimi S., Almuktar S. A. N., Scholz M. Impact of climate change on wetland ecosystems: A critical review of experimental wetlands. J Environ Manage. 2021;286:112160
CrossRef - Mishra S., Narain S. Floristic and ecological studies of Bakhira wetland, Uttar Pradesh, India. Indian For. 2010;136:375-380.
- Euliss N. H., Mushet D. M., Newton W. E., Otto C. R. V., Nelson R. D., LaBaugh J.W., Scheriff E.J., Rosenerry D.O. Placing prairie pothole wetlands along spatial and temporal continua to improve integration of wetland function in ecological investigations. J Hydrol. 2014;513:490-503.
CrossRef - Verhoeven J. T. A., Setter T. L. Agricultural use of wetlands: opportunities and limitations. Ann Bot. 2010;105:155-163.
CrossRef - Ansari A.A., Naeem M., Gill S.S., Alzuibir F.M. Phytoremediation of contaminated waters: An eco-friendly technology based on aquatic macrophytes application. The Egyptian J Aquatic Res. 2020;46:371-376.
CrossRef - Saeed T., Paul B., Afrin R., Al-Muyeed A., Sun G. Floating constructed wetland for the treatment of polluted river water: a pilot scale study on seasonal variation and shock load. Chem Engg J. 2015;287:62-73.
CrossRef - Jamal S, Ahmad WS. Assessing land use land cover dynamics of wetland ecosystems using Landsat satellite data. SN Applied Sciences. 2020; 2:1891
CrossRef - Ghobadi Y., Pradhan B., Kabiri K., Pirasteh S., Shafri H. Z. M, Sayyad G. A. Use of multi-temporal remote sensing data and GIS for wetland change monitoring and degradation. 2012 IEEE Colloquium on Humanities, Science and Engineering (CHUSER), Kota Kinabalu, Malaysia, 2012, pp. 103-108.
CrossRef - Parashar, D., Kumar, A., Palni, S., Pandey, A., Singh, A. and Singh, A.P. Use of machine learning-based classification algorithms in the monitoring of Land Use and Land Cover practices in a hilly terrain. Environmental Monitoring and Assessment, 2024;196(1), p.8.
CrossRef - Bhattacharjee S., Islam M. T., Kabir M. E., Kabir M. M. Land-use and land-cover change detection in a north-eastern wetland ecosystem of Bangladesh using remote sensing and GIS techniques. Earth Sys Environ. 2021;5:319-340.
CrossRef - Ngondo J., Mango J., Liu R., Nobert J., Dubi A., Cheng H. Land-use and land-cover (LULC) change detection and the implications for coastal water resource management in the Wami–Ruvu Basin, Tanzania. Sustainability. 2021;13:4092.
CrossRef - Alam A., Rashid S. M., Bhat M. S., Sheikh A. H. Impact of land use/land cover dynamics on Himalayan wetland ecosystem. J Exl Sci. 2011;2:60-64.
- Bano H., Lone F. A., Bhat J. I. A., Rather R. A., Malik S., Bhat M.A. Hokersar wetland of Kashmir: its utility and factors responsible for its degradation. Plant Archives. 2018;18:1905-1910.
- Bashir I., Lone F. A., Mir S. A., Beigh B. A., Mir I. A. Assessment of land use and land cover change in Shallabugh wetland of Kashmir Himalaya using Landsat TM and LISS IV satellite datasets. Curr World Environ. 2022;17:1-9.
CrossRef - Aseffa W. W., Eneyew B. G., Wondie A. The impacts of land-use and land-cover change on wetland ecosystem service values in peri-urban and urban area of Bahir Dar City, Upper Blue Nile Basin, Northwestern Ethiopia. Ecol Process. 2021;10:39.
CrossRef - Dubeau P., King J. K., Unbushe D. G., Rebelo L. M. Mapping the Dabus wetlands, Ethiopia, using random forest classification of Landsat, PALSAR and Topographic data. Remote Sensing. 2017;9:1056.
CrossRef - Lillesand T. M., Kiefer R. W. Remote sensing and image interpretation. 7th Edition, 2015, Wiley, New York.
- Fenta A. A., Yasuda H., Haregeweyn N., Belay A. S., Hadush Z., Gebremedhin M. A., Mekonnen G. The dynamics of urban expansion and land use/land cover changes using remote sensing and spatial metrics: the case of Mekelle City of northern Ethiopia. Int J Remote Sens. 2017;38:4107–4129.
CrossRef - Gashaw T., Tulu T., Argaw M., Worqlul A. W. Evaluation and prediction of landuse/land cover changes in the Andassa watershed, Blue Nile Basin, Ethiopia. Environ Syst Res. 2017;6:17.
CrossRef - Berihun M. L., Tsunekawa A., Haregeweyn N., Meshesha D. T., Adgo E., Tsubo M., Masunaga T., Fenta A. A., Sultan D., Yibeltal M. Exploring land use/land cover changes, drivers and their implications in contrasting agro-ecological environments of Ethiopia. Land Use Policy. 2019;87:104052.
CrossRef - Foody G. M. Status of land cover classification accuracy assessment. Remote Sens Environ. 2002;80:185-201.
CrossRef - Shooshtari S. J., Gholamalifard M. Scenario-based land cover change modeling and its implications for landscape pattern analysis in the Neka Watershed. Iran Remote Sens Appl Soc Environ. 2015;1:1-9.
CrossRef - Lu D., Weng Q. A survey of image classification methods and techniques for improving classification performance. Int J Remote Sens. 2007;28:823–870
CrossRef - Abebe, G., Getachew, D. & Ewunetu, A. Analysing land use/land cover changes and its dynamics using remote sensing and GIS in Gubalafito district, Northeastern Ethiopia. SN Appl. Sci. 4, 30 (2022). https://doi.org/10.1007/s42452-021-04915-8
CrossRef - Hamid F. A study on waterfowl population and human use of Hokersar and Hygam wetlands of Kashmir valley for conservation planning. Ph.D. Thesis, Saurashtra University, Rajkot, Gujarat, India, 2009.
- Marambanyika T., Beckedahl H., Ngetar N.S., Dube T. Assessing the environmental sustainability of cultivation systems in wetlands using the WET-health framework in Zimbabwe. Phys Geog. 2017;38:62–82.
CrossRef - Biswas, M., Banerji, S., Mitra, D. Land-use–land-cover change detection and application of Markov model: A case study of Eastern part of Kolkata. Environment, Development and Sustainability. 2020;22.
CrossRef


