Estimation of Runoff at Shetrunji River Basin using SWAT Hydrological Modelling
Zarna J. Chovatiya1
*
 , Gargi Rajapara1
and Mohdzuned. M. Shaikh2
, Gargi Rajapara1
and Mohdzuned. M. Shaikh2
1
Civil Engineering Department,
Kadi Sarva vishwavidhyalaya,
Gandhinagar,
Gujarat
India
2
L.D. College of Engineering,
Ahmedabad,
Gujarat
India
http://dx.doi.org/10.12944/CWE.19.2.33
Copy the following to cite this article:
Chovatiya Z. J, Rajapara G, Shaikh M. M. Estimation of Runoff at Shetrunji River Basin using SWAT Hydrological Modelling. Curr World Environ 2024;19(2). DOI:http://dx.doi.org/10.12944/CWE.19.2.33
Copy the following to cite this URL:
Chovatiya Z. J, Rajapara G, Shaikh M. M. Estimation of Runoff at Shetrunji River Basin using SWAT Hydrological Modelling. Curr World Environ 2024;19(2).
Download article (pdf)
Citation Manager
Publish History

Introduction
Due to heavy and fast growth of population, polluted water scenario and sudden change of climate, availability of water is nowadays crucial issue.1Almost many sections of world are facing water crises because of non uniform division of water resources over time and space and their haphazard usage by human as well. Here is the main requirement for the planning managers or someone who is making policies regarding the same to look into for a perfect management of resource of water.2Thus Watershed management is the demand of the ecosystem. Out of various methods available in the era, simulation is the one that is widely used and accepted by the research community. This is the high time to recognize the crucial points in accordance of the conservation of water resources balance.3 From the extensive literature review it is found that there are number of models available to simulate the hydrology of the watershed. Out of numerous hydrological models available, many can be used to represent the various functions of the hydrological cycle of the watershed.3SWAT being available in the public domain is widely used because+++ of its versatility in the field of simulation.4
With the usage of SWAT, varieties of problems related to water resources can be easily and effectively sorted out, because of some of its characteristic features like comprehensive nature of the model, solid model support and open accessibility of the source model.4 Moreover, the estimation of maximum and minimum events has become very important in order to manage the watersheds efficiently. Evaluating runoff from a catchment in accordance with rainfall and directing runoff downstream via a network of rivers is a traditional operational hydrologic problem.5 From all the research done in the water resources, one of the most important parameters found is runoff .6Assessment of direct runoff for ungauged stream basins is time taking and difficult. The conventional models for anticipating runoff requires impressive hydrological and meteorological information.7To achieve this objective, simulation of runoff is very vital through which we can understand the existing scenario of the watershed hydrology and the same can be used for forecasting. This makes the simulation of runoff a very efficient capability of Geo- Spatial techniques.3 The projected Hydro-Meteorological parameters shows the worse climatic conditions which mandates the mitigation steps to be adopted in order to balance the severe impacts.8 Before joining the ocean, almost all of Gujarat's major rivers go across a large area of extremely flat land. These low-lying areas in lower river basins are vulnerable to annual flooding. Shetrunji reservoir’s Full Reservoir Level (FRL) is generally exceeding due to the in flow of significant amount of water due to Shetrunji River and all its branches.9The change in climate of the northern portion of the basin's upper reach and the southernmost portion of its middle reach of basin were the major culprit behind rainfall and runoff. The significant observation has been carried out for Shetrunji basin that the areal average depth of monsoon runoff for whole mentioned area was rising notably at the rate of 17.7mm in every10 years span.10 In order to minimize the extent of damage, the estimation of runoff that has been carried out with current research work in the downstream of the Shetrunji basin with the help of Hydrological modelling.
Study Area
In Saurashtra (Gujarat, India) Shetrunji River basin is one of the most vulnerable Rivers in accordance with climate change. In the lower Shetrunji River basin, this investigation is being carried out. Figure 1 shows map of India that includes map of Gujarat state and lower Shetrunji River basin as well.
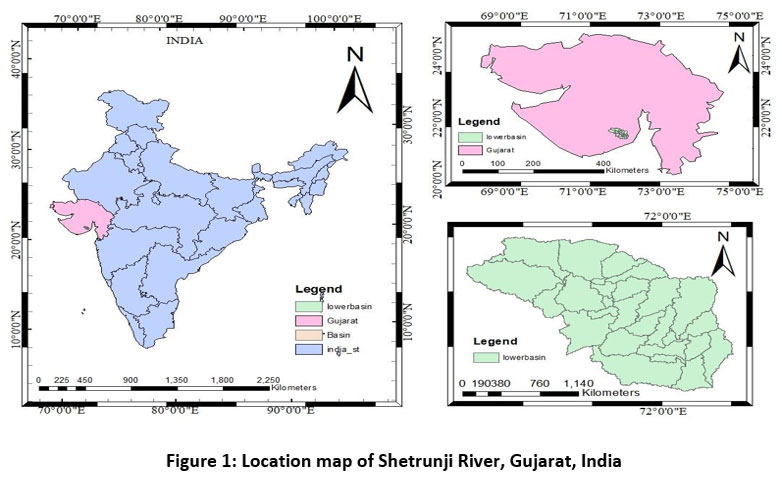 | Figure 1: Location map of Shetrunji River, Gujarat, India.
|
This river originates in the Chachai hills and travels eastward until it meets the Gulf of Khambhat close to the port of Santrampur. This river is 277 km long with the catchment of 5646 km2. The yearly mean rainfall of 673.15mm. From the river source, the Khodiyar and Shetrunji dams are situated on Shetrunji river at 55 km and 160 km, respectively. It provides water to Amreli, Bhavnagar and Junagadh for agriculture. With an average temperature over a range of month from 14.5°C to 20°C and highest temperature over a month ranging from 30°C to 44°C in May, the study area's climate can be categorised as tropical and sub-tropical. January is the coolest month.11
Methodology
The study’s methodology involves description of hydrological model, data collection and model setup steps. First sub section elaborates SWAT model for the study area.
SWAT Model
The study uses Soil and Water Assessment Tool (SWAT) as its model because it is open-source, free, well-documented, and has undergone extensive testing globally.
SWAT is a physically based semi-distributed model that can be used to estimate different hydrological parameters, nutrients flow and sediment transport within the Watershed scale.12 The runoff volume in SWAT is simulated by using the SCS curve number method.15
![]()
Where, SWt = Final soil water content (mm)
SWo = Initial soil water content on day i (mm)
t = time period measurement in days
Rday = rainfall measurement on day i (mm)
Qsurf = amount of surface runoff measurement on day i (mm)
Ea = Amount of evapotranspiration on day i (mm)
Wseep = seepage of water from soil to underlined layers on day i (mm)
Qgw = measurement of ground water run off for day i (mm)
The study uses ArcGIS version 10.3.1, which interfaces with ArcSWAT. Like any other semi-distributed hydrological model, it gathers some temporal data in the form of weather files and some spatial data in the form of maps.
SWAT, being a semi-distributed model, must measure, analyse, and spatially aggregate this data using geographic information systems (GIS). Therefore, as a free additional extension for ArcGIS, ArcSWAT, the model was integrated with GIS programming to promote its use.
The methodology for the runoff analysis at the basin outlet utilizing SWAT is shown in flow diagram Figure. 2.
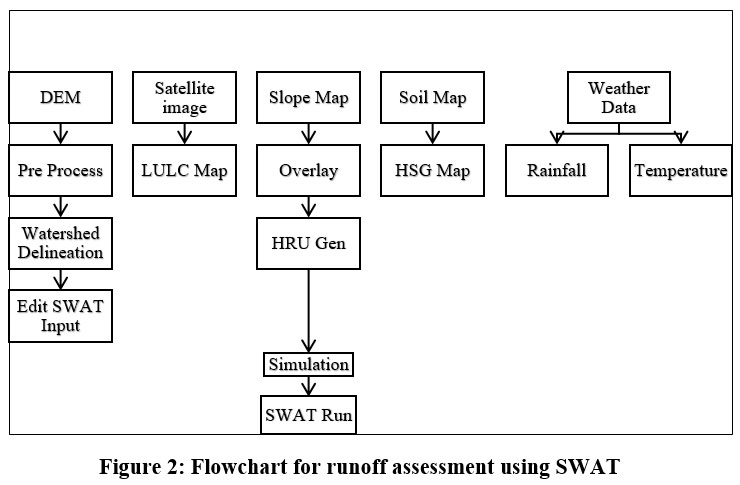 | Figure 2: Flowchart for runoff assessment using SWAT.
|
Several thematic maps, including elevation, soil and land use/cover maps were created in Arc GIS to investigate runoff and site appropriateness. By Combining above created data with hydrological data which has been collected from data centre, following table1 is mentioned below.
Table 1: Sources of data
DATA | SOURCE | RESOLUTION |
Digital elevation model (DEM) | SRTM 1 Arc-second Global (USGS earth explorer) | 30m |
Land use and land cover (LULC) | Esri Sentinel-2 | 10m |
Soil map | FAO (Food and Agriculture Organization) | 30m |
Hydrological data (Rainfall data, Max. &Min. Temperature) | SWDC, Gandhinagar | Daily |
Digital elevation model (DEM)
Digital elevation model for watershed delineation has been downloaded from USGS earth explorer website which is depicted in diagram below
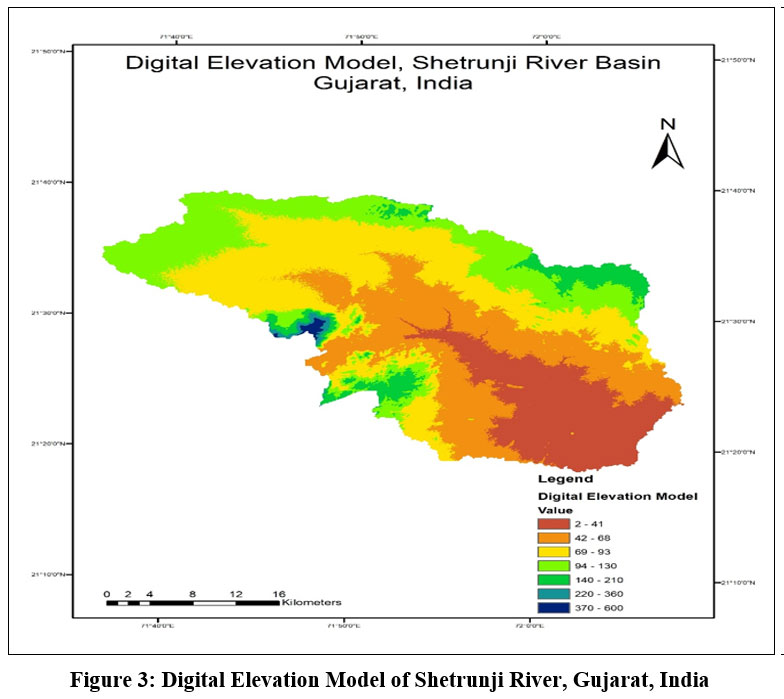 | Figure 3: Digital Elevation Model of Shetrunji River, Gujarat, India
|
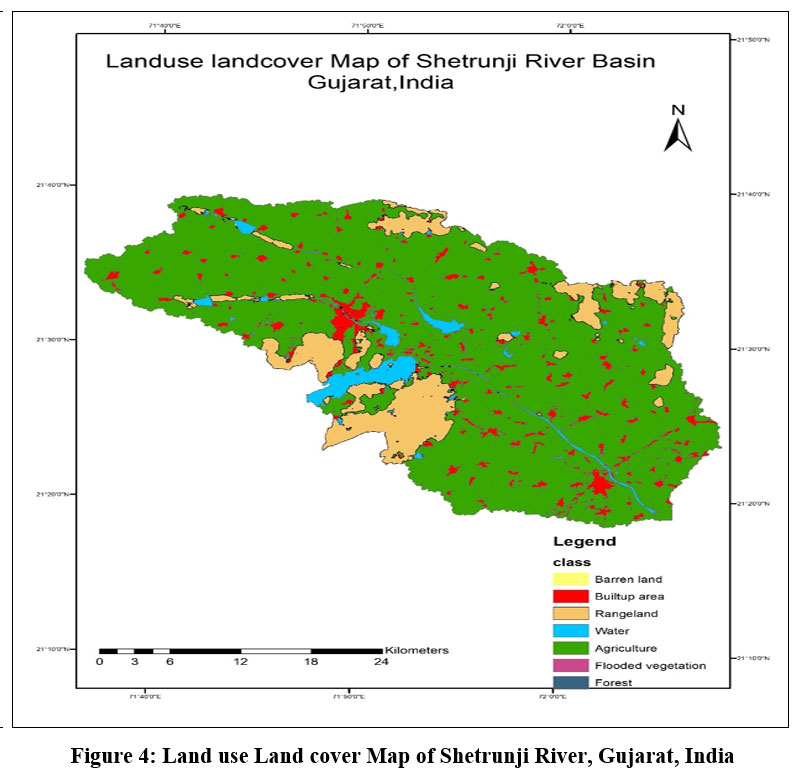
Land use and land cover (LULC)
For HRU analysis, Land Use or Land Cover (LULC) data is essential. It divides the watershed into sub-basins according to patterns of land use, classifying various land uses within the watershed. Next, LULC data is combined with information about slope and soil to define HRUs. A homogenous area with comparable hydrological reactions is represented by each HRU. Surface runoff from each HRU is computed using SWAT using LULC-specific runoff coefficients.
The data set describes the different land cover types present in the River basin written in Table 2.
Table 2: LU/LC scenario
LULC Classes | Area (km2 ) | Area (%) |
Water | 39.95 | 3.31 |
Forest | 0.14 | 0.012 |
Flooded vegetation | 0.00 | 0.00 |
Agriculture | 944.61 | 78.45 |
Built up | 70.89 | 5.88 |
Barren Land | 0.092 | 0.007 |
Range Land | 148.34 | 12.32 |
As shown in figure 4 LULC is prepared with Esri Sentinel-2 10m Resolution Landuse/Landcover data.
 | Figure 4: Land use Land cover Map of Shetrunji River, Gujarat, India
|
Soil map
The soil map provides details about the morphology, depth, permeability, and the capacity of soil to hold water of the soil within the watershed. These characteristics have an impact on water retention in the soil, infiltration, and groundwater recharge.
The study area which is classified into 5 types of soil majorly covered with fine soil as written in table 3
Table 3: Soil map
Type of Soil | Area (%) |
Fine | 73.45 |
Clayey | 19.69 |
Loamy | 1.39 |
Clayey Skeletal | 0.61 |
Fine Loamy | 4.87 |
The soil map is prepared from the Food and Agriculture Organization (FAO) soil database as shown if figure 5
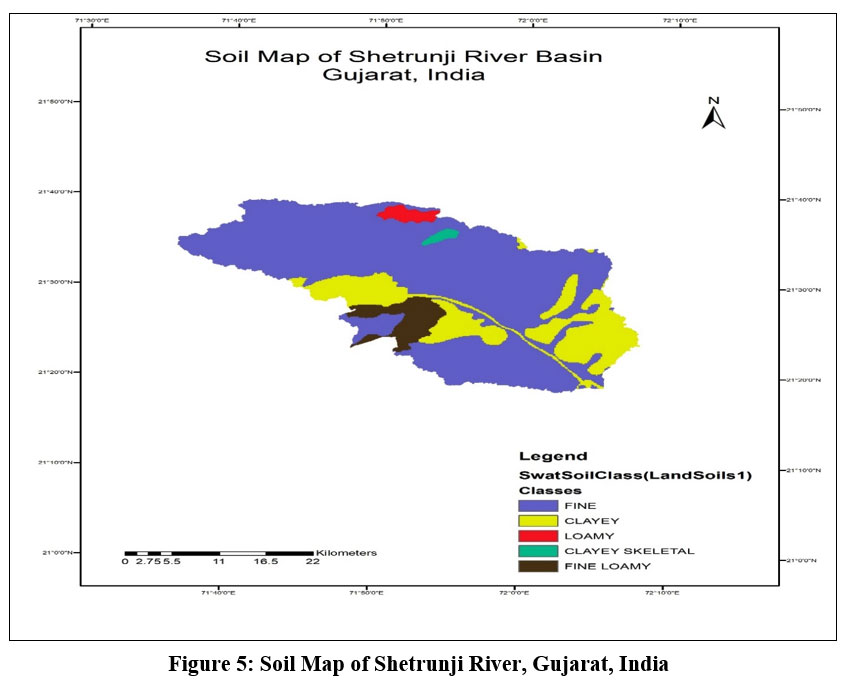 | Figure 5: Soil Map of Shetrunji River, Gujarat, India
|
Hydrological data
Weather data like highest and lowest temperature and precipitation has been sampled from SWDC (state water data centre), Gandhinagar and downloaded from NASA Power. Here 38 years of daily weather data is used.
Further the above inputs have been used for simulation of model which is explained in next consecutive sub section.
Model Setup
The model execution carries four steps to attain the result as;
Automatic Watershed delineation (2) Creation of HRUs (3) Weather files input and building tables (4) Model setup and run (Simulation)
Watershed delineation
This is the first step of modelling after setting up the project file. This step processes that DEM to produce stream networks and reaches. Contours based on elevations, Drainage channels, Pour points/Outlet points and Subbasins were also derived from the DEM in this process which is depicted in diagram below
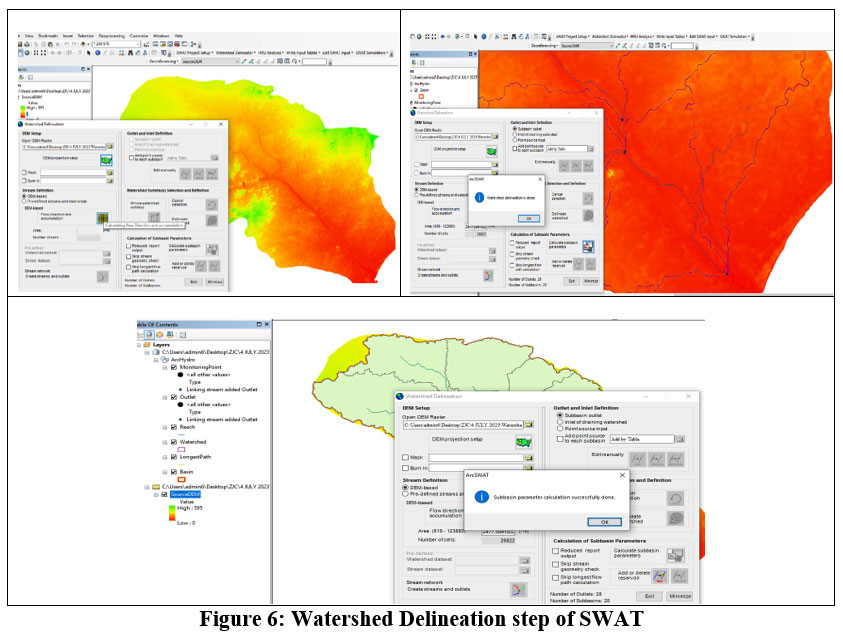 | Figure 6: Watershed Delineation step of SWAT
|
Below figure 7 shows complete delineation of Shetrunji watershed including monitoring point, outlet, reach and watershed.
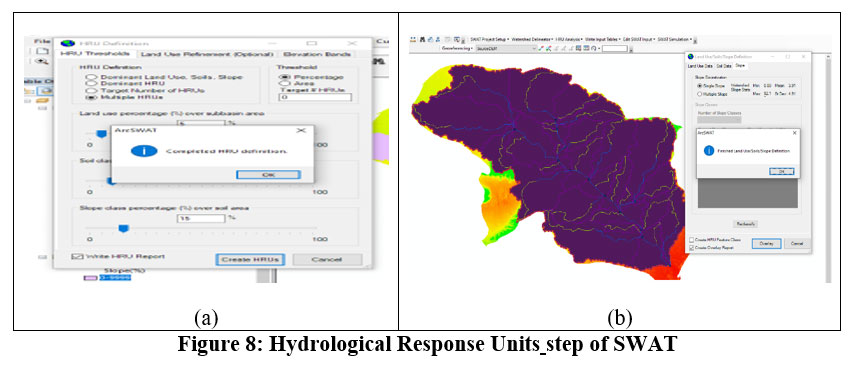
Hydrological Response Units (HRU) formation
This is successor step of watershed delineation which can be enabled once the previous step is successfully completed. In this step hydrological response units are produced which is why SWAT is said to be one of the strongest tools for hydrological modelling. The number of HRUs formed is dependent on the threshold values of land use, soil and slope chosen, as shown in figure 8(a). In the present study 173 HRUs has been formed when the threshold values of land use, soil and slope are selected as 5%, 10% and 15% respectively. As shown in figure 8(b) landuse map, soil map and slope maps are reclassified on the topography of the study area which is finally made to replicate the actual watershed by overlaying the spatial data.
 | Figure 8: Hydrological Response Units step of SWAT
|
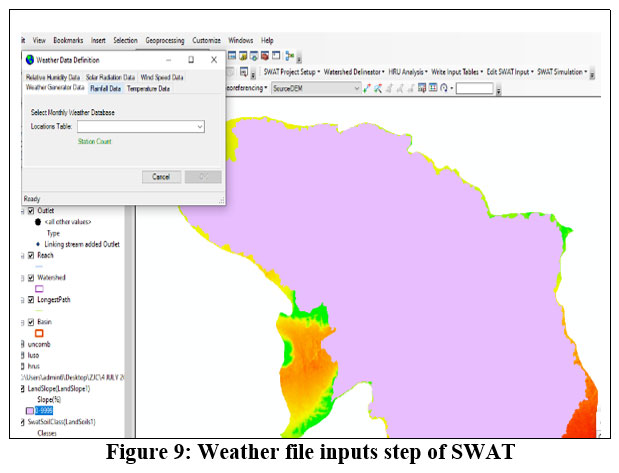
Weather files Input
Unlike the previous two steps this part of the simulation incorporates the grided files of hydrometeorological data. This step can also be performed by using the default database files available in the model itself or there is an option to add the observed file available but the simulated data would not give the promising results. The details are shown in figure 9.
 | Figure 9: Weather file inputs step of SWAT
|
Model run (Simulation)
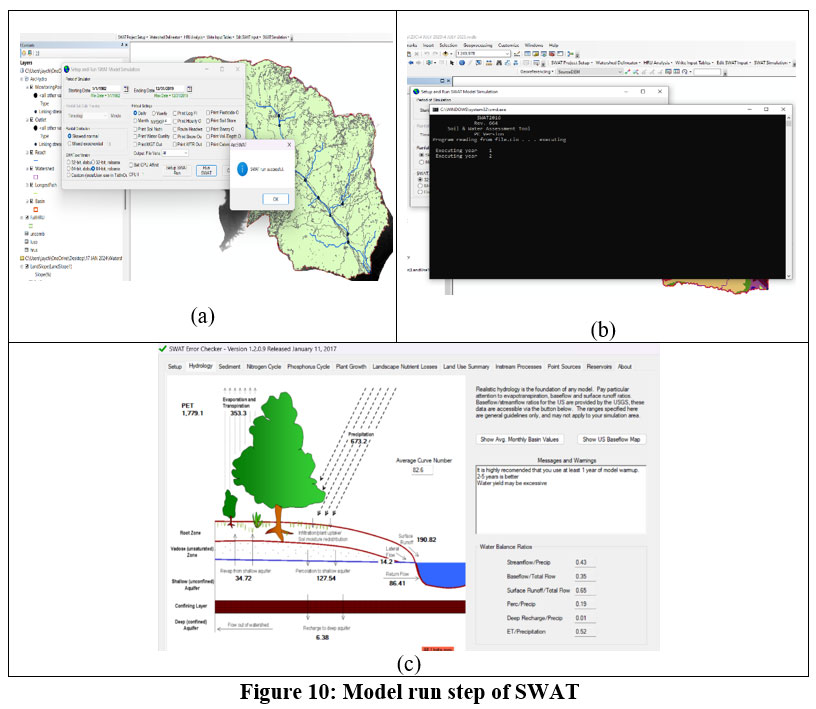
This is the final step of modelling. This step includes the selection of period of run, frequency of run, warm up years, selection of output variables and methods of skewed normal and mixed exponential as shown in figure 10 (a) based on the selection the setup of SWAT is done and model run is simulated once the command is provided. This would open pop up window that shows the model run chronological order as shown in figure 10 (b) if the run get successful the tool provides an option to save the run.
Before jumping to the outputs, SWAT provides an option to check the I/O commonly known as SWAT checker. The result of SWAT checker shows the eye-catching view of the hydrology of the watershed as shown figure 10 (c). In addition to this the SWAT also provides nitrogen cycle, phosphorous cycle, sediment, plant growth, landscape nutrient losses, instream processes, land use summary, point source and reservoirs as shown in figure 10 (c).
In this study the model run was made successful for 38 years ranging from 1982 to 2019. The analysis is done using SWAT output viewer (developed by Zhiqiang(Michal)Yu) forming the daily, monthly, seasonal and annual plots of rainfall and runoff. These details are shown and elaborated in the results and discussion section.
 | Figure 10: Model run step of SWAT
|
Based on the simulation of above model, following results have been obtained that have been elaborated in further section.
Results and Discussion
To achieve the objectives of the present study several attempts were made to make the model run successfully. The outputs shown here are the result of number of vigorous trials made with different permutations and combinations of input data. The SWAT model being too vulnerable to the formats, units and projection system was able to provide the promising results as shown in the figures below. The results are shown in the graphical format using the SWAT output viewer classified as annual, seasonal and monthly.
Annual rainfall and runoff analysis
The figure 11 shows the annual variation of runoff against the annual rainfall ranging from 1982 to 2019, revealed an average runoff depth of 190.82 mm over 38 years.
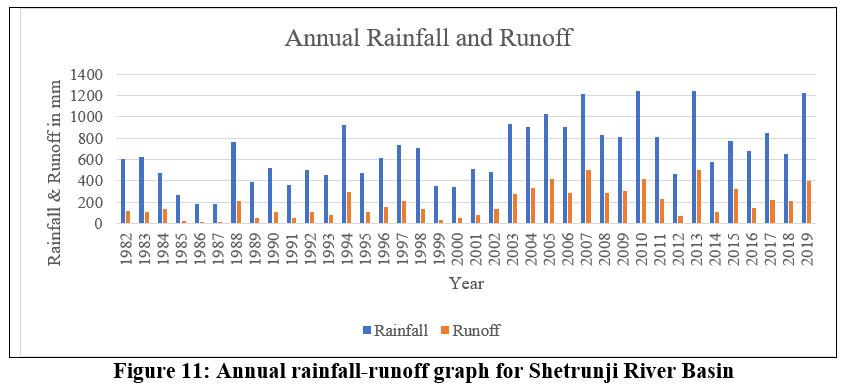 | Figure 11: Annual rainfall-runoff graph for Shetrunji River Basin
|
The substantial variation in maximum runoff during 2007 (503 mm) and minimum runoff in 1987 (2.56 mm) underscores the dynamic nature of the watershed's hydrological behavior. The graph can be interpreted as incresing gradually for both the parameters. As we can see from graph, Due to the impact of climate change, year 2003 onwards sudden change in rainfall pattern is to be observed.
Peak month rainfall and runoff analysis
Figure 12 shows the monthly variation of rainfall and runoff specifically of July and August month as they contribute the major part in the hydrological cycle.
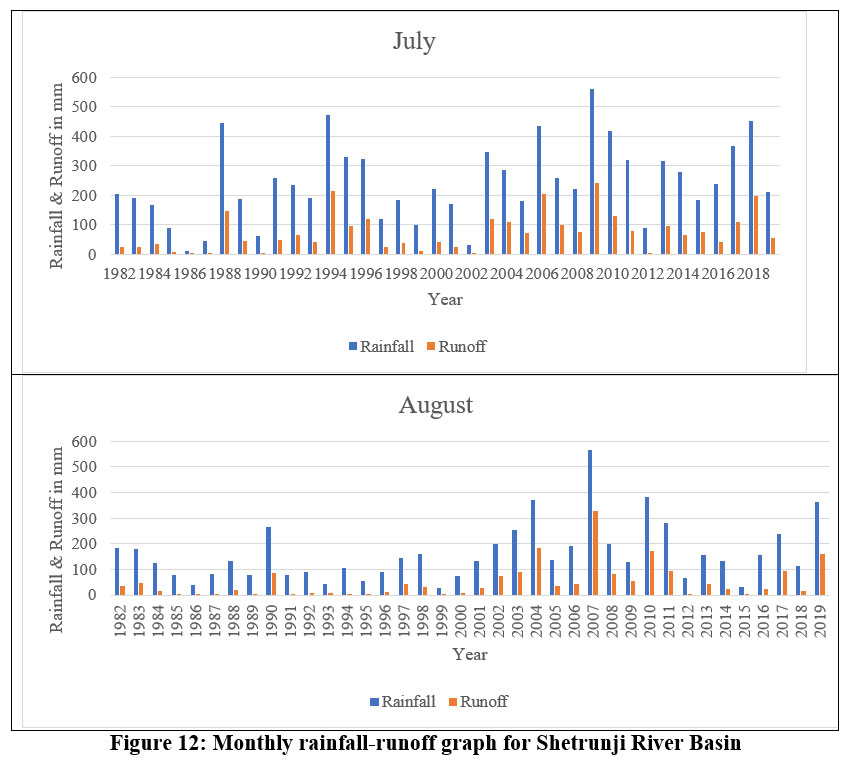 | Figure 12: Monthly rainfall-runoff graph for Shetrunji River Basin
|
In month july year 2009 was having the highest runoff of 239.71mm whereas in month august year 2007 was having the highest runoff of 327.23mm.
Sub-Basin wise runoff analysis
Figure 13 shows the basin-wise runoff analysis for Shetrunji River Basin.
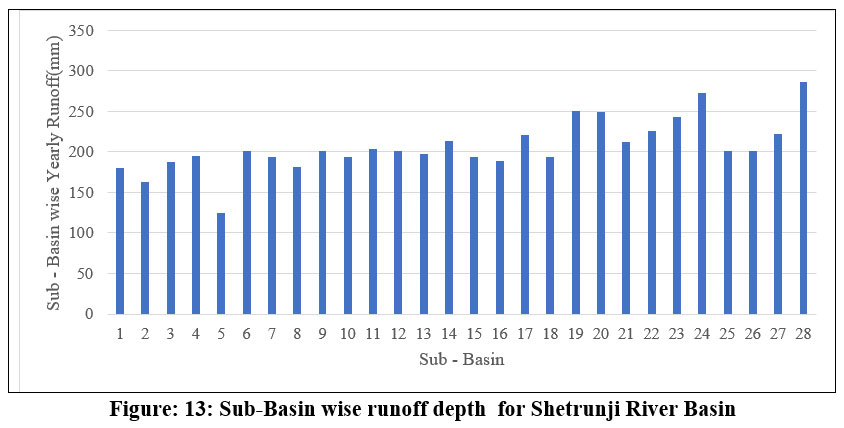 | Figure: 13: Sub-Basin wise runoff depth for Shetrunji River Basin
|
The above figure depicts the basin-wise analysis highlights sub-basins 24 and 28 as the highest contributors to runoff, indicating their susceptibility to factors promoting runoff generation. Conversely, sub-basins 5 exhibit the least runoff, potentially due to their topographical or land use characteristics.
Season wise rainfall and runoff analysis
The results have been classified into annual, seasonal and monthly graphs of which figure14 shows the seasonal variation of rainfall and runoff. The four seasons are categorised as recommended by Indian meteorological department namely Winter (January & February month), Summer (March, April & May month), Monsoon (June, July, August & September month) and Post – Monsson (October & November month). In 2002 maximum rainfall occurred in winter season as shown in figure 14(a), whereas it’s obvious to have minimal rainfall and thereby runoff as well during summer season that is depicted in figure 14(b).
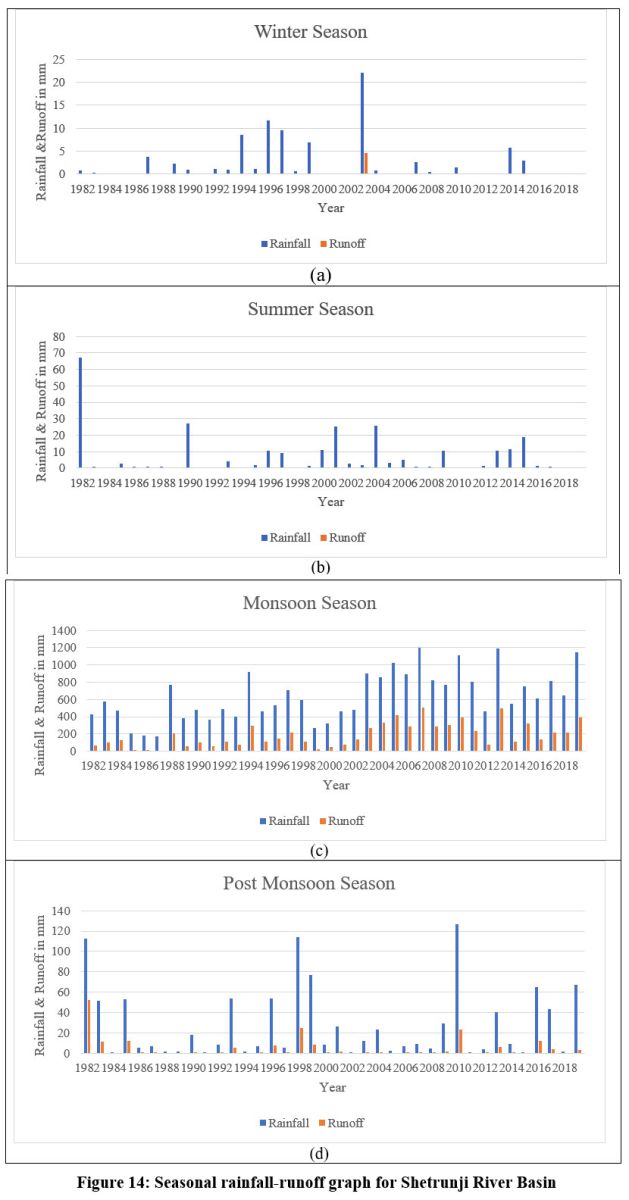 | Figure 14: Seasonal rainfall-runoff graph for Shetrunji River Basin
|
Figure 14 (c) shows the trend of rainfall and runoff during monsoon season which is naturally the major contributing season as far as the watershed is concerned. The post monsoon scenario can be visualized from figure 14(d) wherein it can be observed that during some rare occasions like year 1982, 1998, 2010, etc., the steep increase in rainfall and runoff because of climate change. On and average the runoff contributes approximately 28% of rainfall leaving the rest of the water to infiltrate along with the losses.
Conclusion
Climate change is inevitable and so is the precautions to save the mother nature for our next generations. The natural ecosystem is established in such a way that all the predators and the preys are surviving to the fullest consuming the necessary habitat. But due to the exponential increase in the human activities, afforestation, urbanisation, green house gases and carbon footprints the natural balance of the ecosystem is getting disturbed. So there exists an enormous demand to keep an account on these changes through the established techniques. This study incorporates one of such techniques called hydrological modelling to assess the influence of change in climate on the hydrology of river. The demonstration is done on one of the major tributaries of Saurashtra region of Gujarat named Shetrunji River. There are 3 tributaries on the right bank of Shetrunji river out of total 8. From the river source, the Khodiyar and Shetrunji dams are situated on Shetrunji river at 55 km and 160 km, respectively. In this study the watershed is delineated to 28 sub basins and average runoff was found to be 190.82 mm against the average rainfall of 673.15 mm for 38 years of simulation. From this study it has been observed that the runoff shows a considerable increasing trend during monsoon season. This study unveils that approximately 28.34% of the water resources have manifested as runoff over the last 38 years. The main objective of this work lies in gauging the overall water availability for precise water budgeting, while also serving as a foundation for the implementation of soil and water preservation strategies and planning of structure of entity to harvest the water within the Shetrunji River basin. The results can be made more accurate with the help of observed data which can help in performing sensitivity analysis.
Acknowledgement
The Authors are grateful to the government agencies for providing the necessary data. The work would never have been possible without the support of my supervisor Dr. Gargi Rajapara who have been in continuous support all over the time round the clock.
Funding Sources
There is no funding or financial support for this research work.
Conflict of Interest
The author(s) declares no conflict of interest.
Authors’ Contribution
Author 1(Zarna J Chovatiya) contributes to the result analysis and conclusion part of the manuscript.
Author 2(Dr. Gargi Rajapara) is my PhD Guide . She contributes to the formation of the abstract and introduction part of manuscript.
Author 3 (Dr. M.M. Shaikh) contributes for the SWAT model run.
Data Availability Statement
The manuscript includes every dataset generated or analysed during this investigation.
Ethics Statement
Not applicable
References
- Satheesh B, Ashwini B Mirajkar. SWAT Based Rainfall – Runoff Modeling of Upper Godavari Basin, India, Roorkee Water Conclave. 26-28 Feb 2020;IIT Roorkee
- R. Revathi , S. Selvakumar , V. Ravikumar , Balaji Kannan and M. Raju. Estimation of Runoff by SWAT Model in Noyyal River Basin, International Journal of Environment and Climate Change.2023; 13(10): 3672-3679 DOI: 10.9734/IJECC/2023/v13i103038
CrossRef - Waikhom Sahita I. , Yadav Vipinkumar , Hazi Md. Azamathulla, Solanki Naval Impact assessment of land use/land cover changes on surface runoff characteristics in the Shetrunji River Basin using the SWAT model. Water Practice and Technology (2023) 18 (5): 1221–1232. https://doi.org/10.2166/wpt.2023.071
CrossRef - Gassman P. W., Sadeghi A. M. & Srinivasan R. Applications of the SWAT model special section: overview and insights. Journal of Environmental Quality 2014; 43,1–8.
CrossRef - Bhadra A, Bandyopadhyay A, Singh R, Raghuwanshi NS. Rainfall-runoff modeling: comparison of two approaches with different data requirements. Water Resource Management. 2010; 24:37-62.
CrossRef - Kangsabanik Subhadip, Sneha. Rainfall-runoff modelling of Ajay river catchment using SWAT model. Earth and Environmental Science. 2017; 23:1-7.
CrossRef - Hema Narayana Reddy, Mahesh Kothari, K. S. Reddy, P. K. Singh and K. K. Yadav. Assessment of Surface Runoff using ArcSWAT for Rela Watershed, Rajasthan, India, Journal of Geography, Environment and Earth Science International. 2020;24(10): 22-32 DOI: 10.9734/JGEESI/2020/v24i1030260
CrossRef - Shaikh Mohdzuned Mohmedraffi, Lodha Pradeep, Lalwani Prashant, Mehta Darshan; “Climatic projections of Western India using global and regional climate models”. Water Practice and Technology 2022 (ESCI); https://doi.org/10.2166/wpt.2022.090
CrossRef - Anant D. Patel, Dhruvesh P. Patel, Indra Prakash. Flood modelling using HEC-RAS and geo?informatics technology in lower reaches of Shetrunji River, Gujarat, India, National Conference on Water Resources & Flood Management with special reference to Flood Modelling October 14-15, 2016; SVNIT Surat
- Paradava D. M, Rank H. D. Groundwater Resources as Influenced by Climatic Change in Shetrunji Basin of Gujarat State, India. Curr World Environ 2015;10(3) DOI:http://dx.doi.org/10.12944/CWE.10.3.31
CrossRef - Wandre S.S.*, Rank H.D & Shinde V.B.. Prioritization of Watersheds of Shetrunji River Basin Based on Morphometric Analysis Using Remote Sensing and GIS, An International Refereed, Peer reviewed & Indexed Quarterly Journal, April 2015 Volume IV, Issue XII , Multilogic in Science ISSN 2277-7601
- Arnold J. G. & Allen P. M. Estimating hydrologic budgets for three Illinois watersheds. Journal of Hydrology 1998; 176, 57–77.
CrossRef - Arnold, J.G., Srinivasan, R, Muttiah, R. & Williams. J. Large area hydrologic modeling and assessment Part I: Model development. J. of American Water Resources Association.1998; 34(1): 73–89.
CrossRef - Green, W.H., and G. Ampt. Studies of soil physics, part I – the flow of air and water through soils. Journal Agricultural Science,1911; 4, pp. 1-24.
- USDA. Estimation of direct runoff from storm rainfall. Hydrology National Engineering Handbook; 1972.
- Anant D. Patel, Prof. Dr. M. B Dholakia, Dr. Dhruvesh P. Patel, Dr. Indra Prakash. Analysis of Optimum Number of Rain Gauge in Shetrunji River Basin, Gujarat – India, International Journal of Science Technology & Engineering.2016; 2(11):380-384
- Patel DP, Nandhakumar N. Runoff potential estimation of Anjana Khadi Watershed using SWAT model in the part of lower Tapi Basin, West India. Sustainable Water Resources Management. 2016;2(1):103-118.
CrossRef - Mistry AK, Joshi BR. Rainfall runoff modelling of Shakkar River using SWAT model. International Journal of Science Technology & Engineering. 2018;4(10):49- 52.


