Comparative Study of the Coastal Geomorphology of Kajirbhati Sand-Spit Using Google Earth Pro Images (2005, 2011, 2023) and Landsat Satellite Data (2009, 2016, 2023): An Approach Towards the Impact of the Casuarina Plantation
Madhuri M. Mane1
 , Shivam J. Sapkale2
, Nilesh K. Susware3
*
and Jagdish B. Sapkale1
, Shivam J. Sapkale2
, Nilesh K. Susware3
*
and Jagdish B. Sapkale1
1
Department of Geography,
Shivaji University,
Kolhapur,
Maharashtra
India
2
Department of Chemistry,
Shivaji University,
Kolhapur,
Maharashtra
India
3
Department of Geography,
Gopal Krishna Gokhale College,
Kolhapur,
Maharashtra
India
http://dx.doi.org/10.12944/CWE.19.2.30
Copy the following to cite this article:
Mane M. M, Sapkale S. J, Susware N. K, Sapkale J. B. Comparative Study of the Coastal Geomorphology of Kajirbhati Sand-Spit Using Google Earth Pro Images (2005, 2011, 2023): An Approach Towards the Impact of the Casuarina Plantation. Curr World Environ 2024;19(2). DOI:http://dx.doi.org/10.12944/CWE.19.2.30
Copy the following to cite this URL:
Mane M. M, Sapkale S. J, Susware N. K, Sapkale J. B. Comparative Study of the Coastal Geomorphology of Kajirbhati Sand-Spit Using Google Earth Pro Images (2005, 2011, 2023): An Approach Towards the Impact of the Casuarina Plantation. Curr World Environ 2024;19(2).
Download article (pdf) Citation Manager Publish History

Introduction
Coastal geomorphology is the study of how the shape of the shore has changed over time due to wind, waves, currents, and fluctuations in sea level.1 It is an essential branch of physical geography. Coastal geomorphology is the scientific study of the processes that shape the physical characteristics of Earth's coastlines. It explores the dynamic interactions between land, sea, and atmosphere and spans various disciplines, including geography, meteorology, oceanography, and geology. The goal of coastal geomorphologists is to understand the processes that lead to the formation of coastal landforms and their development and changes. 2,3,4 The cross shore movement of the sediments are found in the Coastal gemophology.5,6 Coastal geomorphology includes various landforms/categories, such as the Swash zone, Berm Line, Estuary, Casuarina Plantation, Mangroves, Mudflats, and Spit. These landforms are created by erosional and depositional processes. Understanding coastal geomorphology is crucial for sustainable development, hazard assessment, coastal management, and ecosystem protection. Human activities such as urbanization, coastal infrastructure development, and climate change can significantly impact coastal environments, leading to erosion, flooding, habitat loss, and other environmental problems. 7,8,9 In recent years, shorelines have been changed due to construction and development. These changes have increased the need for reliable methods to assess the risks in coastal regions. Over the past decade, coastal geomorphology has undergone an unusual stage in its evolution. Rapid progress in field logistics and instrumentation, computing power, applications, and increased scientific globalization has validated and challenged established theories. 10 The swash zone is a critical feature in the study of coastal geomorphology. It refers to the area where waves absorb or reflect energy, influencing whether sediment will be retained on the upper beach or returned to the inner surf zone. The swash zone significantly impacts nearshore hydrodynamics and morphodynamics, characterized by active beach accretion and erosion. This area often requires beach preservation techniques such as sand nourishment.11,12,13 The swash zone is very important feature in the coastal geomorphic study in that area sediment is dynamically changed.14,15,16,17 The swash zone is a sediment transport and depositional zone determined by beach morphology, sediment characteristics, and hydrodynamics. 12,15 In the attempted research, a detailed geomorphological map was carefully prepared to accurately depict the intricate changes in the physical features of the landscape. Geomorphological maps serve as invaluable tools in comprehending the multifaceted nature of the Earth's surface. They offer an unbiased and comprehensive depiction of landforms, encompassing specific nomenclature, shapes, and symbols. Furthermore, these maps provide intricate spatial information about the dimensions, slope, curvature, and relief of landforms. They also shed light on genetic agents' origin and evolutionary processes that have shaped the landforms over time.
Remote sensing techniques are widely used to understand coastal landscapes. These techniques enable studying sediment dynamic processes on barrier islands, beaches, dunes, and deltas, as well as coastal processes in erosional landscapes such as rocky cliffs. They also help understand the forcing mechanisms of coastal processes, such as waves, tides, and currents, and in studying coastal geomorphology and evolution. Remote sensing technologies like optical, radar, and LiDAR, as well as close-range applications like webcams, site cameras, and UAVs or planes, provide essential data for accurate and highly spatiotemporal analysis of the coastal environment.18, 19, 20, 21, 22, 23, 24 LiDAR survey technology is highly beneficial for comprehending the changes in coastal landforms within the swash zone. The primary objective of conducting a LiDAR survey is to gain insight into the low tide swash zone while considering varying wave conditions.25, 26, 27, 28 The attempted study utilized high-resolution images from Google Earth Pro and Landsat satellite to analyze the changes in the coastal landscape and to assess the influence of the Casuarina Plantation at Kajirbhati.
Study Area
Kajirbhati sand spit is located in Nevare village, 25 kilometers from Ratnagiri and 6 kilometers from Ganpatipule bus stand. It is situated between Ganpatipule and Ratnagiri on the Konkan coast of Maharashtra (Fig 1). The entire spit of Kajirbhati is covered with Casuarina plantations. The backdrop of swaying palm trees and steep rocks adds to the breathtaking charm of Kajirbhati Beach. The area extends from 73°16’33.699” E to 73°17’06’.042” E longitudes and 17°05’56.193” N to 17°06’51.183” N latitudes, covering an area of 1.80 km2 as Kajirbhati sand spit.
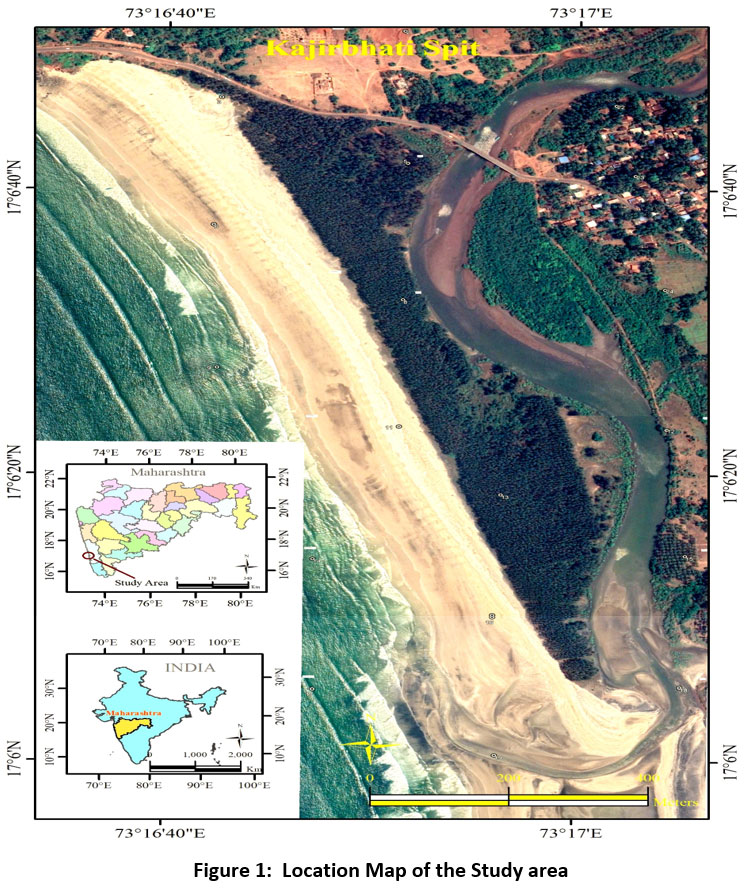 | Figure 1: Location Map of the Study area
|
Methodology
The main objective of the research is to study the coastal geomorphology of the Kajirbhati sand spit through remote sensing data. The entire methodology was divided into two parts. The first part is based on Google Earth Pro images, which can be used for manual digitization to identify the coastal geomorphic classes. The Google Earth Pro color images for 2005, 2013, and 2023 were utilized. The data available on Google Earth Pro was from 2005, so it was considered the base year. Around 13 Google Earth Pro images were downloaded for each year, and then they were georeferenced individually using reference points added at the time of downloading the images in Google Earth Pro. All images were merged into one final image to digitize coastal geomorphology classes and further analysis. The ArcGIS software platform was used to create all the maps.
The study includes various land classes, such as Agricultural land, Swash zone, burm line, Casuarina Plantation, Estuary, Mangroves, Mudflat, Open Land, Coconut Plantation, Sea Water, Settlement, Sand dune on sand spit, and Vegetation, for the years 2005, 2011, and 2023. The area for each class was calculated in square kilometers to create a table.
The second part of the methodology involved using satellite images. The analysis used Erdas Imagine software to calculate the images' Normalized Difference Vegetation Index (NDVI). Landsat series data was chosen for this analysis due to its free availability, open data format in Geotiff file format, multi-spectral nature with various bands (Blue, Green, Red, infrared, etc.), and an optimal spatial resolution of 30m. Landsat images can be downloaded for any location on Earth from USGS 29. Many research activities utilize Landsat satellite datasets.
The analysis focused on studying the intensity of Normalized Difference Vegetation Index (NDVI) values at Kajirbhati spit throughout 2009, 2016, and 2023 using Landsat data. The specific details are outlined in Table 1. The images utilized for the analysis are from Landsat 5 (2009), Landsat 8 (2016), and Landsat 9 (2023), all with a spatial resolution of 30 meters. The NDVI calculations used false color composite (FCC) images and the respective formula.30
NDVI = (NIR – RED) / (NIR + RED) …………………. ……………….(1)
In remote sensing and environmental research, the Normalized Difference Vegetation Index (NDVI) is a widely used metric for measuring and tracking the density and health of vegetation. NASA scientists Compton Tucker and Darrel Williams introduced NDVI in the early 1970s, and since then, it has become an essential tool for evaluating the dynamics of terrestrial vegetation globally. NDVI relies on healthy vegetation reflecting a significant amount of near-infrared (NIR) light and absorbing the most visible light (mainly in the red spectrum) for photosynthesis. Conversely, surfaces devoid of vegetation, such as dirt or water, typically absorb more near-infrared light and reflect more visible light. By measuring these variations in reflectance, NDVI calculates a numerical representation of the density and vigor of the plant. It produces values ranging from +1 to -1 in the image. Positive values represent healthy vegetation, negative values represent water bodies, and 0 indicates bare land in the image.
Kajirbhati spit covered the Casuarina Plantation. The intensity of the spit was calculated using the NDVI for the years 2009, 2016, and 2023.
Table 1: Landsat Series Satellite data used for NDVI calculations.
Sr. No. | Satellite Mission | Acquire Date | Image Availability | Path | Row | Spatial Resolutions | Temporal Resolutions | Spectral Resolution |
1 | Landsat -5 (TM) | 22 March 2009 | 1984- 2013 | 147 | 48 | 30m | 16 Days | R, G, B, NIR, |
2 | Landsat - 8 | 26 April 2016 | 2013 - Present | 147 | 48 | 30m | 16 Days | R, G, B, NIR, |
3 | Landsat- 9 | 24 May 2023 | 2022 – Present | 147 | 48 | 30m | 16 Days | R, G, B, NIR, |
Results and Discussions
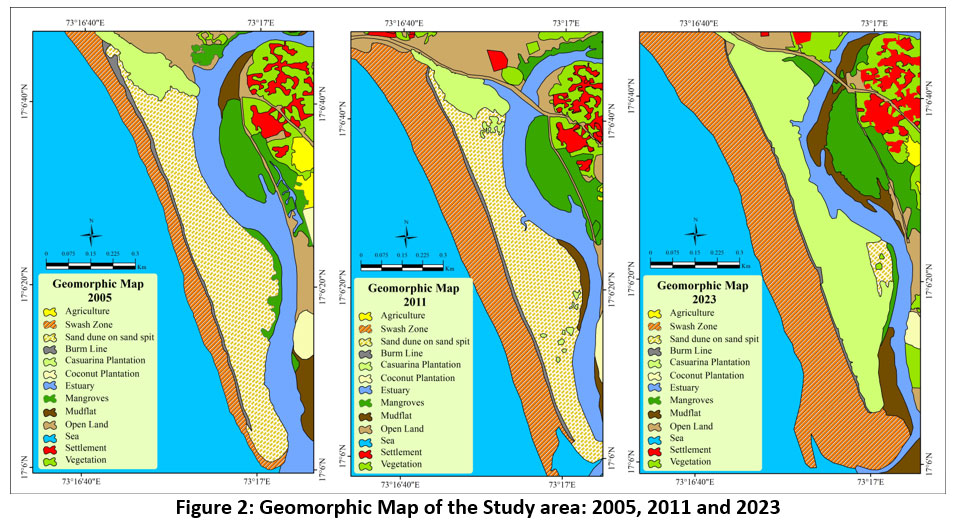
The primary aim of this research paper is to analyze the minute-scale changes in geomorphology classes within the specified study area. High-resolution images from Google Earth Pro software for 2005, 2011, and 2023 were carefully examined to achieve this objective. The process involved digitizing 13 major geomorphic classes to document their spatial distribution and changes over time accurately. The sophisticated ArcGIS software was employed for the final mapping and precise calculation of the areas occupied by each geomorphic class. The findings, including detailed changes in geomorphic classes, are illustrated in Figure 2 and summarized in Table 2.
The line graph in Figure 3 visually represents the changes in all classes from 2005 to 2011 to 2023. We were able to gain some insight into the spit's shifting, although not all morphological classes could be distinguished. Landsat satellite data has proven to be particularly valuable in helping us understand the spit's movements. This data has allowed us to track and analyze the spit's formation and movement changes over time, providing valuable information for our research and analysis. During this time frame, the agricultural area experienced minimal fluctuations. This area cultivates various essential vegetables, including Dolichos Bean, Chilli, Coriander, Tomato, Cucumber, Snake Gourd, Drumstick, Ridge Gourd, and Wal. The Konkan region witnessed a significant surge in agricultural activities from January to May, focusing on cultivating diverse crops well-suited to the region's unique soil and climate conditions. Additionally, the swash zone within the study area is observed to be highly impacted annually.
The estuarine area has decreased from 2005 to 2023 due to sedimentation and human interference. In contrast, the area covered by mangroves has increased. In 2005, the mangrove area was 4.07%, which grew to 8.10% in 2011 and 9.86% in 2023. This positive change is attributed to the efforts of farmers and the local community, who are now actively protecting the mangroves. Additionally, the Casuarina Plantation helps shield the mangroves from solid winds. The local government has also organized various social activities to promote the protection and plantation of mangroves in the study area. Mangroves are crucial ecosystems that support diverse species, contribute to shoreline stability, and sequester carbon.31, 32
The mangrove habitats are crucial for the survival of various species, including birds, fish, crabs, shellfish, and sea turtles. These habitats provide a safe haven and serve as nesting, breeding, and birthing places for the diverse local fauna. In addition to supporting wildlife, mangroves are of great importance to humans as they offer numerous benefits. The mudflats in this area exhibit a diverse topography, ranging from centimeters to meters, created by mud bars, crab burrows, and drainage creeks. The upper zone of the tidal flats consists of mud flats formed by settling suspended sediment, primarily composed of sortable silts due to depositional processes. This unique ecosystem plays a crucial role in supporting various life forms and maintaining the overall ecological balance.
It has been observed that the percentage of the Mudflat area was 4.3 in the year 2023 and 1.77 in the year 2005. Mudflats are found in protected, low-energy coastal habitats such as estuaries, where fine silts and clays settle to form them. They play a crucial role in coastal protection by absorbing wave energy. Mudflats also support high biological productivity due to the abundance of invertebrates like sandhoppers, lugworms, ragworms, cockles, and Hydrobiid snails, which in turn support significant populations of migratory and wintering birds of global importance. Additionally, mudflats serve as crucial fish spawning grounds for species like plaice.33
The plantation of coconuts and areca nut areas has been increasing yearly. The area has doubled from 2005 to 2023. Farmers are benefitting from this plantation. In addition to its symbolic meaning in culture, the coconut tree is an essential ecological species in island and coastal ecosystems. Its extensive root system helps stabilize sandy soils, prevent erosion, and protect beaches from storms and waves. Furthermore, various birds, insects, and small animal species find habitat in the thick vegetation.34 Over the study period from 2005 to 2023, the seawater area within the study site has experienced a decline in coverage (i.e. considered occupied area of image). Specifically, the percentage of seawater area decreased from 45.89% in 2005 to 31.21% in 2011 and further to 27.65% in 2023. This significant reduction highlights the dynamic changes within the study area over time.
 |
|
Table 2: Comparison Values of Geomorphic Class for year 2005, 2011 and 2023.
Area in Sq. Km. | Area in % | Area in Sq. Km. | Area in % | Area in Sq. Km. | Area in % | |
Class Name / Years | 2005 | 2011 | 2023 | |||
Agriculture | 0.115 | 6.37 | 0.167 | 9.256 | 0.111 | 6.150 |
Burm Line | 0.016 | 0.91 | 0.008 | 0.447 | 0.008 | 0.443 |
Casuarina Plantation | 0.032 | 1.75 | 0.039 | 2.161 | 0.189 | 10.493 |
Estuary | 0.186 | 10.33 | 0.138 | 7.658 | 0.191 | 10.579 |
Mangroves | 0.073 | 4.07 | 0.126 | 6.993 | 0.168 | 9.307 |
Mud flat | 0.032 | 1.77 | 0.020 | 1.081 | 0.079 | 4.349 |
Open land | 0.133 | 7.36 | 0.124 | 6.874 | 0.084 | 4.676 |
Coconut Plantation | 0.021 | 1.17 | 0.027 | 1.509 | 0.011 | 0.604 |
Sand dune on sand spit | 0.216 | 11.96 | 0.310 | 17.186 | 0.009 | 0.499 |
Sea | 0.828 | 45.89 | 0.513 | 28.445 | 0.505 | 27.989 |
Settlement | 0.025 | 1.41 | 0.044 | 2.413 | 0.053 | 2.936 |
Swash zone | 0.063 | 3.50 | 0.201 | 11.136 | 0.312 | 17.285 |
Vegetation | 0.063 | 3.49 | 0.088 | 4.867 | 0.085 | 4.709 |
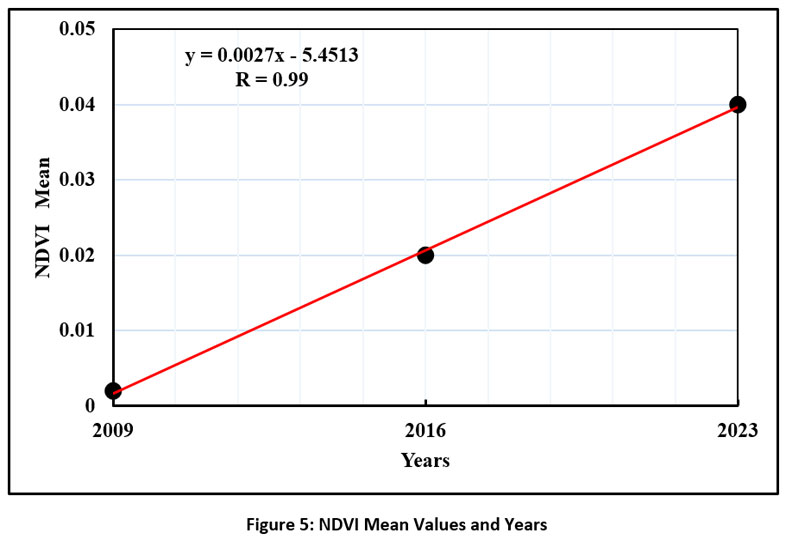
The changes in the Casuarina Plantation are shown in Figure 4. To analyze these changes thoroughly, we used Landsat 5, 8, and 9 data to assess the intensity of NDVI values in the study area in 2009, 2016, and 2023. NDVI is a crucial indicator of the overall health of the Casuarina plants, with healthy vegetation yielding positive values in the image. The mean NDVI values for 2009, 2016, and 2023 were -0.002, 0.02, and 0.04, respectively. There were significant changes in higher and lower values across these years, with the former changing from -0.10 in 2009 to 0.28 in 2023 and the latter from -0.10 in 2009 to -0.07 in 2023. These findings strongly suggest that the Casuarina plantation has expanded substantially during this period. Additionally, it is essential to highlight the invaluable role of Casuarina plants in protecting the coast from high-speed winds and dynamic sea waves. Their healthy presence has also been instrumental in safeguarding Mudflat, Mangroves, Settlements, and Estuary land use and land cover classes
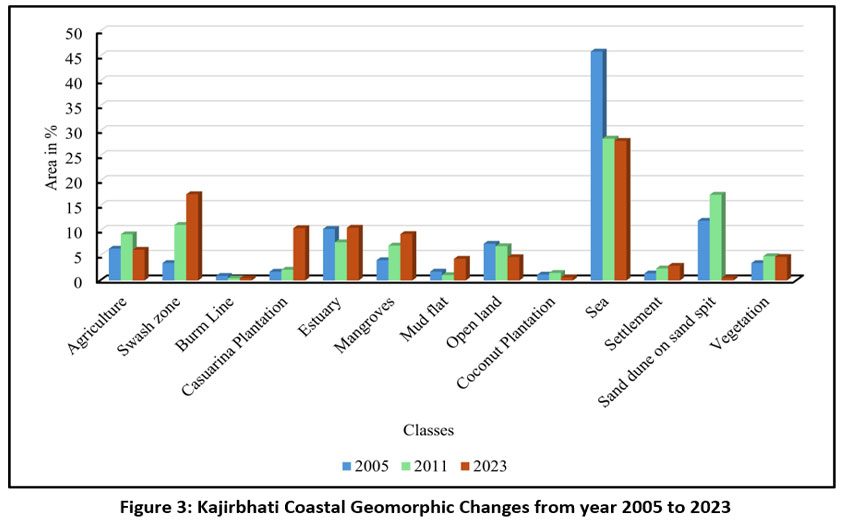 | Figure 3: Kajirbhati Coastal Geomorphic Changes from year 2005 to 2023
|
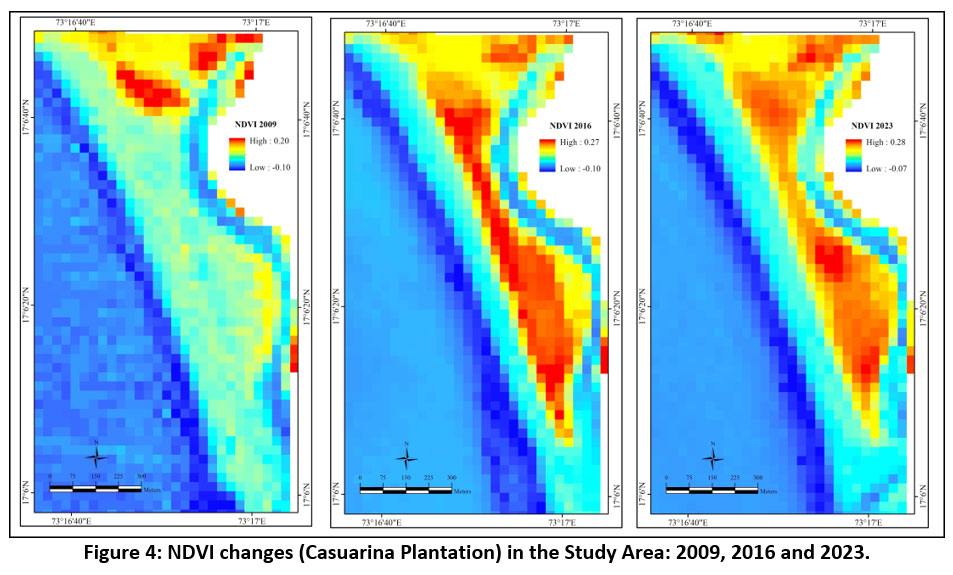 | Figure 4: NDVI changes (Casuarina Plantation) in the Study Area: 2009, 2016 and 2023.
|
 | Figure 5: NDVI Mean Values and Years
|
Figure 5 represents the statistic of NDVI Mean values against the years 2009, 2011, and 2023. For this analysis, NDVI was calculated with its mean values for each year, and the correlation between NDVI mean values and years was calculated. The correlation is positively correlated, with R values of 0.99. It clearly indicates that the Casuarina Plantation is increasing day by day in becoming years. It protects the environment and coastal geomorphic features of the study area.
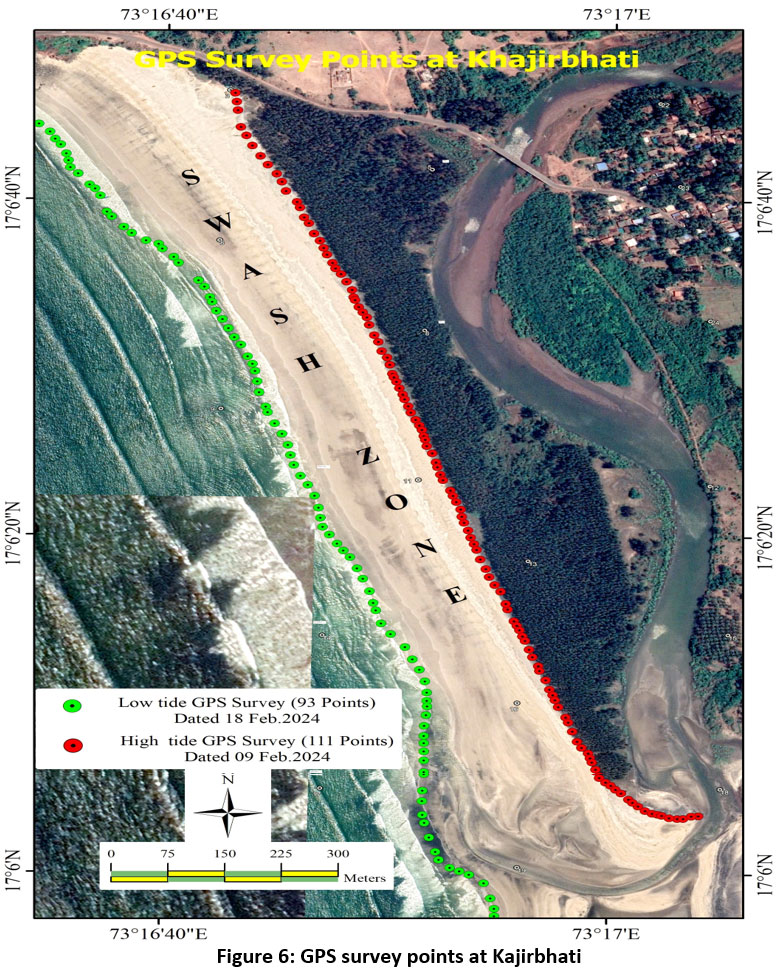
The swash zone is a dynamic coastal geomorphic feature in the area. Field surveys were conducted at Kajirbhati to measure the swash zone in the study area. Two major GPS surveys were carried out on February 9, 2024, and February 18, 2024, using the Montana 650 Garmin GPS. The best positions at high tide and low tide were recorded. Around 111 points were taken at the highest tide, and 93 points were recorded at the lowest. Figure 6 shows the swash zone in the Kajirbhati area. The average length of the swash zone is approximately 200 to 225 meters.
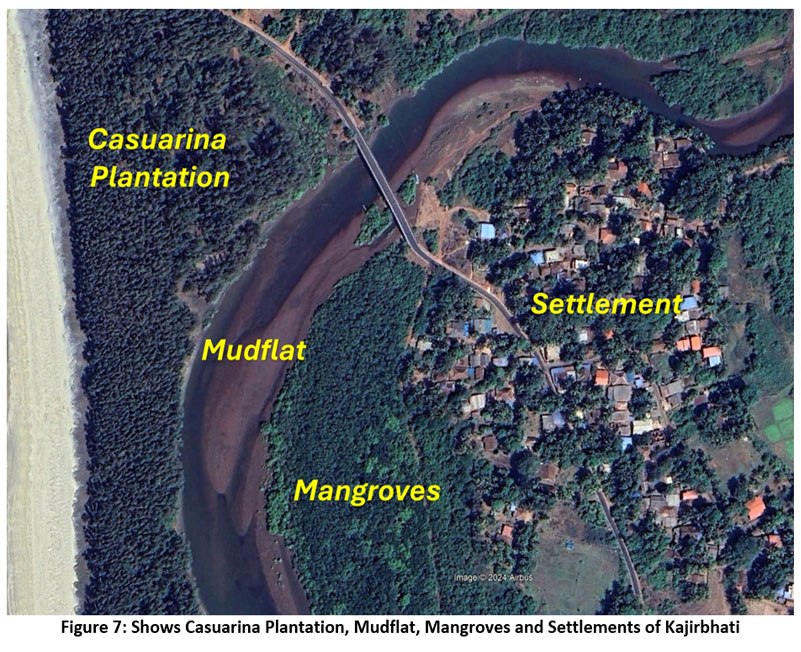
The exposed part of dunes in the sand spit region decreased due to the planting of Casuarina trees. In 2005, the coverage was 11.96%, which increased to 17.18% in 2011 and then reduced to 0.499% in 2023, indicating a change in the area's classification. The Casuarina plantation replaced the dunes in the land cover class. The Burm line mostly stayed the same from 2005 to 2023. The settlement area of Kajirbhati increased significantly during this period, from 1.41% in 2005 to 2.93% in 2023. The healthy Casuarina vegetation protects the settlement from strong winds and sea waves. Figure 7 Shows Casuarina Plantation, Mudflat, Mangroves and Settlements of Kajirbhati spit.
 | Figure 6: GPS survey points at Kajirbhati
|
 | Figure 7: Shows Casuarina Plantation, Mudflat, Mangroves and Settlements of Kajirbhati
|
Conclusion
The research outcome has shown that creating a detailed geomorphological map accurately represents changes in the physical features of the landscape. Geomorphological maps offer comprehensive depictions of landforms, including spatial information about dimensions, slope, curvature, and relief. They also reveal the origin and evolutionary processes that have shaped the landforms. This type of data, which shows changes over a decade, is helpful for disaster management. We used advanced techniques, various GIS-based layers, and remote sensing data to create a geomorphic map that plays a crucial role in this study. It has also been observed that the impact of coastal disasters has accelerated due to more frequent and intense cyclones, tidal impacts, and expected rising sea levels. In order to monitor any damages to the coast, data is gathered from the shoreline regarding the condition of the landforms in the area. Storm surges can cause rivers, estuaries, and creeks to carry inundation to low-lying inland areas, damaging valuable coastal environments. The study aimed to analyze the decadal variations in coastal landforms in and around the coastal areas of Kajirbhati. The study's findings in terms of the decadal variations in various geomorphic characteristics reveal that the size, shape, and characteristics of sand spits, sand bars, and beaches are primarily influenced by factors such as the type and availability of sand and sediments, wind speed and direction, sea waves, and currents.
Besides that, the focus was on conducting an in-depth analysis of the effects of the Casuarina plantation on the coastal sand dunes of Kajirbhati spit. The research on the casuarina plantation and the coastal geomorphology of Kajirbhati spit has provided valuable new insights into the dynamic nature of coastal habitats and the effectiveness of vegetation in reducing erosion. The analysis of Landsat satellite data from 2009, 2016, and 2023, as well as Google Earth Pro images from 2005, 2011, and 2023, has revealed significant changes in the morphology of Kajirbhati spit over time. These changes, including the spit's length, breadth, and shape, indicate ongoing sediment transport, accretion, and erosion processes.
The analysis also demonstrates the impact of human interventions, particularly the introduction of the Casuarina plantation. The quantitative data provided by the Landsat satellite made the assessment and evaluation of vegetation cover, changes in land use, and coastal dynamics possible in the study area. The analysis of these data sets shows reduced erosion rates and increased vegetation density around the planted region, supporting the association between Casuarina plantation and spit stabilization.
In conclusion, the combination of Landsat satellite data and Google Earth Pro imagery offers a comprehensive understanding of the coastal geomorphic history of Kajirbhati spit and the impact of the Casuarina plantation. These findings underscore the importance of strategically implementing plant cover in sustainable coastal management strategies to protect sensitive coastal habitats from natural hazards such as erosion. However, further study and monitoring are recommended to assess such treatments' long-term effectiveness and support evidence-based coastal management methods.
Acknowledgment
The authors thank the Department of Geography at Shivaji University in Kolhapur, Maharashtra, for providing the GIS laboratory equipment, including remote sensing software such as ArcGIS and Erdas Imagine. They also thank the U.S. Geological Survey (USGS), Denver, for providing free downloadable Landsat satellite data.
Funding Sources
The author(s) received no financial support for the research, authorship, and/or publication of this article.
Conflict of Interest
The authors do not have any conflict of interest
Data Availability Statement
The manuscript incorporates all datasets produced or examined throughout this research study.
Ethics Statement
This research did not involve human participants, animal subjects, or any material that requires ethical approval.
Authors’ Contribution
This work is carried out in collaboration between Four authors.
First Author: Madhuri Mane –Developed the theoretical framework and literature review
Second Author: Shivam Sapkale – Editing, writing and proofreading.
Third Author: Dr. Nilesh Susware – Worked on Satellite Image processing and downloading data set and Map Making
Fourth Author: Dr. Jagdish Sapkale- Final version of the manuscript and supervised the analysis of satellite data outputs.
References
- Rao, M. J., Greeshma, G. A.G., Avatharam, P., Anil, N.C. and Karudu, K. T. Studies on Coastal Geomorphology along Visakhapatnam to Bhimunipatnam, East Coast of India. J. Ind. Geophys. Union, 2021; 16 (4), 179-187.
- Haslett, S.K. Coastal systems, London: Routledge, 2000
CrossRef - Bryant, E. Tsunami: the underrated hazard Cambridge: Cambridge University Press, 2001.
- Woodroffe, C.D. Coasts: form, Processand Evolution. Cambridge: Cambridge UniversityPress, 2003.
CrossRef - Butt, T. and Russell, P. Hydrodynamics and cross-shore sediment transport in the swash zone of natural beaches: a review. Journal of Coastal Research, 2000; 16, 255–68.
- Jackson, N.L., Nordstrom, K.F., Eliot, I. and Masselink, G. Low energy’ sandy beaches in marine and estuarine environments: a review. Geomorphology, 2002; 48, 147–62.
CrossRef - Bird, E. Coastal geomorphology; an introduction. New York: John Wiley and Sons, 2000.
- Mastronuzzi, G. and Sanso, P. Holocene coastal dune development and environmentalchanges in Apulia (southern Italy). Sedimentary Geology, 2002; 150, 139–52.
CrossRef - Masselink, G. and Hughes, M.G. Introduction to coastal processes and geomorphology.London: Oxford University Press, 2003.
- Stephenson, W.J., and Brander R. W. Coastal geomorphology into the twenty-first century. Progress in Physical Geography, 2003; 27 (4) 607–623.
CrossRef - Chen, W., Werf, J. J. V. D., Hulscher, S.J.M.H. A review of practical models of sand transport in the swash zone. Earth-Science Reviews, 2023; 238, 1-17.
CrossRef - Puleo, J.A., Cristaudo, D., Torres-Freyermuth, A., Masselink, G., Shi, F.The role of alongshore flows on inner surf and swash zone hydrodynamics on a dissipativebeach. Cont. Shelf Res. 2020: 201, 104134.
CrossRef - Puleo, J.A., Beach, R.A., Holman, R.A., Allen, J.S. Swash zone sediment suspension and transport and the importance of bore-generated turbulence.J. Geophys. Resources,2000; Ocean. 105, 17021–17044.
CrossRef - Peregrine, D.H., Williams, S.M. Swash overtopping a truncated plane beach.J. Fluid Mech, 2001; 440, 391–399.
CrossRef - Miles, J., Butt, T., Russell, P. Swash zone sediment dynamics: a comparison of adissipative and an intermediate beach. Mar. Geol,2006: 231, 181–200.
CrossRef - Masselink, G., Puleo, J.A. Swash-zone morpho dynamics. Cont. Shelf Res, 2006; 26,661–680.
CrossRef - Chardon-Maldonado, P., Pintado-Patino, J.C., Puleo, J.A. Advances in swash-zone research: small-scale hydrodynamic and sediment transport processes, Coast. Eng,2016; 115, 8–25.
CrossRef - Ai, B., Huang, K., Zhao, J., Sun, S.; Jian, Z., Liu, X. Comparison of Classification Algorithms for Detecting Typical Coastal Reclamation in Guangdong Province with Landsat 8 and Sentinel 2 Images. Remote Sens, 2022: 14, 385.
CrossRef - Cruz, C.; O Connell, J.; McGuinness, K.; Martin, J.R.; Perrin, P.M.; Connolly, J. Assessing the effectiveness of UAV data for accurate coastal dune habitat mapping. Eur. J. Remote Sens. 2023, 56, 2191870.
CrossRef - Vitousek, S.; Buscombe, D.; Vos, K.; Barnard, P.; Ritchie, A.; Warrick, J. The future of coastal monitoring through satellite remote sensing. Camb. Prism. Coast. Futures, 2021; 1, E10.
CrossRef - Vos, K.; Harley, M.D.; Turner, I.L.; Splinter, K.D. Pacific shoreline erosion and accretion patterns controlled by El Niño/Southern Oscillation. Nat. Geosci., 2023; 16, 140–146.
CrossRef - Kim, Y.J.; Han, D.; Jang, E.; Im, J.; Sung, T. Remote sensing of sea surface salinity: Challenges and research directions. GIScience Remote Sensing,2023; 60, 2166377.
CrossRef - Almar, R.; Bergsma, E.W.J.; Brodie, K.L.; Bak, A.S.; Artigues, S.; Lemai-Chenevier, S.; Cesbron, G.; Delvit, J.-M. Coastal Topo- Bathymetry from a Single-Pass Satellite Video: Insights in Space-Videos for Coastal Monitoring at Duck Beach (NC, USA). Remote Sensing, 2022; 14, 1529.
CrossRef - Shahtakhtinskiy, A., Khan, S.D., Rojas, S.S. Quantifying the Impact of Hurricane Harvey onBeach?Dune Systems of the Central Texas Coast and Monitoring Their Changes Using UAV Photogrammetry. Remote Sens. 2023; 15, 5779.
CrossRef - Almeida, L.P., Almar, R., Blenkinsopp, C., Senechal, N., Bergsma, E., Floc’h, F., Caulet, C., Biausque, M., Marchesiello, P., Grandjean, P., Ammann, J., Benshila, R., Thuan, D.H., da Silva, P.G., Viet, N.T. Lidar observations of the swash zone of a low-tide terraced tropical beach under variable wave conditions: The Nha Trang (Vietnam) COASTVAR experiment. J. Mar. Sci. Eng.,2020; 8, 302.
CrossRef - Paine, J.G. Caudle, T.L. Andrews, J.R. Shoreline and Sand Storage Dynamics from Annual Airborne LIDAR Surveys, Texas Gulf Coast. J. Coast. Res. 2017; 33, 487–506.
CrossRef - Caudle, T.L. Paine, J.G. Andrews, J.R. Saylam, K. Beach, Dune, and Nearshore Analysis of Southern Texas Gulf Coast Using Chiroptera LIDAR and Imaging System. J. Coast. Res. 2019; 35, 251–268.
CrossRef - Zhou, G.; Xie, M. Coastal 3-D Morphological Change Analysis Using LiDAR Series Data: A Case Study of Assateague Island National Seashore. J. Coast. Res. 2009: 25, 435–447.
CrossRef - www.usgs.gov
- Kriegler, F.J., Malila, W.A., Nalepka, R.F. and Richardson, W. Preprocessingtransformations and their effect on multispectral recognition, in: Proceedings of the sixth International Symposium on Remote Sensing of Environment, University of Michigan, Ann Arbor, MI, 1969; 97-131
- Liu,X. Liu, H. Chen, L. Wang, X., Ecological interception effect of mangroves onmicroplastics, J. Hazard Mater. 2022; 423, 127231.
CrossRef - Valsan, G., Paul M. M., Warrier A. K., Vasudeva M., Unnikrishnan V. K., Prabhu S. Spatiotemporal variations of microplastics in the surface sediments of a tropical mangrove ecosystem in south-western India. Case Studies in Chemical and Environmental Engineering, 2024; 9, 1-8.
CrossRef - https://www.buglife.org.uk/advice-and-publications/advice-on-managing-bap-habitats/mudflat
- growbilliontrees.com


