Combined Economic Emission Dispatch including Variable Energy Resources
Soudamini Behera1
*
 , Ajit Kumar Barisal2
, Sasmita Behera3
and Dilip Kumar Bagal1
, Ajit Kumar Barisal2
, Sasmita Behera3
and Dilip Kumar Bagal1
1
Department of Electrical Engineering,
Government College of Engineering,
Kalahandi, Biju Patnaik University of Technology,
Bhawanipatna,
Odisha
India
2
Department of Electrical Engineering,
Odisha University of Technology and Research,
Bhubaneswar,
Odisha
India
3
Department of Electrical Engineering,
Veer Surendra Sai University of Technology,
Burla, Sambalpur,
Odisha
India
http://dx.doi.org/10.12944/CWE.19.2.26
Copy the following to cite this article:
Behera S, Barisal A. K, Behera S, Bagal D. K. Combined Economic Emission Dispatch including Variable Energy Resources. Curr World Environ 2024;19(2). DOI:http://dx.doi.org/10.12944/CWE.19.2.26
Copy the following to cite this URL:
Behera S, Barisal A. K, Behera S, Bagal D. K. Combined Economic Emission Dispatch including Variable Energy Resources. Curr World Environ 2024;19(2).
Download article (pdf) Citation Manager Publish History

Introduction
Power dispatch (PD) plays a major part in the scheduling and development of the power generating system (PGS), which is in charge of providing electrical energy. To provide the required power at the lowest possible cost while staying within certain transmission and operational limitations, PD is also in charge of scheduling the best and most productive power production of a dedicated generator. Reducing fuel costs and pollutant emissions together create a multi-objective CEED conundrum. Reducing the amount of coal that is burned, which produces harmful airborne pollutants including NO, SO2, and CO2 is known as emission dispatch (ED) 1. The rapid depletion of coal-based fuels gave rise to the use of weather-dependent variable energy resources (VERs) in PGS as a replacement. Many academics are inspired to include these green technologies in the PD conundrum as a result of the recognition of the enormous potential of the sun and wind. Green technology integration and the formulation of the CEED conundrum with system boundaries have also encouraged the researchers to maintain a close watch on this project. Using a Non-Dominated Genetic Algorithm–II approach, the multi-objective economic environment dispatch for a hydro-wind-thermal (HWT) system is solved2.
In the context of global sustainability, the quick integration of renewable energy sources (RES) into microgrid systems has become crucial. The world has never before placed such a premium on maximizing the economic and environmental efficiency of energy systems, as the energy sector struggles with growing energy consumption and climate change. The core of these initiatives is the idea of "decoupling," which describes the capacity to distinguish between environmental deterioration and economic progress. Decoupling is essential to sustainable development because it permits economic growth without increasing environmental damage3.
Sustainability has been profoundly impacted by the tremendous changes that globalization has brought about in the distribution of economic activity, population, and environmental effect. According to Balsa-Barreiro et al., these changes call for a reassessment of approaches to handling global issues. Innovative methods of energy management are needed, especially in the context of microgrids that include RES like solar and wind energy, due to the unequal distribution of resources and the environmental load. Although these systems have the potential to decrease greenhouse gas emissions and dependency on fossil fuels, their unpredictability and dependability pose some concerns 4.
It is imperative that these issues be resolved for both local energy security and the preservation of the ecosystem globally. In this context, one important component is the development of more sustainable technology. The article "Editorial: The Nexus Between Innovation and Environmental Sustainability" highlights how important innovation is to advancing environmentally friendly behaviors and solving environmental issues. Technology innovation may help economic development and environmental conservation at the same time by incorporating sustainability. This work adds to the current endeavor by putting forward a unique optimization strategy that integrates renewable energy sources (RES) with conventional thermal units to elucidate the combined economic emission dispatch (CEED) issue in microgrids5.
A scheduling strategy for hydro-thermal issues was presented by Ahmadi et al. in3. Stochastic wind power was utilized by Jadhav et al. in4 to elucidate the CEED issue. Using the artificial bee colony (ABC) approach, they were able to solve the problem for a system consisting of two wind and six heat test systems. The CEED difficulty related to photovoltaic (PV) power in photovoltaic generation systems (PGS) was discussed by Khan et al. in5. They used the particle swarm optimization (PSO) technique on six standard PV systems and 13 PV systems with production and power balance limitations. In6, Aghaei et al. computed the CEED of a hydrothermal system while taking into account several system restrictions. Ghasemi looked at how the wind system influenced CEED in7. In 2017, Shilaja and Ravi upgraded CEED with PV systems by using the Euclidean Flower Pollination Algorithm (EFPA) and the Binary Flower Pollination Algorithm (BFPA) to fulfill generator and renewable energy limits as well as power balancing requirements8. They had 5 thermals and 20 photovoltaic generators in their system. In9, Augustine et al. suggested power dispatching in an isolated microgrid employing wind and photovoltaic generation. Alham et al. suggested demand-side management (DSM) to assess the complexity of wind energy component analysis in10, addressing a number of concerns including load forecasting and system scheduling. A hybrid technique was used by Abid et al.11 to investigate the effects of PV and wind energy on thermal PGS. In12, the Dynamic Economic Emission Dispatch (DEED) problem was solved and optimized using the Improved Tunicate Swarm Algorithm (ITSA). A modified Adaptive Multi-Objective Differential Evolution (MAMODE) approach was used in13 to solve DEED. Using the Whale Optimization Algorithm (WOA), Dey et al. independently addressed the Economic Dispatch (ED) and CEED problems of an islanded and Variable Energy Resources (VER) integrated microgrid in14. In order to solve CEED issues in a microgrid with VERs, Khatsu et al. used Phasor Particle Swarm Optimization (PPSO) in15. A multi-objective PSO (MOPSO) was presented in16 as a DSM-based solution for DEED.
The basic concept of power dispatch (PD) is introduced in this work, taking economic dispatch and emission into account. It offers a thorough examination of the CEED issue that takes VERs into account. Three thermal units (TUs), one PV system, and one wind power (WP) system make up the system that is solved by the research using the Butterfly Optimization Algorithm (BOA)17. The five meta-heuristic methods with which the results are compared are Particle Swarm Optimization (PSO)18, Hybrid Dynamic Economic Emission Dispatch (HDEED) with energy from renewable sources generation, and new methods based on the Enhanced Moth-Flame Optimization Algorithm (EMFOA) 19, Symbiotic Organism Search (SOS)20, Grey Wolf Optimization (GWO)21, and Whale Optimization Algorithm (WOA)22. A hybrid optimization-based approach is used to tackle the microgrid system's environment-constrained economic dispatch problem23. Furthermore, a systematic analysis of power dispatching resulting from the addition of wind and solar energy to the power system is carried out using machine learning24. Additionally, investigated is the optimization of wind and photovoltaic energy for economical and emission-free dispatch25. To resolve single- and bi-objective CEED issues, the Marine Predators Algorithm (MMPA) is suggested26. CEED is solved using the CSA-JAYA approach in27.
Reducing fuel costs and greenhouse gas emissions is the main objective of the CEED function, which aims to create an ecologically friendly power production system. By not emitting hazardous pollutants and requiring extra fuel, the integration of renewable energy sources (VERs) minimizes both fuel costs and pollution. VERs do, however, come with maintenance and operational costs, which are represented in the microgrid's CEED model. This work addresses valve point effects (VPE) of TUs by converting the bi-objective CEED issue into a blended optimization problem with a price penalty factor (PPF), denoted by the letter "h." By assigning equal weight to each goal, weight factors W1 and W2 normalize the many objectives into a single target. In order to prove BOA's superiority and effectiveness over the other five optimizers in offering a reliable and complete solution, a comparison study is also carried out.
The objective of this study is to solve the CEED issue in an islanded microgrid system using a Butterfly Optimization Algorithm (BOA). A combination of thermal units, wind energy sources, and photovoltaic (PV) systems make up this system. The goal is to provide a strong and effective solution that balances economic and emission goals while also improving the overall sustainability of energy systems. This work makes a significant contribution to the worldwide search for sustainable energy solutions by tackling the fluctuation of RES and enhancing the dependability of microgrids.
Methodology
Procedure CEED Formulation
EcD Dilemma
The system's power equality, each unit's generating limit, and a reduction in the overall fuel cost are all required in the economic dispatch (EcD) conundrum. As specified in5, the total fuel cost function (FC) is:
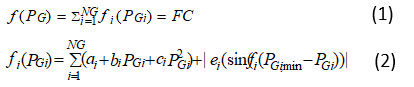
The net fuel cost ($/h) is represented by f(PG). is the fuel cost function of the ith TU in dollars per hour; PGi is the active power produced by the ith TU in milliwatt-hours; ai, bi, and ci are the ith TU's cost factors; is the ith TU's lowest generation; is its greatest generation; and is the ith TU's generation. For the VPE, the second part of (2) is included.
ED Dilemma
Because of their impact on the environment, SO2 and NOx emissions are the main pollutants that are taken into account in the PGS 6. By combining polynomial and exponential terms, one may use functions to shape these discharges of pollutants7:
![]()
Where, ai, Bi, Yi, are emission factors of the ith TU.
This article describes a method for converting the bi-objective CEED issue into an unblended optimization problem: the price penalty factor (PPF).
![]()
The PPF combines the fuel cost function with the emission function to create the emission function, where F is the total operating cost expressed in dollars per hour. PPF is the ratio of the highest emission to the lowest fuel cost of the generator 8.
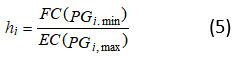
Determine hi of all TUs
Organize the values of PPFs in increasing order.
W1 and W2 are positive fractions, so that W1+W2=1. These weight factors standardize the two objectives into one by offering both of them a weightage. The weight of each part is normally chosen in accordance with its impact on the whole dilemma. Equation (4) is solved by guarding the following limits.
Equality Limits
A balance between the load demand (PL) and the total produced power will be ensured by power balance limitations. Therefore, it is necessary to always satisfy the equality as shown below.

Here, the line losses PL are disregarded.
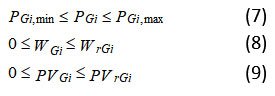
Inequality Limits
It is necessary to maintain the producing power of PVs, WPs, and TUs between their lowest and maximum capabilities.
Where PL is the power loss,
Butterfly Optimization Algorithm (BOA)
The goal of this study is to use a unique optimization approach to find a solution that emulates the food-foraging habits of butterflies. In BOA, butterflies do optimization on their own. A buttery will release an aroma that is associated with its fatness. Individuals act in the following ways:
Every buttery will move randomly or led to the best buttery, releasing more fragrance.
It is thought that every buttery releases some smell, which enhances the attractiveness of butterflies.
A butterfly's depth of stimulation is determined by its fitness in (4).
Three steps comprise the optimizer: startup, iteration, and final stages 18. First, each butterfly's butterness in different places inside the search boundaries is assessed. Each person will then emit a stench at that spot, which is indicated by:
![]()
where “I” is the stimulus depth, “f” is the perceived scent intensity, “c” is the modality-dependent sensory modality, and an is the modality-dependent power exponent that measures absorption. It is assumed to be “a” and “c” in the range [0, 1] in most research. a = 1 indicates maximum smell available and a = 0 indicates that the smell is absorbed and none other can sense it.
The two algorithmic methods in the iteration step are localized and global search. The butterfly moves toward the fastest buttery g in the t+1 phase of the global search step:
![]()
where xit represents the ith butterfly's solution vector (xi) at step t. The best result among all the outcomes in step t is shown below as g*. In [0, 1], r is a random number, and fi is the scent of the ith person.
This is one way to show the local search step:
![]()
Where butterflies jth and kth are represented by xit and xkt. (12) turns into a localized random search if xjt and xkt are members of the same group and r is a random number in [0, 1].
A mating partner's behavior or the search for food may be greatly influenced by the presence or absence of food because of differences in physical closeness and other external factors like wind, rain, etc. BOA employs a switch probability of p to go from the global phase to the intense local phase. The best fitness is awarded once the iteration is completed and the stopping requirement is met.
The following are the BOA stages, as stated in 18:
Step 1: Find the fitness function F and the size of the search space.
Step 2: Determine the total number of butterflies in the population.
Step 3: Derive stimulus intensity I in step three.
Step 4: Define the parameters c, a, and p.
Step 5: Determine which butterfly/solution is the best by computing the scent of each butterfly.
Step 6: Depending on r from [0, 1], explore/exploit each butterfly. It moves using (11) to get the best outcome if r
Step 7: The same process is carried out again until the target level of error is obtained, the maximum number of repetitions without enhancement, the maximum amount of CPU time needed, or all of the above are achieved.
Test System
The test system under consideration is a micro-grid with three TUs equipped with multi-valve turbine systems, one PV, and one WP, each with a capacity of 40 MW and 30 MW. As in [14], the WPs, PVs, and load demand statistics are shown in Table 1. Table 2 provides the statistics on system parameters that are connected with TUs. Four unique generator combinations have been discussed here, namely. In Case 1, there are just TUs (no PVs or WPs); in Case 2, there are only TUs and PVs; in Case 3, there are only TUs and WPs; and in Case 4, there are TUs, PVs, and WPs. In the MATLAB 2016 platform, BOA is used to solve CEED for all four systems. Next, the outcomes are contrasted using the following five meta-heuristic methods: PSO, DE, SOS, GWO, and WOA [14]. This is consistent for all the strategies taken into consideration: the algorithm is run for 1000 iterations with 30 populations for 20 continuous runs. BOA's parameters are p = 0.8, a = 0.2, and c = 0.01.
Table 1: Hourly generation of PVs, WPs and load demand data.
Time (h) | Load (MW) | PV (MW) | Wind MW | Time (h) | Load (MW) | PV (MW) | Wind (MW) |
1 | 140 | 0.00 | 1.70 | 13 | 240 | 31.94 | 14.35 |
2 | 150 | 0.00 | 8.50 | 14 | 220 | 26.81 | 10.35 |
3 | 155 | 0.00 | 9.27 | 15 | 200 | 10.08 | 8.26 |
4 | 160 | 0.00 | 16.66 | 16 | 180 | 5.30 | 13.71 |
5 | 165 | 0.00 | 7.22 | 17 | 170 | 9.57 | 3.44 |
6 | 170 | 0.03 | 4.91 | 18 | 185 | 2.31 | 1.87 |
7 | 175 | 6.27 | 14.66 | 19 | 200 | 0.00 | 0.75 |
8 | 180 | 16.18 | 25.56 | 20 | 240 | 0.00 | 0.17 |
9 | 210 | 24.05 | 20.58 | 21 | 225 | 0.00 | 0.15 |
10 | 230 | 39.37 | 17.85 | 22 | 190 | 0.00 | 0.31 |
11 | 240 | 7.41 | 12.80 | 23 | 160 | 0.00 | 1.07 |
12 | 250 | 3.65 | 18.65 | 24 | 145 | 0.00 | 0.58 |
Table 2: The Thermal unit generation limits, fuel cost and emission factors14
TUs | PMin (MW) | PMax (MW) | ai ($/MW2h) | bi ($/MWh) | ci ($/h) | ai (kg/MW2h) | Bi (kg/MWh) | Yi (kg/h) |
TU1 | 37 | 150 | 0.002 | 21.00 | 1530 | 0.011 | -1.355 | 60 |
TU2 | 40 | 160 | 0.003 | 20.16 | 992 | 0.008 | -0.600 | 45 |
TU3 | 50 | 190 | 0.021 | 20.40 | 600 | 0.012 | -0.555 | 90 |
Results
Table 3 shows the microgrid running costs after CEED has been completed on the test system for four combinations of PSO, DE, SOS, GWO, WOA, and BOA. A thorough comparison of the optimization outcomes for various techniques is given in Table 3. The data highlights the benefits of the suggested strategy over conventional techniques by illuminating performance measures like computing efficiency and solution correctness. Since the Min-Max penalty factor is the least and best type, it is used to frame the CEED problem [14]. It is clear that BOA produced better outcomes than PSO, DE, SOS, GWO, and WOA in each of the four distinct combinations. The microgrid operational costs that BOA completed are $152310.40, $148584.10, $148240.47, and $144529.87 for the scenarios that include "all sources (T+PV+Wind)," "with Thermal Units only," "with Thermal (T) + PV only," and "with Thermal (T) + Wind," respectively. Compared to its competitors, BOA achieves the lowest cost for the aforementioned combinations. When all sources are included, the trend of CEED is lowest, and when just TUs are included, it is greatest. It is consistent with outcomes reported in [28] for an alternative approach that made use of PSO. The emission utilizing BOA is 3642.33 kg when all sources (T+PV+Wind) are utilized, 3720.84 kg with T+Wind, 3713.01 kg with T+PV, and 3806.60 kg when none of the VERs is used. It is evident that when no VERs are in use, emissions are at their greatest. It is clear since the TUs are using more fossil fuels and emitting more harmful emissions in order to meet the overall load demand. Tables 4, 5, 6, and 7 show the hourly outputs of TUs in T+PV, T+Wind, T+PV+Wind combinations, and without VERs, respectively.
The system including all the sources underwent multi-objective CEED utilizing the BOA optimization approach, and Table 7 highlights the hourly outputs of thermal units (TUs), cost in dollars, emission in kilograms per hour, and CEED cost in dollars.
Table 3: The CEED ($) compared for Optimizers
Techniques Used | T+PV+Wind (Case 4) | T+Wind (Case 3) | T+PV (Case 2) | Thermal Units only (Case 1) |
PSO [14] | 325377.31 | 230029.07 | 297912.80 | 202886.65 |
DE [14] | 325371.30 | 230024.38 | 297911.50 | 202884.88 |
SOS [14] | 325369.80 | 230024.38 | 297910.23 | 202882.08 |
GWO [14] | 325368.44 | 230020.30 | 297908.29 | 202882.60 |
WOA [14] | 325364.49 | 230019.04 | 297907.56 | 202881.77 |
BOA | 144529.87 | 148240.47 | 148584.10 | 152310.40 |
Table 4: Hourly outputs (in MW) of conventional thermal generators only (Without VERs)
Time (h) | T1 | T2 | T3 | Time (h) | T1 | T2 | T3 |
1 | 37.00 | 53.00 | 50.00 | 13 | 67.31 | 40.00 | 132.69 |
2 | 37.00 | 40.00 | 73.00 | 14 | 71.61 | 70.00 | 78.39 |
3 | 37.00 | 40.00 | 78.00 | 15 | 50.74 | 90.56 | 58.69 |
4 | 63.18 | 46.82 | 50.00 | 16 | 52.24 | 50.54 | 77.22 |
5 | 37.00 | 40.00 | 88.00 | 17 | 45.82 | 70.53 | 53.65 |
6 | 37.00 | 40.00 | 93.00 | 18 | 41.95 | 76.60 | 66.46 |
7 | 37.00 | 40.00 | 98.00 | 19 | 41.80 | 77.81 | 80.39 |
8 | 68.54 | 40.00 | 71.46 | 20 | 77.00 | 81.01 | 81.99 |
9 | 75.33 | 71.73 | 62.94 | 21 | 72.69 | 74.31 | 78.00 |
10 | 78.80 | 79.20 | 72.00 | 22 | 40.77 | 63.26 | 85.98 |
11 | 78.52 | 91.48 | 70.00 | 23 | 37.00 | 40.00 | 83.00 |
12 | 82.15 | 82.47 | 85.38 | 24 | 55.00 | 40.00 | 50.00 |
Table 5: Hourly outputs (in MW) of Thermal + PV system
Time (h) | T1 | T2 | T3 | Time (h) | T1 | T2 | T3 |
1 | 50.00 | 40.00 | 50.00 | 13 | 78.06 | 60.00 | 70.00 |
2 | 60.00 | 40.00 | 50.00 | 14 | 37.00 | 40.00 | 50.00 |
3 | 37.00 | 68.00 | 50.00 | 15 | 57.00 | 60.00 | 76.19 |
4 | 48.85 | 40.00 | 71.15 | 16 | 37.00 | 86.67 | 66.25 |
5 | 37.00 | 78.00 | 50.00 | 17 | 51.46 | 40.00 | 83.24 |
6 | 37.00 | 82.97 | 50.00 | 18 | 49.26 | 40.00 | 71.17 |
7 | 37.00 | 81.73 | 50.00 | 19 | 72.32 | 60.37 | 50.00 |
8 | 73.82 | 40.00 | 50.00 | 20 | 83.09 | 40.00 | 76.91 |
9 | 57.00 | 50.00 | 88.95 | 21 | 89.36 | 70.00 | 80.64 |
10 | 37.00 | 70.00 | 83.63 | 22 | 37.00 | 40.00 | 148.00 |
11 | 82.14 | 97.28 | 53.17 | 23 | 37.00 | 56.00 | 97.00 |
12 | 89.35 | 80.00 | 77.00 | 24 | 50.62 | 40.00 | 69.38 |
Table 6: Hourly outputs (in MW) of Thermal + Wind system
Time (h) | T1 | T2 | T3 | Time (h) | T1 | T2 | T3 |
1 | 48.30 | 40.00 | 50.00 | 13 | 97.72 | 45.05 | 82.88 |
2 | 37.00 | 40.00 | 64.50 | 14 | 57.00 | 70.00 | 82.65 |
3 | 55.73 | 40.00 | 50.00 | 15 | 48.80 | 92.94 | 50.00 |
4 | 37.00 | 40.00 | 66.34 | 16 | 37.00 | 40.00 | 89.29 |
5 | 37.00 | 70.78 | 50.00 | 17 | 37.00 | 40.00 | 89.56 |
6 | 52.38 | 40.00 | 72.71 | 18 | 93.13 | 40.00 | 50.00 |
7 | 44.76 | 52.34 | 63.24 | 19 | 77.57 | 40.00 | 74.17 |
8 | 37.00 | 67.44 | 50.00 | 20 | 78.43 | 81.40 | 80.00 |
9 | 37.00 | 82.42 | 70.00 | 21 | 72.60 | 70.23 | 82.02 |
10 | 77.37 | 84.78 | 50.00 | 22 | 44.65 | 60.11 | 84.94 |
11 | 81.63 | 73.17 | 72.39 | 23 | 37.00 | 71.93 | 50.00 |
12 | 38.47 | 97.15 | 95.72 | 24 | 37.00 | 40.00 | 67.42 |
Table 7: Hourly generations (in MW) of TUs, Cost, Emission and CEED cost using BOA (All sources i.e. Thermal + PV + Wind)
Time (h) | T1 | T2 | T3 | Cost $ | Emission kg | CEED $ |
1 | 48.30 | 40.00 | 50.00 | 6025.44 | 145.10 | 5394.32 |
2 | 51.50 | 40.00 | 50.00 | 6091.80 | 144.78 | 5450.12 |
3 | 37.00 | 58.73 | 50.00 | 6179.17 | 144.69 | 5524.19 |
4 | 37.00 | 40.00 | 66.34 | 6132.39 | 143.69 | 5482.30 |
5 | 37.00 | 70.78 | 50.00 | 6431.68 | 143.80 | 5737.10 |
6 | 37.00 | 78.06 | 50.00 | 6577.89 | 147.41 | 5867.10 |
7 | 37.00 | 67.07 | 50.00 | 6350.44 | 145.72 | 5671.25 |
8 | 48.26 | 40.00 | 50.00 | 6024.59 | 145.11 | 5393.62 |
9 | 37.00 | 40.00 | 88.37 | 6594.60 | 146.57 | 5872.66 |
10 | 48.40 | 40.00 | 84.38 | 6757.03 | 148.33 | 6006.07 |
11 | 86.26 | 40.00 | 67.45 | 7182.11 | 151.15 | 6388.67 |
12 | 80.70 | 70.00 | 77.00 | 7942.75 | 176.00 | 7028.11 |
13 | 69.20 | 40.00 | 84.51 | 7191.33 | 153.27 | 6388.67 |
14 | 83.04 | 49.80 | 50.00 | 6953.26 | 148.26 | 6188.90 |
15 | 57.00 | 40.00 | 84.66 | 6954.98 | 156.90 | 6167.36 |
16 | 37.00 | 73.99 | 50.00 | 6495.94 | 145.19 | 5794.30 |
17 | 37.00 | 40.00 | 79.99 | 6413.84 | 149.75 | 5723.06 |
18 | 90.35 | 40.00 | 50.47 | 6928.61 | 148.13 | 6152.03 |
19 | 75.38 | 60.37 | 63.50 | 7291.23 | 157.30 | 6491.36 |
20 | 77.09 | 86.82 | 75.92 | 8162.65 | 177.02 | 7261.73 |
21 | 83.02 | 70.00 | 71.83 | 7867.29 | 171.12 | 6973.63 |
22 | 37.00 | 40.00 | 112.69 | 7116.02 | 157.29 | 6314.52 |
23 | 37.00 | 40.00 | 81.93 | 6449.06 | 151.33 | 5757.57 |
24 | 52.85 | 40.00 | 51.57 | 6152.66 | 144.44 | 5501.22 |
162266.78 | 3642.33 | 144529.87 |
Fig. 1 visualizes the distribution of energy generation across different sources. The graphical representation demonstrates the effectiveness of integrating renewable sources into the energy mix and provides insights into their impact on overall system performance.
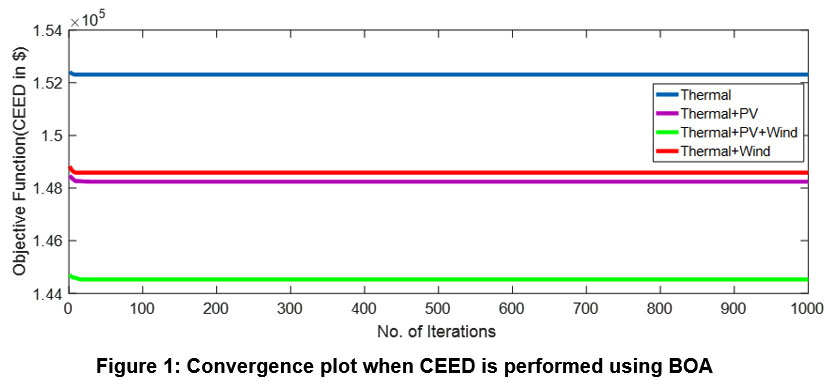 | Figure 1: Convergence plot when CEED is performed using BOA
|
Table 8: Cost, emission and CEED of all cases using BOA
Sources Used | Cost (in $) | Emission (kg/Hr) | CEED ($) |
Only Thermal | 171173.30 | 3806.60 | 152310.40 |
T+PV | 166968.90 | 3713.00 | 148584.10 |
T+Wind | 166450.71 | 3720.84 | 148240.47 |
T+PV+Wind | 162266.78 | 3642.33 | 144529.87 |
Table 9: Cost and emission saving in the system with addition of VERs compared to the thermal system only
Case | Cost saving in $ per day | Cost saving in $ per year | Emission saving in Ton per day | Emission saving in Ton per year |
T+PV (Case 2) | 4204.40 | 1534606.00 | 93.60 | 34164.00 |
T+Wind (Case 3) | 4722.59 | 1723745.35 | 85.76 | 31302.40 |
T+PV+Wind (Case 4) | 8906.52 | 3250879.80 | 164.27 | 59958.55 |
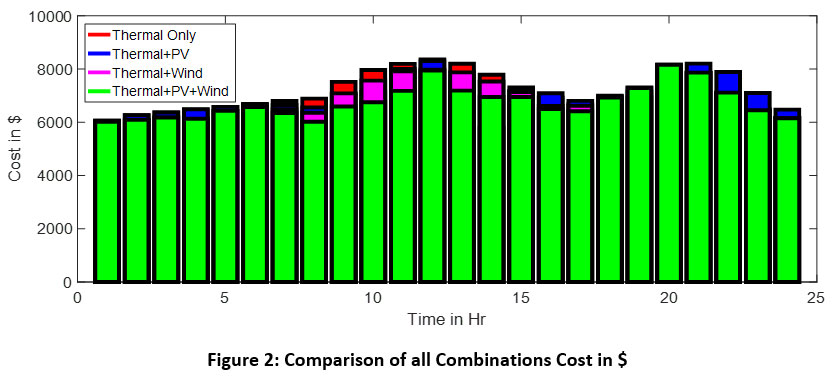 | Figure 2: Comparison of all Combinations Cost in $
|
Discussion
The convergence map for the combinations taken into consideration when CEED is decoded using BOA is shown in Fig. 1. After thirty cycles, the convergence has attained the final CEED. When compared to other optimization approaches used in 15, BOA takes 18 to 20 seconds to get the best outcome for all circumstances. Table 8 shows the cost, emission, and CEED after weighing for different combinations when CEED is solved using BOA. It has been noted that every result is reaching its maximum potential for equality and inequity. The load demand is lower at the early and final slack hours of the day and is shared by all the units; however, during the peak demand hours, during rush hour, big capacity thermal generators mostly share the maximum power within their limitations. When VERs are not used and the TUs just share the load, these parameters are important. Once again, PV electricity is only accessible during the day and not at night during peak hours. As a result, the cost of adding PV increases as a result of higher load demand on TU, while wind power is available in varying amounts throughout the day and night. Consequently, T+Wind lowered the cost. This is shown visually in Fig. 2, where it is seen that the cost increases from the eighth to the eighteenth hour in accordance with the load. Furthermore, the addition of PVs contributes less to cost reduction than do WPs with comparable capacity. Table 9 displays the cost and emission savings on a daily and yearly basis. When we combine the current thermal system with PV and wind, we can see that the system experiences the greatest cost and emission reductions.
Conclusion
This research has provided a case study and an examination of the integration of VERs on the CEED issue. The PD dilemma encompasses four different sorts of combinations of VERs and TUs, transforming it into a complex, multi-objective optimization problem.
Numerous optimization techniques have been suggested in order to solve this CEED conundrum; each has advantages and disadvantages of its own. The investigation reveals that photovoltaics (PV) is the most extensively used renewable technology in the electricity sector. However, the erratic solar irradiation complicates power dispatch (PD), necessitating novel dispatch studies and efficient optimization strategies. This study addresses the CEED conundrum of VERs integrated islanded microgrid systems with three TUs, one PV, and one wind energy source via an efficient optimization approach.
The key conclusions of the research are summarized as follows:
This study proposes a weighted sum approach to decipher multi-objective dilemmas with committed optimization processes.
Two single-objective dilemmas, namely EcD and ED, are combined to form a CEED dilemma, which is solved using BOA.
The Min-Max PPF was included to combine the two single-objective dilemmas into a multi-objective one.
In order to address the CEED challenge, four unique combinations were examined.
When compared to four counterparts, projected BOA produced better results for every combination.
Sustainable growth requires a shift to renewable energy sources. Renewable energy offers a potential alternative as traditional energy sources become more and more inadequate to fulfill the world's expanding energy needs. The significance of overcoming operational limitations and improving energy dispatch systems is emphasized in this research. India is leading this shift with its enormous potential for producing renewable energy. In the next years, India has a chance to take the lead in the global renewable energy business if the issues raised by this study are resolved. India can improve its energy security and make a major contribution to the global sustainability objectives by investing in cutting-edge optimization methods and correcting the shortcomings of existing systems. Subsequent investigations have to concentrate on devising inventive approaches to incorporate renewable energy sources more successfully and guarantee a dependable and effective energy provide.
It is possible to consider solving the CEED conundrum for a grid-integrated micro-grid as a portion of future study. Furthermore, additional realistically encountered limits like prohibitive operation zone and ramp rates of the TUs may be introduced to make the issue more feasible while also increasing the test system's complexity. The ability of BOA to address these limitations may then be discussed. Any nation's growth and energy implementation are greatly aided by the use of renewable energy sources. The world's population is expanding, and so is the need for energy. Conventional energy sources alone are insufficient to achieve this energy. India will dominate the world in the generation of renewable energy if it can reach this level of completion in the next years.
Acknowledgment
The authors would like to thank Sasmita Behera, Ajit Kumar Barisal, and Soudamini Behera for their assistance in organizing the tests, administering the project, and creating the study proposal. Dilip Kumar Bagal and Sasmita Behera assessed the data, ran the simulations, and created the report's visuals. Each writer reviewed, revised, and approved the completed draft.
Funding sources
The author(s) received no financial support for the research, authorship, and/or publication of this article.
Conflict of Interest
The authors do not have any conflict of interest.
Data Availability Statement
Upon reasonable request, any models, data, and code developed or used during the research may be obtained from the appropriate author.
Ethics Approval Statement
This research did not involve human participants, animal subjects, or any material that requires ethical approval
Authors' Contributions
Soudamini Behera (SB) handled conceptualization, Ajit Kumar Barisal (AKB) handled methodology, Sasmita Behera (SB): Research, Dilip Kumar Bagal (DKB): Data Analysis; AKB, SB, and DKB: Writing—Preparing the Original Draft; SB: Writing, Editing, and Revision. After reading the text in its published form, each author has approved it.
References
- Nitin T. Economic load dispatch of wind-solar-thermal system using backtracking search algorithm. Int J Eng Technol., 2016;8(4):16-27.
- Dey SK, Dash DP, Basu M. Multi-objective economic environmental dispatch of variable hydro-wind-thermal power system. Int J Appl Metaheuristic Comput., 2021;12(2):16-35.
- Desha C, Hargroves C, Smith MH. Cents and sustainability: securing our common future by decoupling economic growth from environmental pressures. Routledge; 2010.
- Balsa-Barreiro J, Li Y, Morales A. Globalization and the shifting centers of gravity of world's human dynamics: implications for sustainability. J Clean Prod., 2019;239:117923.
- Balsa-Barreiro J, Wang S, Tu J, Li Y, Menendez M. The nexus between innovation and environmental sustainability. Front Environ Sci., 2023;11:1194703.
- Ahmadi A, Aghaei J, Shayanfar HA, Rabiee A. Mixed integer programming of multiobjective hydro-thermal self-scheduling. Appl Soft Comput J., 2012;12(8):2137-2146.
- Jadhav HT, Roy R. Gbest guided artificial bee colony algorithm. Expert Syst Appl., 2013;40(16):6385-6399.
- Khan NA, Awan AB, Mahmood A. Combined emission economic dispatch of power system including solar photovoltaic generation. Energy Convers Manage., 2015;92:82-91.
- Aghaei J, Ahmadi A, Rabiee A. Uncertainty management in multiobjective hydro-thermal self-scheduling under emission considerations. Appl Soft Comput., 2015;37:737-750.
- Ghasemi A, Gheydi M, Javad M. Modeling of wind/environment/economic dispatch in power system and solving via an online learning meta-heuristic method. Appl Soft Comput J., 2016;43:454-468.
- Shilaja C, Ravi K. Optimization of emission/economic dispatch using Euclidean flower pollination algorithm (EFPA) and binary FPA (BFPA) in solar photovoltaic generation. Renew Energy., 2017;107:550-566.
- Augustine N, Suresh S, Moghe P. Economic dispatch for a microgrid considering renewable energy cost functions. In: 2012 IEEE PES Innovative Smart Grid Technologies (ISGT)., IEEE; 2012:1-7.
- Alham MH, Elshahed M, Ibrahim DK. Optimal operation of power system incorporating wind energy with demand side management. Ain Shams Eng J., 2017;8(1):1-7.
- Abid A, Malik TN, Abid F. Dynamic economic dispatch incorporating photovoltaic and wind generation using hybrid FPA with SQP. IETE J Res., 2020;66(2):204-213.
- Li LL, Liu ZF, Tseng ML, Zheng SJ, Lim MK. Improved tunicate swarm algorithm: solving the dynamic economic emission dispatch problems. Appl Soft Comput., 2021;108:107504.
- Jiang X, Zhou J, Wang H. Dynamic environmental economic dispatch using multi-objective differential evolution algorithm with expanded double selection and adaptive random restart. Int J Electr Power Energy Syst., 2013;49:399-407.
- Dey B, Roy SK, Bhattacharyya B. Solving multi-objective economic emission dispatch of a renewable integrated microgrid using latest bio-inspired algorithms. Eng Sci Technol Int J., 2019;22(1):55-66.
- Khatsu S, Srivastava A, Das DK. Solving combined economic emission dispatch for microgrid using time varying phasor particle swarm optimization. In: 2020 6th International Conference on Advanced Computing and Communication Systems (ICACCS)., 2020:411-415.
- Lokeshgupta B, Sivasubramani S. Multi-objective dynamic economic and emission dispatch with demand side management. Int J Electr Power Energy Syst., 2018;97:334-343.
- Arora S, Singh S. Butterfly optimization algorithm: a novel approach for global optimization. Soft Comput., 2019;23(3):715-734.
- Radosavljevic J, Jevtic M, Klimenta D. Energy and operation management of a microgrid using particle swarm optimization. Eng Optim., 2015;273:1-20.
- Liu ZF, Li LL, Liu YW, Liu JQ, Li HY, Shen Q. Dynamic economic emission dispatch considering renewable energy generation: A novel multi-objective optimization approach. Energy., 2021;235:121407-121426.
- Saha D, Datta A, Das P. Optimal coordination of directional overcurrent relays in power systems using symbiotic organism search optimization technique. IET Gener Transm Distrib., 2016;10(11):2681-2688.
- Sharma S, Bhattacharjee S, Bhattacharya A. Grey wolf optimisation for optimal sizing of battery energy storage device to minimize operation cost microgrid. IET Gener Transm Distrib., 2016;10(3):625-637.
- Raj S, Bhattacharyya B. Optimal placement of TCSC and SVC for reactive power planning using Whale optimization algorithm. Swarm Evol Comput., 2018;40:131-143.
- Dey B, Bhattacharyya B, Márquez FP. A hybrid optimization-based approach to solve environment constrained economic dispatch problem on microgrid system. J Clean Prod., 2020;307:127196-127210.
- Nourianfar H, Abdi H. Solving power systems optimization problems in the presence of renewable energy sources using modified exchange market algorithm. Sustain Energy Grids Netw., 2021;26:100449, 217-226.
- Tang Y, Tang X, Yang Y, Zhou Z, Deng Y. Systematic Analysis of Power Dispatching: Using Machine Learning. In: Proceedings of the 2nd International Conference on Green Energy, Environment and Sustainable Development (GEESD2021)., 2021:217-226.
- Nassar MY, Abdullah MN, Ahmwed A. A review of optimization methods for economic and emission dispatch considering PV and wind energy. IOP Conf Ser: Mater Sci Eng., 2019;1127(1):012035.
- Hassan MH, Yousri D, Kamel S, Rahmann C. A modified Marine Predators Algorithm for solving single-and multi-objective combined economic emission dispatch problems. Comput Ind Eng., 2022;164:107906.
- Basak S, Bhattacharyya B, Dey B. Combined economic emission dispatch on dynamic systems using hybrid CSA-JAYA Algorithm. Int J Syst Assur Eng Manag., 2022:1-22.
- Behera S, Behera S, Barisal AK. Dynamic economic emission dispatch of thermal-wind-solar system with constriction factor-based particle swarm optimization algorithm. World J Eng., 2021;18(2):217-227.


