Assessment of landslide Susceptibility in the Himalayan State of Tripura, India, using a Multi-Model Approach
Debasis Das
 , Y. V. Krishnaiah
*
, Kausik Panja
, Manika Mallick
, Moumita Hati
, Deepa Rai
and Atoshi Chakma
, Y. V. Krishnaiah
*
, Kausik Panja
, Manika Mallick
, Moumita Hati
, Deepa Rai
and Atoshi Chakma
1
Department of Geography and Disaster Management,
Tripura University (A Central University),
Suryamaninagar, Agartala,
India
http://dx.doi.org/10.12944/CWE.19.2.29
Copy the following to cite this article:
Das D, Krishnaiah Y. V, Panja K, Mallick M, Hati M, Rai D, Chakma A. Assessment of landslide susceptibility in the Himalayan state of Tripura, India, using a Multi-Model Approach DOI:http://dx.doi.org/10.12944/CWE.19.2.29
Copy the following to cite this URL:
Das D, Krishnaiah Y. V, Panja K, Mallick M, Hati M, Rai D, Chakma A. Assessment of landslide susceptibility in the Himalayan state of Tripura, India, using a Multi-Model Approach
Download article (pdf) Citation Manager Publish History

Introduction
Landslide can be classified as one of mass movement and can be of multiple factors involved in the movement, e.g. rock fall, debris fall and flow, top loose soil, mud etc., and can have a direct or indirect impact on lives and livelihood1 2 3. As per the UNDRR Annual Report-2019, the most influential factors of landslides are rainfall (61.3 %), human impact (3.8 %), earthquake (0.9 %), and other local factors (33.7 %)4. The Centre for Research on Epidemiology of Disaster (CRED) stated that about 4.4% of disaster-related life and collateral losses occur due to landslides4. The Global Fatal Landslide Database (GFLD) revealed that from 2004 to 2016, India ranked one of the highest in terms of reported fatal landslides due to the presence of the Himalayas fold mountain system. India faced 923 landslides, and nearly 11230 lives were lost during 2004-2016 6. According to the Global Landslide Database - Des Inventar (2021), India is the second and fourth ranked regarding the number of landslide occurrences (2283) and fatalities (2283)7 respectively. In India, the landslides were reported maximum in the Himalayan states of Uttarakhand, Jammu and Kashmir, Mizoram, Tripura, Nagaland, and Arunachal Pradesh, and also Kerala state since it is located in part of western Ghats8. Landslide Atlas of India prepared by NRSC, Hyderabad, has shown Tripura state obtained 8th rank in the occurrence of landslides, and 56 landslides were recorded within the year 20219. The Geological Survey of India (GSI) reports that Tripura’s districts are directly or partially affected by landslides, predominantly in hills during extreme rainfall in the summer monsoon season and during earthquake events 10 11. Tripura Disaster Management Authority (TDMA) reports (2002-22) stated that it has witnessed numerous landslides resulting in 9 life losses, widespread damage to infrastructure (about 106 houses damaged and frequent road collapses throughout the state), substantial economic loss and disturbed livelihood of people 12, 13. Earlier researcher had developed mitigation and prevention plans, and also making landslide vulnerability maps at global, national and regional levels. Various landslide susceptibility models and techniques, applied from field-based empirical study to advanced machine learning-based GIS techniques, were introduced to mapping such destructive events. These mainly evolved from simple overlay to knowledge-based Multi-criteria Decision Making (MCDM), statistical, weighted overlay, probability, regression decision tree, and computer learning approach. Among the following approaches, the predominant techniques used in Landslide Susceptibility Modelling (LSM) are weighted overlay, Analytical Hierarchical Process, Frequency Ratio, Logic Regression and Random Forest, etc. Though this kind of study is essential in the state or region, there is an inadequacy in such studies in the northeast region of India, especially for Tripura. Thus, for assessing the landslide susceptibility zones of Tripura, the AHP, FR, and RF models were used to get an overview of landslide-prone areas and a comparative evaluation of such LSM techniques.
Study Area
Tripura is one of the twelve Himalayan states in India, located in the north-eastern part of the country14. It comprised total area of 10491km2 approximately and extending between 22° 56' to 24° 32' North Latitude and 91° 09' to 92° 20' East Longitude (Fig.1.)14. The state experiences warm and humid tropical climate. The mean annual rainfall varies from 1922 mm to 2855 mm, and the mean temperature ranges from 10°C (January) to 33°C (May). Nearly 60% of rainfall is received during monsoon (May to mid-October) and 30% during pre-monsoon season 15 16. There are ten significant rivers that originate from the hills of Tripura and are the rightward tributaries of the Meghna River. The study area comprises western Sylhet riverine plains, undulating plains, and hilly regions. The elevation varies from 12 to 940 meters above the mean sea level. Tripura have five parallel anticlines and synclines in the hilly part of the state; it has been remarked as ‘Ridge Valley Province’ 17. The hill slopes are formed of young sedimentary rocks, weathered debris, and soil mixed with sand and laterites, predominantly modified by fluvial actions 18. The Geological Survey of India (GSI) states that the state is predominated by Miocene to Holocene period lithology as the development of Neo-tectonism started over the Indo-Myanmar mobile zone. The ranges of folded hills are formed over the young Tripura-Mizoram fold belt 19. Physiographically, Tripura is divided into western parts and intermediate valley plains, undulating areas (tilla-lungas), dissected foothills, and hill ranges. National Centre for Seismology stated that it falls under Seismic Zone V, which makes it more vulnerable to slope instability and landslides. The most recent tremor of the earthquake (5.9 MW) has been recorded near Kanchanbari in Dhalai District10.The state is administratively divided into Tripura Tribal Area Autonomous District Council (TTAADC) and non-ADC. These divisions were formed physiographically: ADC covers hilly and forested areas, characterized by remoteness and hilly inaccessible conditions, and non-ADC covers the riverine plains. High population concentration has been observed in the state capital ‘Agartala’ and urban towns such as Udaipur, Dharmanagar, and other sub-divisional towns and nagar-panchayet, which are majorly connected through cross linking hilly routes.
The physical, climatological, and socio-economic conditions make the state more vulnerable to landslides, collateral damage, and fatality. Therefore, this research is focused on identifying the LSZ (Landslide Susceptible Zone) in Tripura based on responsible factors, assessing their degree of intensity on landslide occurrence, and finally finding the best accurate models in landslide susceptibility modelling. The analysis will benefit the planning and development of the region more by mitigating landslides through modelling. This study will also help advance early warning systems to avoid devastating situations.
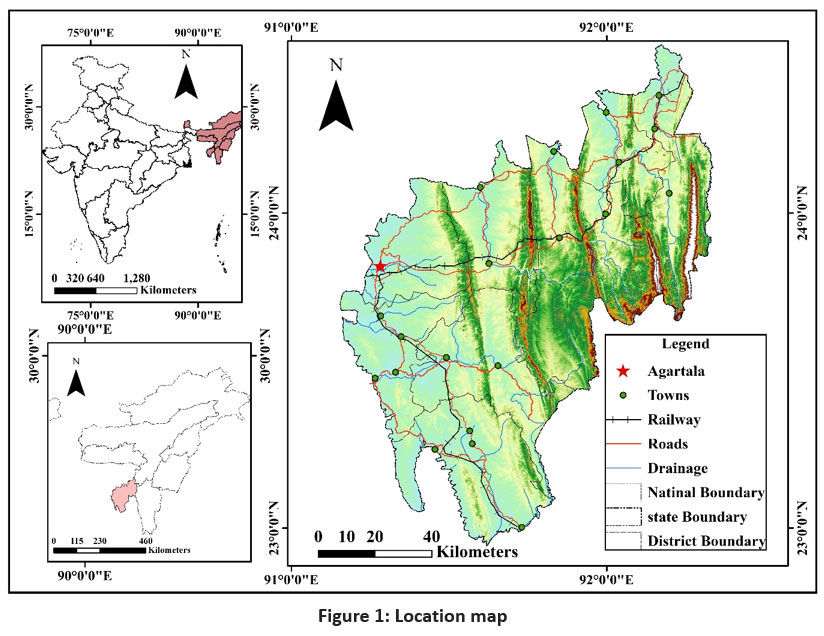 | Figure 1: Location map
|
Data and Methodology
For the assessment of landslide susceptibility of Tripura, the fifteen selected causative factors are the foremost essential, which are identified and categorized as broadly (i) topographic, (ii) geotechnical, (iii) hydrological, (iv) environmental, and (v) anthropogenic factors20. Under the topographic causative factors are elevation, slope, relative relief, and Topographic Position Index. These factors influence landslide occurrence as high elevations, steep slopes, and unstable soil can increase the intensity of landslides 21. The underlying lithology, fault and lineament density, and Soil Bulk Density (SBD) were considered within the geotechnical factors. As the lithology represents subsurface structures and the lineament distribution indicates surficial and sub-surficial weakness, these lead to landslide susceptibility. The lithological structure represents the forming rocks, whereas the distribution of lineament and low SBD indicate surficial and sub-surficial weakness, leading to landslides22 23 24. Regarding hydrological causative factors, the annual rainfall distribution, proximity to streams, and stream power significantly affect landslides. During the monsoon season, rainfall causes a decrease in the cohesiveness of slope materials by increasing moisture content. On the other hand, surface runoff also increased due to heavy rain, resulting in erosion and toe cutting of slopes leading to landslide susceptibility 25.To address the environmental causative factors, the vegetation condition and water availability were extracted using the band rationing based on NDVI and NDWI over the hillsides, which can also influence the risk of landslides 26. The present status of LULC changes and proximity to the roads (construction of roads in hilly and steep slopes) are considered under the anthropogenic causative factor, which also acts as one of the critical stabling agents, as instinctive changes in land use phenomena over slope27 28 29. These factors were assembled by summarizing the globally available landslide databases, GFLD (Global Fatal Landslide Database), GLC (Global Landslide Catalogue), EM-DAT (Emergency Event Database), and DesInventar30 9 31 32.
The above selected causative factors are further converted into thematic raster layers accordingly in QGIS and Google Earth Engine GIS platforms. The topographic and number of causative factors such as elevation, slope, relative relief, TPI, SPI and drainage are extracted from the pre-processed ESA COPDEM 30 Digital Elevation Model (COP30) with a resolution of 30 meters33. Further, the selected environmental and anthropogenic causative factors such as Normalized Difference Vegetation Index (NDVI), Normalized Difference Water Index (NDWI), Bare Soil Index (BSI) and Land use land cover for 2023 were prepared from the processed Landsat 9 image collection in the GEE platform. The other factors, such as geology, road networks, and landslide points, were collected in vector format, and were converted into thematic raster layers with the same EPSG projection: 32646 and resampled into 30-meter resolution. The detailed data sources and their uses are given in Table 1.
Table 1: Acquired data
Sl no | Data | Data source | Resolution / Scale | Used for |
1 | COP30 DEM | Open Topography web Portal33 | 30 meter | Topographic analysis |
2 | Landsat-9 OLI | https:// earthexplorer.usgs.gov/ 34 | 15,30 meter | Environmental parameter |
3 | Geological data | https://bhukosh.gsi.gov.in/ Bhukosh/MapViewer.aspx35 | 1:50,000 | lithology and lineament |
4 | Soil grid data | https://www.isric.org/ explore/soilgrids36 | 250 meter | Soil bulk density |
5 | Land Use Land Cover map | https://code.earthengine. google.com/37(prepared by Author) | 30 meter | Anthropogenic factor |
6 | Transportation map | openstreetmap.org 38 | 1:100,000 | Anthropogenic factor |
7 | Rainfall Data | https://www.imdpune.gov.in/cmpg/Griddata/ Rainfall_25_NetCDF. Html39 | 0.25 degree | Rainfall |
8 | Landslide points | https://bhukosh.gsi.gov.in/Bhukosh/MapViewer.aspx& Field surveydata.40 | 1:50,000 | Training and testing of models |
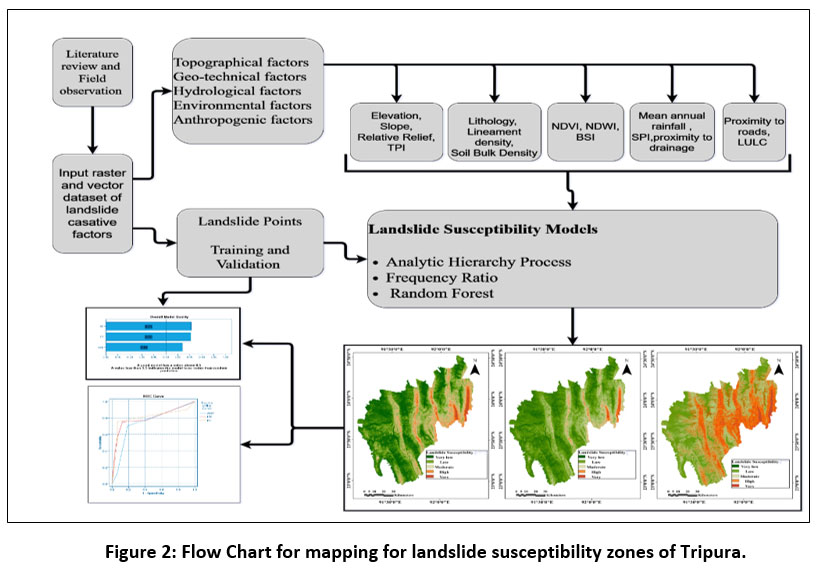 | Figure 2: Flow Chart for mapping for landslide susceptibility zones of Tripura.
|
The methodologies applied for mapping of LSZs are from various perspectives, which are based on multicriteria decision-making techniques, statistical techniques, and semi-automated techniques41. Among all of these, some of the most used methods are AHP and FR42. These methods use prior expertise and past spatial data to produce the output results, such as AHP weightage and FR value43.The AHP (MCDM) model organises the interrelating landslide causative factors. The susceptibility of landslides in Tripura is determined from assigned weights based on a derived AHP comparison matrix, drawing from previous empirical information in the fields46, 47, 48. The FR values are calculated from the bivariate statistics of the area coverage of landslide and not-affected areas among the selected causative factors. By following the rationing formula-
![]()
the probability of the occurrence of landslides, to-landslides non-occurrence in a given area was assessed52. Random Forest is an ensemble machine learning model proposed by Leo Breiman (2001) to classify the regression tasks; the LSM modelling operates by constructing a multitude of decision trees at training time 54. The random forest takes the majority of the votes for the classification decision. It comprises several decision trees as input from causative factors and trains the data using an automated clustering algorithm. In this case, the rasterized factors are clustered into a predefined number of classes44, 45. Therefore, the assessment of landslide susceptibility in Tripura used more effective models: (i) AHP, (ii) FR, and (iii) RF based on the expertise of field information and past landslide points classified for susceptible zones (Fig.2.)
This model was performed using Google Earth Engine (GEE). The first step of the RF model is preparing the collection of fifteen selected causative factors and importing GEE to map landslide susceptibility zones. Further, all the prepared raster maps are merged as an image collection. These classified points are used as training and testing points to prepare training and testing data sets. The prepared 70% dataset is used to train the RF model, and the number of trees was estimated by the hyper-tuning method. In this case, it is 97. Finally, by combining 97 predictions, the final landslide susceptibility map has been prepared. The final map was validated using the randomly selected remaining 30% of the sampled dataset. The landslide and non-landslide points are classified into five severity classes.
Results
Topographic factors: The elevation, slope, relative relief, and geomorphic units or landforms (derived from TPI) are considered topographic causative factors of landslides. The elevation of Tripura is categorized into the following physiography: Plains (below 40 meters), Lunga-tilla (40-80 meters), foothills (80-120 meters), Hills and Hill ridges (120 meters and above). Among the physiographic divisions, most of the landslides occurred in high-elevation areas occupying 22.83% of the total area, especially in hills, including the highly undulating southern part of Tripura and the heights ranging between 120 meters and 939 meters (Fig. 3a.).
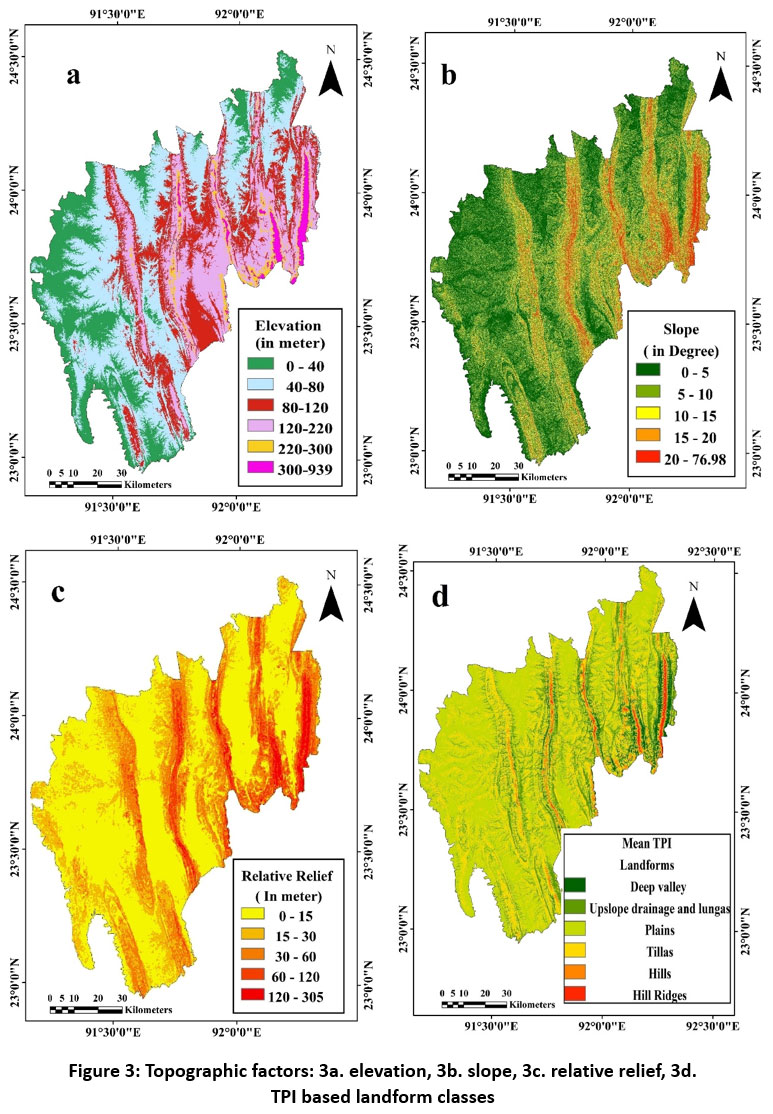 | Figure 3: Topographic factors: 3a. elevation, 3b. slope, 3c. relative relief, 3d. TPI based landform classes
|
The most influencing categories of the slope are strongly slopping (10°-15°), moderately steep slope (15°-20°), and steep slope (above 20°), covering 29.12% (Fig.3b.). The moderate to very high relative relief between 60 and 305 meters covers about 8.42% of the area. It is also affected by landslides (Fig.3c.). The TPI values range from negative 224.412 to positive 302.167, classified into Deep Valley, Upslope drainage, and Lungas, Plains, Tillas, Hills and Hill ridges. From the field visits, the Deep Valleys (16%), Upslope drainage or foothills (22%), Hills and Hill ridges (50%) are observed as the most landslide occurrence landforms, among the hills only covering an area of 5.09% (Fig.3d.).
Geotechnical factors: Geologically, Tripura consists of five major lithologic formations such as Bhuban (6.53%), Bokabil (30.23%), Tipam (44.47%), Dhupitila (14.46%) and recent depositions as Holocene (4.30%). These formations were developed under maritime, shallow fluvial-maritime conditions. The rocks found highest are shale, laminated shale sandstone, buff-coloured sandstone, siltstone, and mud/claystone (Fig.4e.). The distribution of lineament density shows that in North Tripura, Dhalai, Unakoti and part of Gomati are the high lineament density districts of Tripura (with higher density, above1.5km/km2) among the five central hills ranges (Fig.4f.).
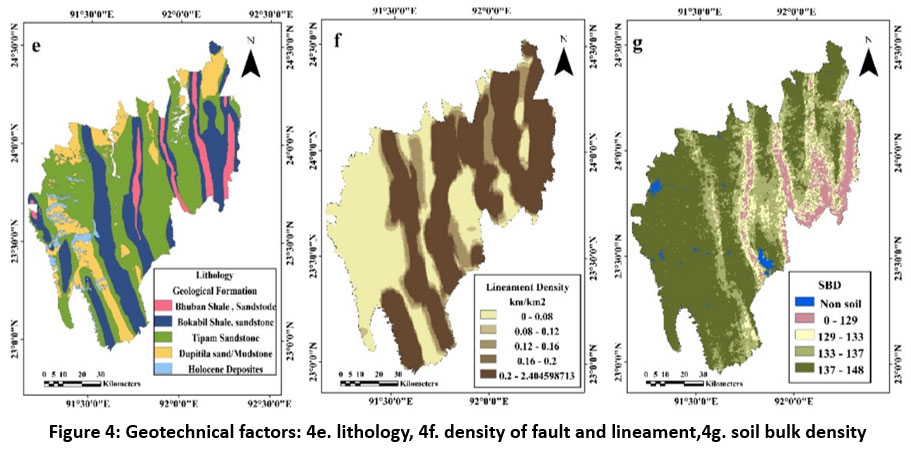 | Figure 4: Geotechnical factors: 4e. lithology, 4f. density of fault and lineament,4g. soil bulk density
|
The SBD is another crucial controlling factor. The hilltops have the lowest SBD, and the riverine plains, valley fills, and lungas have the highest SBD (148 cg/ cm3) and immune from slope instability. The lesser SBD indicates the lower cohesion of soil and makes the slope unstable. Among hills of Atharamura, Longtarai, Sakhan, Jampui and the central catchment reserve forest area are observed to have lower than 129 cg/cm3 SBD at 60 cm of depth, thus being vulnerable to landslide (Fig. 4g.).
Hydrological factors: The Steam Power Index denotes the probable topography-driven erosional power of the surface flow or Streams. In the case of Tripura, SPI varied between 0.15 and 25.11, and its spatial distribution indicates that the hilly areas, along with a high drainage distribution, have a high potential for erosion (Fig.5h.). Another hydrological factor is proximity to a stream. It is observed from the field survey and past landslide records that the 100-meter neighbourhood is the most susceptible. In this case, about ten landslides were detected along the proximity of a hundred meters of stream in the past (Fig.5i.). According to IMD, the total annual precipitation recorded within the state ranges from 1450 to 2500 millimetre (Fig.5j.). It increasingly trend towards the south, due to neighbourhood of Bay of Bengal. However, most of Tripura’s high hills have experienced 1700 to 1900 mm of rainfall annually for the last three decades (1990-2020).
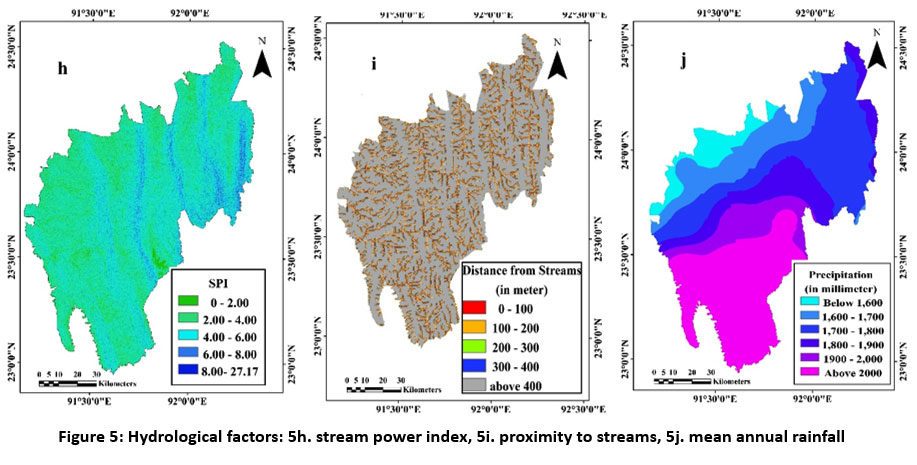 | Figure 5: Hydrological factors: 5h. stream power index, 5i. proximity to streams, 5j. mean annual rainfall
|
Environmental factors: The NDVI is considered to identify the vegetativeness of the state. The higher NDVI (0.53 to 0.20) indicates moderate to dense vegetation covering an area of 80% (Fig. 6k.). On the other hand, the bare soil areas were affected by erosion of surface materials, toe cutting, etc. In the case of Tripura, it is identified that the bareness is highest at the top of the hills (Fig.6l.). The high value of NDWI indicates the presence of water and moisture in the surface and soil. In case of Tripura, NDWI seems to be highest over the Jampui, Sakhan, and Longtarai ranges (Fig. 6m.). The phenomena, along with less SBD, have created the landslide situation by increasing the chance of oversaturation of soil and debris layer on the slope.
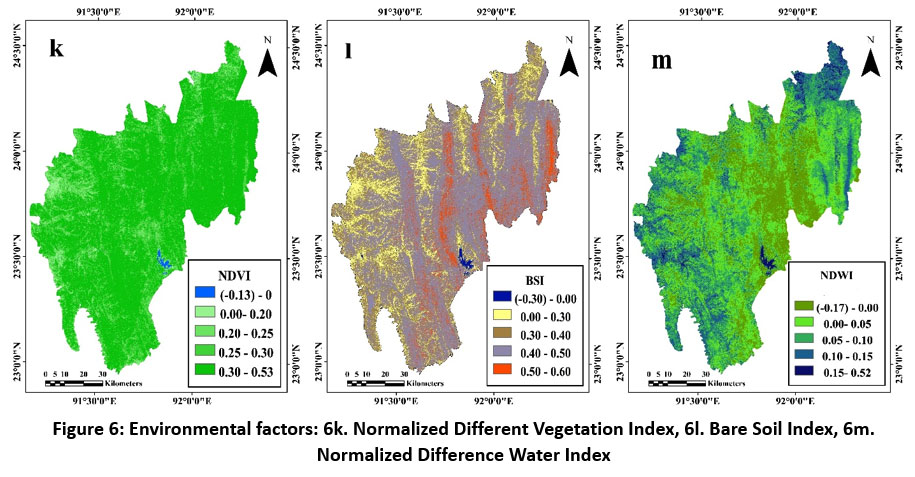 | Figure 6: Environmental factors: 6k. Normalized Different Vegetation Index, 6l. Bare Soil Index, 6m. Normalized Difference Water Index
|
Anthropogenic factor: In Tripura, the hundred-meter proximity of the road is the most vulnerable, as about 22% of the landslides between 2000 and 2022 occurred in this section (Fig.7n). In the case of land used, scrubland, bare land, roads, and settlements were given maximum weightage, and water bodies, agricultural fields, and natural vegetation were assigned less. In comparison, the plantation and jhum fields were given moderate. The LULC categories are natural vegetation, jhum, plantation, cropped land, water bodies, settlement, scrubland, bare lands, and jhum covers an area in percentages of 55.53, 17.62, 13.08, 5.71, 2.24, 2.05, 1.95, and 1.80 respectively (Fig.7o.).
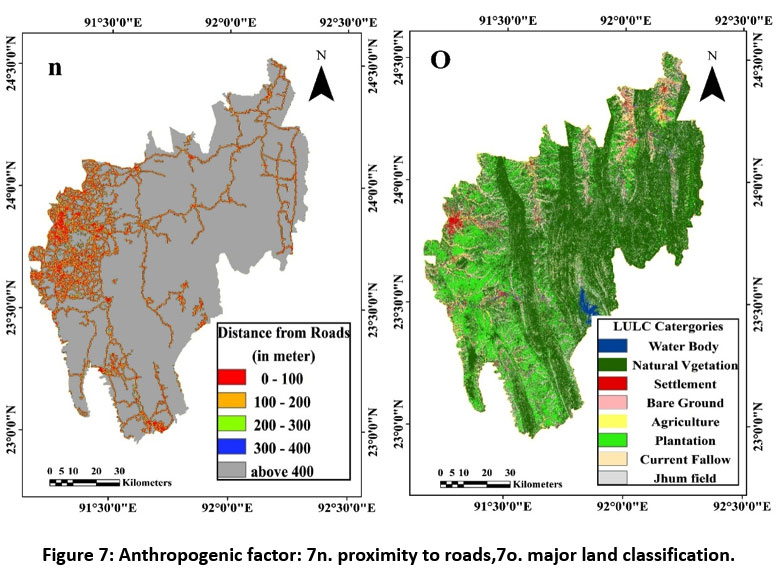 | Figure 7: Anthropogenic factor: 7n. proximity to roads,7o. major land classification.
|
Table 2: Weightages assigned to causative factors using AHP, FR, and RF models
Sl. No | Causative | Class | Pixels (%) | Landslide | FR | FR weightage | Subclass | AHP | RF degree of |
1 | Elevation | below 40 | 24.36 | 1.649 | 0.068 | 4.949 | 0.052 | 0.172 | 10.60 |
40-80 | 36.18 | 12.158 | 0.336 | 0.091 | |||||
80-120 | 33.45 | 37.276 | 1.114 | 0.159 | |||||
120-300 | 4.966 | 26.908 | 5.419 | 0.237 | |||||
above 300 | 1.028 | 22.007 | 21.41 | 0.461 | |||||
2 | Slope (in degree) | below 5 | 40.67 | 10.760 | 0.265 | 4.089 | 0.020 | 0.123 | 12.90 |
5-10 | 30.52 | 16.564 | 0.543 | 0.190 | |||||
10-15 | 17.76 | 21.566 | 1.214 | 0.156 | |||||
15-20 | 8.523 | 27.512 | 3.228 | 0.256 | |||||
above 20 | 2.525 | 23.596 | 9.342 | 0.378 | |||||
3 | Relative Relief (in meters) | below 15 | 46.38 | 13.949 | 0.301 | 4.053 | 0540 | 0.803 | 7.80 |
15-30 | 31.83 | 14.184 | 0.446 | 0.091 | |||||
30-60 | 14.84 | 22.478 | 1.514 | 0.139 | |||||
60-120 | 5.263 | 27.804 | 5.283 | 0.251 | |||||
above 120 | 1.670 | 21.583 | 12.92 | 0.444 | |||||
4 | TPI (landform class) | Deep valley | 6.844 | 16.245 | 2.373 | 4.772 | 0.193 | 0.069 | 7.11 |
Upslope drainage | 25.61 | 22.800 | 0.890 | 0.108 | |||||
Plains | 40.94 | 4.266 | 0.104 | 0.076 | |||||
Tillas | 21.33 | 7.402 | 0.347 | 0.160 | |||||
Hills | 5.262 | 25.402 | 4.828 | 0.216 | |||||
Hill ridges | 1.065 | 24.522 | 23.02 | 0.247 | |||||
5 | Lithology | Present days | 4.302 | 2.657 | 0.618 | 3.113 | 0.061 | 0.058 | 5.70 |
Dhupitila | 14.46 | 11.456 | 0.792 | 0.134 | |||||
Tipam | 44.47 | 23.780 | 0.535 | 0.115 | |||||
Bokabil | 30.23 | 36.890 | 1.220 | 0.443 | |||||
Bhuban | 6.526 | 25.215 | 3.864 | 0.247 | |||||
6 | Lineament density (per sq.km) | below 0.8 | 2.936 | 8.341 | 2.841 | 2.335 | 0.055 | 0.049 | 5.80 |
0.8-1.2 | 11.70 | 16.871 | 1.441 | 0.153 | |||||
1.2-1.6 | 58.72 | 21.583 | 0.368 | 0.101 | |||||
1.6-2.0 | 18.45 | 22.149 | 1.200 | 0.275 | |||||
above 2.0 | 8.185 | 31.055 | 3.794 | 0.416 | |||||
7 | SBD | below 129 | 0.941 | 1.012 | 1.076 | 2.880 | 0.369 | 0.057 | 7.10 |
129-133 | 13.21 | 42.521 | 3.217 | 0.290 | |||||
133-137 | 22.05 | 14.566 | 0.660 | 0.176 | |||||
137-141 | 29.79 | 26.290 | 0.882 | 0.101 | |||||
above 141 | 33.98 | 15.661 | 0.459 | 0.064 | |||||
8 | Annual rainfall (in mm) | below 1600 | 2.936 | 5.261 | 1.792 | 1.849 | 0.069 | 0.063 | 5.07 |
1600-1700 | 11.79 | 1.754 | 0.150 | 0.103 | |||||
1700-1800 | 58.71 | 49.253 | 0.839 | 0.135 | |||||
1800-1900 | 18.45 | 33.209 | 1.800 | 0.208 | |||||
above 1900 | 8.185 | 10.522 | 1.286 | 0.485 | |||||
9 | Proximity to streams (in meters) | 100 m. | 8.37 | 13.436 | 1.604 | 1.030 | 0.667 | 0.052 | 4.50 |
100-200 m. | 7.90 | 11.071 | 1.401 | 0.160 | |||||
200-300 m. | 8.81 | 9.987 | 1.133 | 0.071 | |||||
300-400 m. | 7.03 | 4.961 | 0.705 | 0.041 | |||||
Above 400 m. | 67.8 | 60.545 | 0.892 | 0.051 | |||||
10 | SPI | below 2 | 6.44 | 6.882 | 1.067 | 1.692 | 0.063 | 0.057 | 7.30 |
2-4 | 39.9 | 30.284 | 0.759 | 0.126 | |||||
4-6 | 45.0 | 41.629 | 0.924 | 0.256 | |||||
6-8 | 7.92 | 19.345 | 2.442 | 0.502 | |||||
above 8 | 0.69 | 1.860 | 2.821 | 0.046 | |||||
11 | NDVI | below 0 | 2.33 | 0.235 | 0.101 | 3.987 | 0.065 | 0.056 | 5.30 |
0.0-0.20 | 18.31 | 5.655 | 0.309 | 0.252 | |||||
0.20-0.25 | 30.05 | 19.745 | 0.657 | 0.103 | |||||
0.25-0.30 | 33.23 | 25.117 | 0.756 | 0.183 | |||||
above 0.30 | 16.05 | 49.246 | 3.066 | 0.379 | |||||
12 | BSI | below 0.2 | 31.89 | 0.188 | 0.006 | 4.469 | 0.043 | 0.055 | 5.70 |
0.20-0.30 | 28.00 | 3.393 | 0.121 | 0.237 | |||||
0.30-0.40 | 20.37 | 12.205 | 0.599 | 0.322 | |||||
0.40-0.50 | 11.06 | 26.531 | 2.399 | 0.277 | |||||
above 0.50 | 8.668 | 57.681 | 6.654 | 0.121 | |||||
13 | NDWI | below 0.00 | 10.31 | 15.504 | 1.503 | 1.000 | 0.065 | 0.036 | 5.03 |
0.00-0.05 | 28.80 | 36.239 | 1.258 | 0.057 | |||||
0.05-0.10 | 36.90 | 28.134 | 0.762 | 0.077 | |||||
0.10-0.15 | 20.62 | 17.672 | 0.858 | 0.353 | |||||
above 0.15 | 3.374 | 2.450 | 0.726 | 0.513 | |||||
14 | Proximity to roads (in meters) | below 50 | 1.132 | 23.327 | 20.10 | 3.903 | 0.291 | 0.043 | 7.20 |
50-100 | 2.065 | 6.276 | 3.039 | 0.059 | |||||
100-150 | 1.043 | 6.889 | 6.612 | 0.081 | |||||
150-200 | 1.663 | 3.581 | 2.389 | 0.032 | |||||
more than 200 | 94.10 | 6.085 | 0.639 | 0.032 | |||||
15 | LULC | Water bodies | 2.24 | 1.094 | 0.488 | 3.589 | 0.098 | 0.027 | 2.90 |
Natural Vegetation | 55.53 | 54.744 | 0.956 | 0.096 | |||||
Settlements | 2.04 | 0.772 | 0.377 | 0.042 | |||||
Bare ground | 1.79 | 11.869 | 6.605 | 0.242 | |||||
Agricultural land | 5.71 | 5.532 | 0.969 | 0.025 | |||||
Plantations | 13.0 | 2.573 | 0.197 | 0.142 | |||||
current fallow | 1.96 | 1.737 | 0.886 | 0.034 | |||||
Jhum field | 17.6 | 21.679 | 1.231 | 0.321 |
According to frequency ratio-based estimation of weightage among all the causative factors, elevation has computed maximum (4.949) followed by TPI landform class (4.772), BSI slope (4.089), relative relief (4.053), NDVI, proximity to roads, LULC, lithology, SBD, lineament density, annual rainfall, SPI, proximity to streams, and NDWI. In this case, AHP weightage estimation shows elevation (0.172) as maximum, followed by the slope (0.123), RR (0.080) and TPI (0.069), Average rainfall, lithology, SBD, SPI, NDVI, BSI, LD, PS, PR, NDWI, and LULC. Whereas RF computation shows slope scored highest (12.90% degree of importance) followed by elevation (10.60%), RR (7.99%), SPI, PR, TPI, SBD, LD, Lithology, BSI, NDVI, AR, NDWI, PS, and LULC respectively (Table 2).
Discussion
The elevation along with slopes and relative relief are the direct causative factors and, with higher differences in values, lead to landslides as kinetic energy is stored in slope material, and the higher the down-sloping forces, when it is detached from the side wall of the hill, its destruction forces will be higher 57. The varying surface information of physiographical setups and topographic units also carries out the variation in TPI. Extreme negative and positive TPI values indicate the position of successive ridges and valleys at higher altitudes, and the lesser values indicate the plains. In Tripura, the combination of high altitude, maximum slope, RR, and TPI leads to appropriate conditions for landslides. This topographic composition is predominantly observed in hilly parts of the states, covering the total area of 22.83 %. Tripura’s hills consist of various grades of shale, sandstone, mudstone, and sand rocks in thinly based lithologic formations of Bhuban, Bokabil, Tipam, and Dhupitila. These formations were developed under maritime, shallow fluvial-maritime conditions and did not get the proper hardening time. Therefore, most of the exposed rocks such as shale, laminated shale sandstone, buff-coloured sandstone, siltstone, and mud/claystone are soft enough for the faster
rate of weathering and mass wasting (Fig. 4e.)35. As the laminated shale, sandstone and buff-coloured sandstone are not very resistant in nature and are found in landslide debris. Therefore the Tipam, Bokabil, and Bhuban formations are identified as the highest landslide-occurring geologic rock groups during field observation. Subsequently, in calculation of AHP, these rock groups are highly preferred. As the high presence of faults and lineaments weakens the area, lineament distribution positively correlates with landslide probability, prone to severe landslides. In the past, the most reported landslides were due to surface instability and water shipping31.The Steam Power Index, proximity to streams, and rainfall distribution are considered to understand the hydrological influence of landslide susceptibility. The precipitation is drained according to topography in the form of sheet flow and streams, and the surface materials are eroded by surface flow. Thus, the probable topography-driven erosional power of the surface flow has been estimated by the Stream Power Index (SPI). It was observed in the field survey that the nearer the distance to a river, the higher the chance of toe cutting from the streams and the higher erosion, slope instability, and susceptibility of landslide32. The presence of flowing water as erosional agents cut down the slope to make slope unstable and cause to landslides. The thirty years rainfall data collected from the IMD, shows that the hills and tillas receive rain more than 1700 mm and it covers an area of 85.34% in the study area. Hence, the rainy season is observed as the most vulnerable season in terms of the high occurrence of landslides. The bare soil was affected by the erosion of surface materials, toe-cutting, etc. In the case of Tripura, it is identified that the bareness is highest of 0.50 BSI (covering an area of 8.66%) combined with hilly steep slopes are mainly associated with a landslide. This adverse environmental phenomenon occurred due to the anthropogenic modification of landscapes such as slash and burn agricultural practices (jhuming) and deforestation. High NDWI phenomena and less SBD created the landslide situation by increasing the chance of oversaturation of soil and debris layer on the slope9,31. It has become one of the most viable factors for landslides. On the other hand, in the current world scenario, humans are trying to occupy as much land as possible. Humans have tried to endeavour against opposing situations like remoteness, inaccessibility in hills, inaccessible land, etc., by imposing artificial land use and land cover over exis ting natural settings. In Tripura, types of activity such as clearing vegetation and forest cover for jhumming, earth and rock excavation, and road building have exacerbated the landslide susceptibility of the state. For investigation of the status of forest cover, road, and settlement vulnerability, the proximity to the road and LULC were taken into consideration. The proximity to roads is considered as highly susceptible as these areas have developed on toe-cutting areas of hill slopes and are characterized by continuous vibration from heavy vehicles, deforestation, and unmortared roadside drainage, causing instability of slope and leading to slope collapse and landslide 29 28 (Fig.7n.).
Analysis of Landslide Susceptibility of Tripura through AHP, FR and RF Models
Based on the above-discussed causative factors, the landslide susceptibility assessment of Tripura has been computed using the MCDM technique of AHP and a bivariate statistical method of Frequency Ratio andthe machine learning method of the Random Forest . Tables 2 and 3 show the assigned weightage of each landslide causative factor estimated from the following landslide susceptibility models.
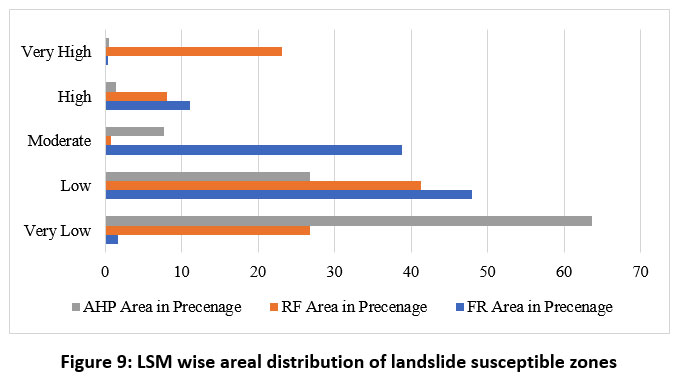
FR is used to study Tripura's landslide susceptibility. The Geological Survey of India, Landslide Inventory, and Tripura State Disaster Management records showed 76 landslide-affected areas in Tripura state in the last two decades based on field investigations. Each factor was reclassified, and the area of each class and landslide area were estimated. The frequency ratio was calculated by combining these two. The FR value near one or more indicates the average effectiveness of factors on landslide occurrences; the higher the value, the more correlated the factors and landslide susceptibility. Among the factors, the slope was estimated to have the highest weightage, followed by elevation, relative relief, stream power, landforms (TPI), soil bulk density, proximity to roads, etc. The higher class of each factor contains more landslide pixels in FR calculation. The landslide susceptible areas are delineated into five classes: very low susceptible area, low susceptible area, moderate susceptible area, high susceptible area, and very high susceptible area, and their coverage of 1.71%, 47.94%, 38.87%, 11.10%, and 0.36% respectively (Fig. 9.). LSZ areas indicates that the state has significantly less amount of landslide susceptible zones, situated on the hills of Jampui, Longtarai, and Sakhan and in the vicinity of where the Gomati River crosses the Baramura and Atharamura (Fig.8a.).
AHPis another method in which the reclassified raster thematic layers of causative factors have been weighted and overlayed in GIS software. Weightage for each causative factor was calculated based on the individual importance given according to Saaty’s scale. Landslide susceptibility zonation has been made in a hierarchical decision-making framework, within which each factor’s importance is evaluated based on the relative value or priority of each causative factor58. The priority was assigned among two factors successively, including how the individual factors influenced the landslide susceptibility. Based on that, the pairwise comparison matrix (PCM) was constructed, from which the weights of each causative factor were calculated.
Table 3: Comparison matrix of causative factors
CF | Elv | Slp | RR | TPI | Lith | LD | SBD | SPI | PS | Rain | NDVI | BSI | NDWI | PR | LULC |
Elv | 1 | 4 | 3 | 3 | 3 | 4 | 3 | 3 | 3 | 2 | 3 | 2 | 3 | 3 | 4 |
Slp | 1 | 4 | 4 | 2 | 2 | 2 | 4 | 3 | 3 | 3 | 2 | 4 | 4 | 3 | |
RR | 1 | 3 | 3 | 2 | 2 | 2 | 2 | 1 | 2 | 1 | 2 | 2 | 2 | ||
TPI | 1 | 2 | 3 | 2 | 2 | 2 | 1 | 1 | 1 | 2 | 1 | 3 | |||
Lith | 1 | 3 | 2 | 1 | 1 | 1 | 1 | 2 | 1 | 2 | 1 | ||||
LD | 1 | 1 | 1 | 1 | 1 | 2 | 2 | 1 | 3 | 2 | |||||
SBD | 1 | 2 | 2 | ½ | 3 | ½ | 2 | 2 | 2 | ||||||
SPI | 1 | 3 | 3 | ½ | 3 | 2 | 1 | 2 | |||||||
PS | 1 | 1 | ½ | 2 | 3 | 3 | 2 | ||||||||
Rain | 1 | 2 | 1 | 1 | 2 | 2 | |||||||||
NDVI | 1 | 3 | 2 | 1/3 | 3 | ||||||||||
BSI | 1 | 2 | 3 | 2 | |||||||||||
NDWI | 1 | 1 | 2 | ||||||||||||
PR | 1 | 3 | |||||||||||||
LULC | 1 | ||||||||||||||
CA | 0.91 | 1.29 | 1.21 | 1.24 | 1.09 | 1.10 | 1.13 | 1.32 | 1.18 | 1.03 | 1.30 | 1.14 | 0.98 | 1.21 | 0.91 |
weight | 0.174 | 0.123 | 0.083 | 0.069 | 0.058 | 0.049 | 0.057 | 0.063 | 0.052 | 0.057 | 0.056 | 0.055 | 0.036 | 0.043 | 0.027 |
Where, max=17.108, Consistency Index= 0.1505, Random Index=1.59. CF=causative factors, Elv=elevation, Slp=Slope, RR= Relative Relief, TPI= Topographic Position Index, Lith=Lithology, LD=Lineament Density, SBD= Soil Bulk Density, SPI= Stream Power Index, PS= Proximity to Streams, Rain= Mean annual rainfall, NDVI= Normalized Difference Vegetation Index, NDWI= Normalized Difference Water Index,BSI= Bare Soil Index, PR= Proximity to Road, LULC= Land Use Land Cover.
These weights are defined using expert judgments in Satty’s scale and employing a pairwise comparisons matrix 48. The scale value ranges from 9 to 0, where 9 represents more importance of one variable than other variables, and 1 represents equal importance of both variables. The consistency ratio shows the correctness of the calculated AHP weightage. The accepted consistency ratio of the AHP is less than 0.1 (10%) 50. In this case, the estimated CR is for fifteen variables that are 0.0946 (CR= CI/RI), which is less than the prescribed value of 0.1; therefore, the AHP model is considered more suitable to assess the landslide susceptibility zones.
According to the computed weightage, elevation, slope, relative relief, TPI, SPI, and SBD are the most influencing factors. The estimated areal distribution of AHP is as follows: the distribution of Landslide Susceptibility classes, which have coverage of 63%, 26%, 7%, 1.4% and 0.4% area of Tripura as categorized into very low, low, moderate, high, very high LSZ respectively (Fig.9.). According to AHP, the very high and high LSZ are confined into the high elevated hills of Jampui, Sakhan, and in the ridge section of Longtarai and Atharamura hill ranges (Fig. 8b).
The RF LSM model was performed using an ML algorithm. The past landslide polygons were used to train the RF model and derive the landslide susceptibility maps (LSM)59. The RF model used the causative factors as inputs and predicted the landslide susceptibility accordingly. RF model can generate multiple decision trees (DT) from the given causative factors and past landslides60. Tripura, the hyper-tuning technique, has been used to determine the best 97 decision trees. The final LSM has been produced based on the voting of importance (VI) of each causative factor from each DT. The VI denotes the degree of influence (DoI) of factors in landslide susceptibility in percentage. Among all the factors, slope has the highest DoI (12.99%), followed by elevation (10.6%), SPI (7.47), TPI (7.22%), SBD (7.22%), proximity to the road (7.22%), BSI (5.86%). The LULC has the lowest DoI. The estimated areal distribution on the RF model is as follows: 26 % and 41% fall under very low and low Landslide Susceptible Zones (LSZ) respectively. Notably, only 0.7% are moderate, but 7% and 23% are estimated to be under high and very high LSZ (Fig.9.). In the RF model, hill ranges of Jampui, Sakhan, Longtarai, Atharamura, Baramura high land in western and southern parts. Tilla-lunga areas and fringes of upper flood plains are included into high and very high LSZ as those characterised by sharp changes in elevation and slope (Fig.8c.).
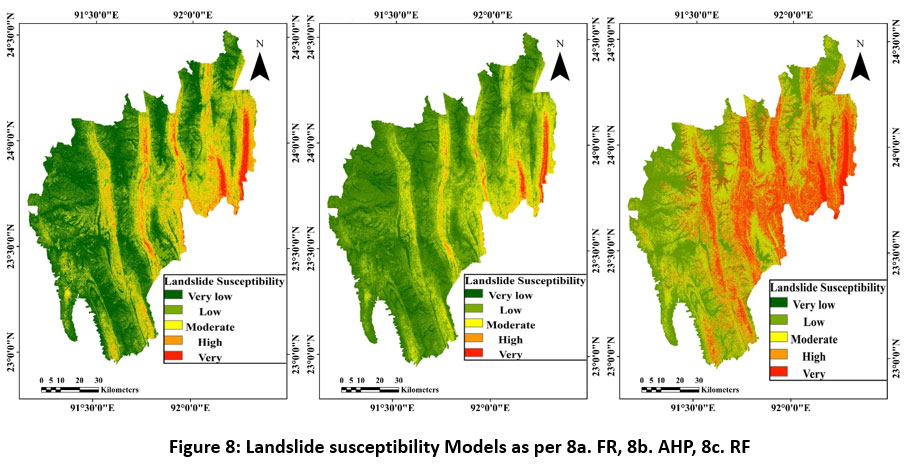 | Figure 8: Landslide susceptibility Models as per 8a. FR, 8b. AHP, 8c. RF
|
 | Figure 9: LSM wise areal distribution of landslide susceptible zones
|
Validation of AHP, FR, and RF Model
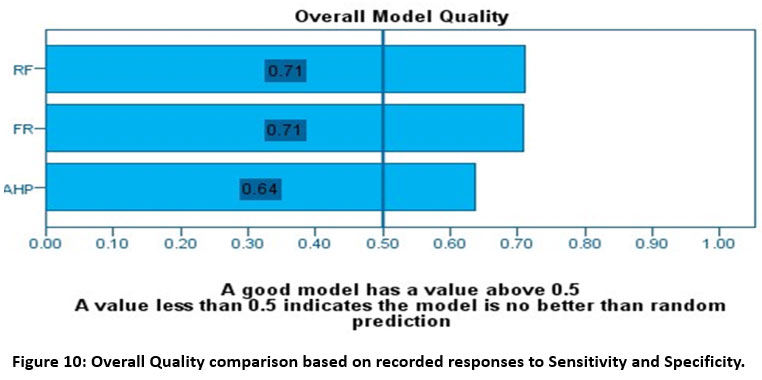
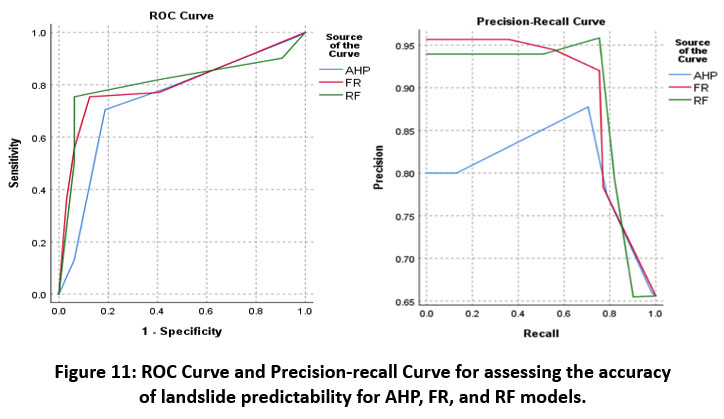
The accuracy of all the models is assessed with the help of the Receiver Operating Characteristic (ROC) analysis in SPSS. The assessment includes three elements: (1) Sensitivity and Specificity, (2) Precision-Recall Curve, and (3) Overall model accuracy. As discussed, the accuracy of the FR, AHP, and RF methods was estimated for landslide susceptibility mapping based on the AUC (Area under the ROC Curve) value. The AUC values for FR, RF, and AHP are 0.806, 0.810, and 0.744 (Fig.10). Overall, these three have an AUC higher than the random guess (0.5) and are classified as a good prediction (AUC ranging from 0.744-0.801). According to overall Model Quality, the model's reliability is 0.71 for both the RF and FR models and 0.64 for AHP; these are all classified under the good quality model as all estimates are greater than 0.5. Interestingly, the Precision-Recall Curve shows that the RF and FR methods outperformed similar ranges between 0.94 and 0.96, But the AHP goes downside, showing 0.80 (Fig.11.).
 | Figure 10: Overall Quality comparison based on recorded responses to Sensitivity and Specificity.
|
 | Figure 11: ROC Curve and Precision-recall Curve for assessing the accuracy of landslide predictability for AHP, FR, and RF models.
|
Conclusion
As per AHP, FR, and RF models, among all, the topographic factors are the most influencing factors, followed by environmental factors such as vegetation cover, the bareness of soil, and anthropogenic factors such as proximity to roads. From all three LSM models, it can be depicted that the very low and low landslide susceptibility zones (LSZ) occupying similar patterns of land uses, such as agricultural lands and water bodies, are mainly characterized by sloping riverine plains. Notably, in the AHP LSM model, low and very low landslide susceptible zones occupy 90.34%, whereas in FR and RF, LSM models occupy 49.65%. Under the moderate LSZ, AHP was categorized as 7.60 %, although FR delineated a maximum area of 38.87%, and FR model demarcated the lowest, 0.78%. The categories of high and very high LSZ AHP model demarcated the lowest area, 1.95%, followed by FR, 11.46%, and RF, 32.02% area, respectively (Fig. 9). In the case of AHP LSM modelling, elevation, slope, and relative relief were estimated as the most influencing factors in landslide occurrence, showing maximum LSZ along the hills of Jampui, Sakhan, ridge part of Longtarai, and Atharamura. The FR and RF model Frequency Ratio and Degree of Influence values indicate that all the factors combined affect landslide occurrence. FR model shows that high and very high areas are confined on hills and sparsely on steeply sloped tillas, whereas the RF model includes all steep sides of tillas, foothill regions, and hills (Table 3). The model's validation shows the RF model with the highest accuracy followed by FR, but AHP outperformed. It is also emphasized that the RF model is run on the cloud computation platform. It opens up another point of achievement and gets the highest accuracy, indicating its feasibility and flexibility by eliminating the burden of handling large amounts of geospatial data and high processing time. Notwithstanding, this study was devoted to suggesting potential LSM models. Still, it also indicates a promising solution for further research in the field of GIS-based landslide sensitivity zonation in Tripura. It is essential to improve the current understanding related to landslides and their different influencing conditioning factors, input spatio-temporal datasets, sampling methods, development of spatial Inventories of landslides, and advanced modelling. This paper’s potential contributions is enabling potential development of early warning systems of landslides and mitigation efforts not only based on knowledge-based approaches but also based on statistical evidence, machine learning, cloud computing, and other advancement, especially in the context of the highly dynamic and uncertain future of Earth.
Acknowledgement
The authors acknowledge State Disaster Management Authority, Government of Tripura, Geological Survey of India, Tripura-Mizoram state unit and the local communities for providing relevant information and data about landslides evens of the state. The first author is grateful to University Grants Commission, India for providing fellowship under the UGC-JRF Scheme during the preparation of this paper.
Funding Sources
The research is funded by UGC-JRF and the grant no is .210510412762
Conflict of Interest
The author(s) declares no conflict of interest.
Data Availability Statement
The manuscript incorporates all datasets produced or examined throughout this research study
Ethics Approval Statement
Not required since this study not involves any animal or humans.
Authors’ Contribution
Debasis Das, Kausik Panja and Manika Mallick wrote the fundamental frameworks, methods datasets and interpretation of results. Moumita Hati, Deepa Rai, Atoshi Chakma contributed to the mapping and layout all the figures, and diagrams. Professor Y.V. Krishnaiah provided the valuable instruction to frame the work and field expertization in these work. All the authors contributed to the interpretation and reviewed the manuscript
References
- White G.F, Kates R.W, Burton I. Knowing better and losing even more: the use of knowledge in hazards management. Global Environmental Change Part B: Environmental Hazards. 2001;3(3): 81-92. https://doi.org/10.1016/S1464-2867(01)00021-3.
CrossRef - Schuster R. L, Wieczoreck G. F. Landslide triggers and types. Paper presented at 1st European Conference on Landslides.24-26 June 2002;59-78. London.
CrossRef - Petley D. Global patterns of loss of life from landslides. Geology.2012; 40 (10): 927–930. doi: https://doi.org/10.1130/G33217.1
CrossRef - CRED (2021) Disasters in numbers. Brussels: CRED; 2022. https://cred.be/sites/default/files/2021_ EMDAT_report.pdf
- UNDRR, Annual Report. 2019. https://www.undrr.org/media/47138/download?startDownload=true
- Froude M. J,Petley D. N. Global fatal landslide occurrence from 2004 to 2016. Natural Hazards and Earth System Sciences.2018; 18(8): 2161-2181.https://doi.org/10.5194/nhess-18-2161-2018,
CrossRef - Stäubli A, Nussbaumer S.U, Allen S.K, Huggel C, Arguello M, Costa F, Hergarten C, Martínez R, Soto J, Vargas R, Zambrano E. Analysis of weather-and climate-related disasters in mountain regions using different disaster databases. Mal S, Singh R.B, Huggel C.Climate change, extreme Events and disaster risk reduction: towards sustainable development goals.2018; 17-41.https://doi.org/10.1007/978-3-319-56469-2_2
CrossRef - Jain N, Roy P, Martha T.R, Jalan P, Nanda A. Landslide Atlas of India (Mapping, Monitoring and R&D studies using Remote Sensing data). NRSC special publication. NRSC/ISRO.2023; Document number: NRSC-RSA-GSG-GMED-FEB 2023-TR-0002167-V1.0.
- Martha T. R, Roy P, Jain N, Khanna K, Mrinalni K, Kumar K. V, Rao P. V. N.Geospatial landslide inventory of India—an insight into occurrence and exposure on a national scale. Landslides, 2021; 18(6): 2125-2141. https://doi.org/10.1007/s10346-021-01645-1
CrossRef - Anbazhagan P, Mog, K., Rao K. S. N, Prabhu S.N, Agarwal P, Reddy G. R, Ghosh S, Deb M.K, Baruah S, Das SK. Reconnaissance report on geotechnical effects and structural damage caused by the 3 January, 2017 Tripura earthquake, India. Natural Hazards. 2021; 98:425-450. doi: 10.1007/S11069-019-03699-W
CrossRef - Ghosh K, Bandyopadhyay S, De S.K. A Comparative Evaluation of Weight-Rating and Analytical Hierarchical (AHP) for Landslide Susceptibility Mapping in Dhalai District, Tripura. In: Hazra S., Mukhopadhyay A., Ghosh A., Mitra D., Dadhwal V.K.Environment and Earth Observation. Remote Sensing/Photogrammetry.Switzerland:Springer;2017: 175-193 https://doi.org/10.1007/978-3-319-46010-9_12
CrossRef - Sen S, Mitra S, Debbarma C, De S. K. Impact of faults on landslide in the Atharamura Hill (along the NH 44), Tripura. Environmental Earth Sciences, 2015; 73: 5289-5298.
CrossRef - Ghosh K, Bandyopadhyay S, De S. K. Geophysical investigation and management plan of a shallow landslide along the NH-44 in Atharamura Hill, Tripura, India. International Journal of Georesources and Environment-IJGE (formerly Int'l J of Geohazards and Environment).2016;2(3): 119-130.
CrossRef - NITI Aayog. (2018). Contributing to Sustainable Development of the Indian Himalayan Region: Key message from five thematic reports and way forward. A summery Report, Niti Aayog, Government of India. 44.
- Phukan R., Saha D. Analysis of rainfall trends over Tripura. Mausam, 2022; 73(1): 27-36.
CrossRef - Singh A, Thakur S, Adhikary N.C. Analysis of spatial and temporal rainfall characteristics of the North East region of India. Arab J Geosci.2021;14: 885. https://doi.org/10.1007/s12517-021-07266-1
CrossRef - Hazarika M, Ramesh N. R, Poddar B. C, Javed S, Sanathana Y. S, Dalavi H. Geo-archaeological Explorations in Tripura (2018–2019): A Report. Man and Environment. 2021; 45: 18-38. https://www.academia.edu/44308257
- Reza S. K, Ray P, Alam N. M, Mukhopadhyay S, Singh S. K, Ray S. K. Soil properties-landform relationship in Purvanchal range of Tripura, Northeastern India: An implication of pedogenesis. Journal of the Geological Society of India. 2022; 98(3): 402-410.
CrossRef - Sengupta A, Nath S. K. GIS-Based Landslide Susceptibility Mapping in Eastern Boundary Zone of Northeast India in Compliance with Indo-Burmese Subduction Tectonics. Geospatial Technology for Environmental Hazards: Modeling and Management in Asian Countries. 2022;19-37. https://doi.org/10.1007/978-3-030-75197-5_2
CrossRef - Das S, Sarkar S, Kanungo D.P. A critical review on landslide susceptibility zonation: recent trends, techniques, and practices in Indian Himalaya. Nat Hazards. 2023; 115:23-72. https://doi.org/10.1007/s11069-022-05554-x
CrossRef - Sonker I, Tripathi J.N, Swarnim. Remote sensing and GIS-based landslide susceptibility mapping using frequency ratio method in Sikkim Himalaya. Quaternary Science Advances. 2022; 8(10): 100067. https://doi.org/10.1016/j.qsa.2022.100067.
CrossRef - Calcaterra D, Parise M, Palma B. Combining historical and geological data for the assessment of the landslide hazard: a case study from Campania, Italy. Natural Hazards and Earth System Sciences. 2003; 3(1/2): 3-16.
CrossRef - Kumar S., Mondal P., Sarkar S., Gautam A. K. Landslide susceptibility assessment in parts of the Western Ghats of India using frequency ratio, statistical index, and logistic regression models. Bulletin of Engineering Geology and the Environment. 2021;80(4): 3109-3124. doi: 10.1007/s10064-020-02003-5
- Shankar R, Satyam G.P, Singh P.K. Impact of geomorphometric parameters on the occurrence and distribution of landslides in Yamuna River Basin, North-Western Himalaya, India. J. Mt. Sci.2022; 19: 2374–2396 https://doi.org/10.1007/s11629-021-7081-z
CrossRef - Dikshit A, Sarkar R, Pradhan B, Segoni S, Alamri A. M. Rainfall Induced Landslide Studies in Indian Himalayan Region: A Critical Review. Applied Sciences.2020;10(7):2466. https://doi.org/10.3390/app10072466
CrossRef - Kumar A, Goyal R, Pradhan B. Effect of vegetation on slope stability: a case study from Western Ghats, India. Environmental Earth Sciences.2018; 77(15): 1-17. doi: 10.1007/s12665-018-7739-9
- Adak K, Pal S.K. Geotechnical Investigation of Landslide of Atharamura and Baramura Hill, Tripura. In: Sitharam, T.G., Jakka, R., Govindaraju, L. (eds) Local Site Effects and Ground Failures. Lecture Notes in Civil Engineering. Singapore. Springer. 2021: 117. https://doi.org/10.1007/978-981-15-9984-2_17
CrossRef - Hearn G. J, Shakya N. M. Engineering challenges for sustainable road access in the Himalayas. Quarterly Journal of Engineering Geology and Hydrogeology. 2017;50:69-80 https://doi.org/10.1144/qjegh2016-109
CrossRef - Kedovikho Y, Krishnaiah Y. V. Assessing landslide vulnerability in Kohima city, Nagaland: A geospatial approach. National Geographical Journal of India, 2020; 66(3): 274-287.
CrossRef - Budimir M.E.A, Atkinson P.M, Lewis H.G. A systematic review of landslide probability mapping using logistic regression. Landslides. 2015; 12: 419–436. https://doi.org/10.1007/s10346-014-0550-5
CrossRef - Gómez D, García E.F, Aristizábal E. Spatial and temporal landslide distributions using global and open landslide databases. Nat Hazards. 2023; 117: 25–55. https://doi.org/10.1007/s11069-023-05848-8
CrossRef - Kaur H, Gupta S, Parkash S. Comparative evaluation of various approaches for landslide hazard zoning: a critical review in Indian perspectives. Spat. Inf. Res. 2017; 25: 389–398. https://doi.org/10.1007/s41324-017-0105-7
CrossRef - European Space Agency, Sinergise. Copernicus Global Digital Elevation Model. Distributed by OpenTopography. 2021.https://doi.org/10.5069/G9028PQB. Accessed: 2024-02-18
- Landsat 9 OLINational Aeronautics and Space Administration (NASA):NASA: USGS Earth explorer. [01.01.2022-31.12.2022]. [Path-136 ] [Row-43/44] data product (C-2, L2), image collection . Accessed [11.12.2023].https://earthobservatory.nasa.gov/Landsat-9 OLI.
- Geological Data, Bhukosh portal. Geological survey of India. (GSI). Vectorized datasets. Accessed [11.12.2023].https://bhukosh.gsi.gov.in/Bhukosh/Public
- Ross C, Prihodko L, Anchang J. HYSOGs250m, global gridded hydrologic soil groups for curve-number-based runoff modeling. Sci Data.2018; 5: 180091. https://doi.org/10.1038/sdata.2018.91
CrossRef - Das D. 2023. Land Use/Land Cover Map of Tripura, India, Generated from Landsat 8 OLI Data using Google Earth Engine (Version-7.3). Scale 1:50,000. Resolution: 30 meters. Unpublished.
- OpenStreetMap contributors [2023]. OpenStreetMap road network data (Planet dump) [daily]. Retrieved [2023-08-01]. https://www.openstreetmap.org
- India Meteorological Department (IMD). [2023]. Yearly Gridded Rainfall (0.25 x 0.25 degree) data NetCDF File. Retrieved April 5, 2023, from https://cdsp.imdpune.gov.in/
- Geological Survey of India (GSI). [Year]. Landslide Points. Bhukosh portal. Retrieved April 5, 2024. https://bhukosh.gsi.gov.in/Bhukosh/ MapViewer.aspx
- Pai D.S, Latha S, Rajeevan M, Sreejith O.P, Satbhai N.S, Mukhopadhyay B. Development of a new high spatial resolution (0.25° X 0.25°)Long period (1901-2010) daily gridded rainfall data set over India and its comparison with existing data sets over the region; Mausam,2014; 65(1): 1-18.
CrossRef - Wadhawan S.K. Landslide Susceptibility Mapping, Vulnerability and Risk Assessment for Development of Early Warning Systems in India. In: Pradhan, S., Vishal, V., Singh, T. (eds) Landslides: Theory, Practice and Modelling. Advances in Natural and Technological Hazards Research.2019; 50. Springer, Cham. 2019; 50.
- Shano L, Raghuvanshi T.K, Meten, M. Landslide susceptibility evaluation and hazard zonation techniques – a review. Geoenviron Disasters. 2020; 7(18): 1-19. https://doi.org/10.1186/s40677-020-00152-0
CrossRef - Mirdda H.A, Bera S, Siddiqui M.A, Singh B. Analysis of bi-variate statistical and multi-criteria decision-making models in landslide susceptibility mapping in lower Mandakini Valley, India. GeoJournal.2020; 85: 681-701. https://doi.org/10.1007/s10708-019-09991-3
CrossRef - Sun D, Wen H, Wang D, Xu J. A random forest model of landslide susceptibility mapping based on hyperparameter optimization using Bayes algorithm, Geomorphology. 2020;362: 107201. https://doi.org/10.1016/j.geomorph.2020.107201
CrossRef - Goetz J. N, Brenning A, Petschko H, Leopold P. Evaluating machine learning and statistical prediction techniques for landslide susceptibility modeling. Computers & geosciences. 2015; 81: 1-11. https://doi.org/10.1016/j.cageo.2015.04.007
CrossRef - Jazouli El. A, Barakat A, Khellouk R. GIS-multicriteria evaluation using AHP for landslide susceptibility mapping in Oum Er Rbia high basin (Morocco). Geoenviron Disasters. 2019; 6: 3 (2019). https://doi.org/10.1186/s40677-019-0119-
CrossRef - Biswas B, Rahaman A, Barman J. Comparative Assessment of FR and AHP Models for Landslide Susceptibility Mapping for Sikkim, India and Preparation of Suitable Mitigation Techniques. J Geol Soc India. 2023; 99: 791–801. https://doi.org/10.1007/s12594-023-2386-x
CrossRef - Saaty T.L. The analytic hierarchy process: planning, priority setting, resource allocation. McGraw Hill. 1980 New York.
- Kumar R, Anbalagan R. Landslide susceptibility mapping using analytical hierarchy process (AHP) in Tehri reservoir rim region, Uttarakhand. Journal of the Geological Society of India,2016; 87:271-286.https://link.springer.com/content/pdf/10.1007/s12594-016-0395-8.pdf
CrossRef - Regmi A.D, Yoshida K, Pourghasemi H.R, Dhital M. R, Pradhan B. Landslide susceptibility mapping along Bhalubang — Shiwapur area of mid-Western Nepal using frequency ratio and conditional probability models. J. Mt. Sci. 2014; 11:1266–1285. https://doi.org/10.1007/s11629-013-2847-6
CrossRef - Abedini M, Tulabi S. Assessing LNRF, FR, and AHP models in landslide susceptibility mapping index: a comparative study of Nojian watershed in Lorestan province, Iran. Environ Earth Sci. 2018: 77: 405. https://doi.org/10.1007/s12665-018-7524-1
CrossRef - Yhoshü, K. Assessment of Landslide on a Highway Corridor: Case study from AH-1. Climate change and sustainable development (perspective from Northeast India) Edited book.2019: 198-208.
- Khaled T, Tao C, Yang Z. Mapping landslide susceptibility and types using Random Forest, Big Earth Data. 2018; 2(2): 159-178, DOI: 10.1080/20964471.2018. 1472392
CrossRef - Park S, Kim J. Landslide Susceptibility Mapping Based on Random Forest and Boosted Regression Tree Models, and a Comparison of Their Performance. Applied Sciences.2019; 9(5): 942. https://doi.org/10.3390/app9050942
CrossRef - Zhang W, He Y, Wang L, Liu S, Meng X. Landslide Susceptibility mapping using random forest and extreme gradient boosting: A case study of Fengjie, Chongqing. Geological Journal.2023; 58(6): 2372-2387. https://doi.org/10.1002/gj.468352.
CrossRef - Spinetti C, Bisson M, Tolomei C, Colini L, Galvani A, Moro M, Saroli M, Sepe V. Landslide susceptibility mapping by remote sensing and geomorphological data: case studies on the Sorrentina Peninsula (Southern Italy). GIScience & Remote Sensing. 2019;56(6): 940-965. DOI: 10.1080/15481603.2019.1587891
CrossRef - Anbalagan, R. (1992). Landslide hazard evaluation and zonation mapping in mountainous terrain. Engineering Geology, 1932; 32(4): 269-277.
CrossRef - Ado M, Amitab K, Maji A.K, Jasi?ska E, Gono R, Leonowicz Z, Jasi?ski M. Landslide susceptibility mapping using machine learning: A literature survey. Remote Sensing, 2022; 14(13):3029.
CrossRef - Dang V. H, Hoang N. D, Nguyen L. M. D, Bui D. T, Samui P. A novel GIS-based random forest machine algorithm for the spatial prediction of shallow landslide susceptibility. Forests.2020; 11(1): 118. https://doi.org/10.3390/f11010118
CrossRef


