Assessing the Heavy Metal Contamination Prevailing in Groundwater at Rishipur Village, West Bengal, India
Lovely Sarkar
*

1
Department of Chemistry,
Siliguri College, Siliguri, Darjeeling,
West Bengal,
India
http://dx.doi.org/10.12944/CWE.19.2.12
Copy the following to cite this article:
Sarkar L. Assessing the Heavy Metal Contamination Prevailing in Groundwater at Rishipur Village, West Bengal, India. Curr World Environ 2024;19(2). DOI:http://dx.doi.org/10.12944/CWE.19.2.12
Copy the following to cite this URL:
Sarkar L. Assessing the Heavy Metal Contamination Prevailing in Groundwater at Rishipur Village, West Bengal, India. Curr World Environ 2024;19(2).
Download article (pdf) Citation Manager Publish History

Introduction
Water is an essential component for all forms of floral and visceral life, obtained from two principal resources from nature: surface water (e.g., freshwater lakes, streams, rivers) and groundwater (boreholes, wells, etc.).1-2 Human activities are a significant source of metal pollutants in water sources, contributing to one of the most pressing environmental challenges today: groundwater contamination.3 Heavy-metal poisoning of water may result from both human activity and natural processes like improper disposal of agricultural and domestic waste directly into the land and water systems, the mobilization of heavy-metals to natural processes such as rock weathering, volcanic eruptions, biological activity, and geochemical interactions. Although metals: copper; selenium etc. are imperative for humans and their increased frequencies have perverse influence on living creatures. Conversely, chromium; and lead metals are very poisonous, even at very low concentrations4 and are found to be very deadly contaminants.3 Thus, heavy-metals, among the many pollutants impacting water excellence, pose a precise concern owing to their high poisonousness, even at modest concentrations.5 These toxins accumulate in the bodies of animals and humans, potentially causing serious diseases such as cancer.6 Contaminants such as heavy-metals, arsenic, fertilizers, chemical pesticides, and more are introduced into groundwater through activities like mining, solid biomass removal in landfills, improper industrial waste disposal, and agrochemical leaching.7 We are still not very aware of any studies on the groundwater quality of this studied area. It is imperative to thoroughly assess the groundwater quality in the area to ensure its suitability for drinking and to safeguard it from contamination.8 Krishnandu Kumar Pobi et al., in their research conducted in the Durgapur Industrial Zone, documented the occurrence of heavy-metals in the surrounding soil as well as water settlement, along with an initial estimation of their extent. In instances where the concentration of heavy-metals deviates frequently from the specified standard, either exceeding or falling below the desired levels, special attention is warranted.9 However, there is currently some researches available on the prevalence of various heavy-metals in potable water across West Bengal.10 Furthermore, extensive research has been undertaken on the seasonal alterations of heavy-metal congestion in the groundwater of Greater Kolkata, West Bengal. There has been limited research on the existence of various heavy-metals in distinct regions of West Bengal. Nevertheless, researchers have shown considerable interest in the prevalence of arsenic in different areas of West Bengal.11-12
The reason for the present study is the valid concerns raised by local residents regarding the quality of their drinking water source. Furthermore, there has been a noteworthy surge in the utilization of chemical pesticides and fertilizers compared to previous practices. The residents hold the belief that the water they used for household purposes was of inferior quality due to various reasons. They have noticed changes in the water's colour, smell, taste and density and have experienced several waterborne diseases and skin ailments indicating an overall decline in groundwater quality. Therefore, an investigation was carried out to inform the local community about the groundwater's excellence. The lack of existing studies on groundwater quality makes this evaluation all the more crucial. The current investigation attempts to comprehensively assess the amount of iron:Fe; zinc:Zn; copper:Cu; manganese:Mn; nickel:Ni; chromium:Cr; cobalt:Co and lead:Pb to determine, extent of contamination embedding month wise distinctions in quantity of the Environmentally Sensitive Elements (ESE) present in groundwater in the course of the assessment period of April 2021 to March 2022. The most effective approach for analysing the excellence of the experimental water is the Heavy-Metal-Pollution-Index; (HPI). Recent studies have shown that statistical methodologies in engineering, as well as the interpretation of symmetric or asymmetric distributions of the generated data, are gaining popularity in surface water chemistry investigations. These statistical techniques provide valuable data for analysis.
In this study, a detailed descriptive statistical analysis, including correlation coefficients and regression analysis, was conducted, to accurately predict the variation and dissemination pattern of experimental heavy- metals present in the groundwater samples in the research region. The study aims to conduct a thorough examination of heavy-metal levels in groundwater to ensure strict adherence to permissible limits. This will involve the application of advanced statistical techniques to assess groundwater dispersion. The results will be crucial in enabling the delivery of top-quality water for drinking and agricultural use to households and farms, and they will also provide valuable insights for developers and government agencies to determine the current contamination levels and adapt management strategies accordingly.
Materials and Methods
An assortment of 12 groundwater samples were extracted from a single dug well located in the study area. The sampling location, housing a dug well in the residential vicinity with close proximity to agricultural activities, was selected for a study aimed at assessing water quality. Sampling took place monthly, covering both the dry and rainy seasons from April 2021 to March 2022. The study area is situated at 24° 55' 45.3"N and 88° 15' 16.6"E at Rishipur village, West Bengal, India, as depicted by Figure 1.
The samples of water were collected in Borosil glass bottles. The glass bottles were dried out using a hot air furnace at 800°C for four hours prior to collecting the samples. The experimental water samples were filtered with the help of Grade 42; Whatman® filter paper, available from GE- Healthcare Companies; UK. The water samples were acidified with 2 ml of HNO3 to preserve them and stored in an icebox for future analysis. The analysis of groundwater samples was performed for the occurrence of heavy-metals by APHA13,1992 and Trivedy and Goel14 (1986).
Also, a thorough descriptive statistical analysis of the data was conducted, using methods such as regression and correlation coefficients, to accurately predict the changes and heavy-metal dispersion in the groundwater specimens of the research field.
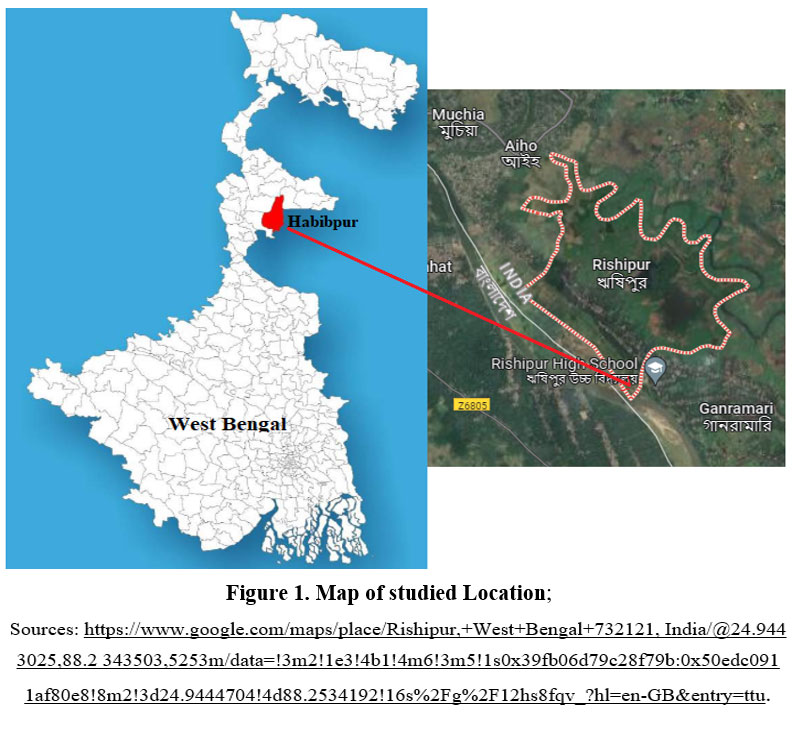 | Figure 1: Map of studied Location; Sources:
|
Assessment of Water Quality
Numerous academics and organisations are actively researching the existence of pollutants in water and studying their consequence on both the ecological system and animals. Through the determination of the heavy-metals’ quantity in the groundwater, crucial water quality characteristics are being ascertained. Researchers are generating valuable insights into water quality through a multitude of experimental results, while the degree of heavy-metals is very significant for the considerable reseach. Heavy-metal-pollution-index; (HPI), measurement has been appeared to serve as an advantageous approach for determining water integrity .
Through the HPI we can know about the overall water quality. This pollution index is calculated through equations (I) and (II) mentioned below.
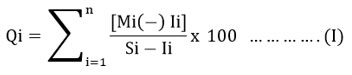
Mi indicates the measured value that is determined for the ith variable. Ii denotes the greatest intended value or the ideal value used for the ith variable. Si stands for the standard or allowed value associated with the ith variable. The (-) symbol signifies the statistical variation in value between the two, disregarding the semantic (-) symbol.15-17
Qi implies the subindex that is calculated for the ith variable, Wi specifies the unit weight allotted to the ith variable, n denotes the number of variables taken into account for the study. The experimental samples’ weight is established based on the significance of the variables allocated between one and zero. It is also perceived as inversely proportional to the standard value of every single constituent.15-22 Further, water with a contamination index value exceeding 75 is unsuitable for consumption.
Water excellence based on HPI15
HPI Range | Water excellence |
< 100 | low level of heavy-metal contamination |
>100 | high level of heavy-metal contamination |
=100 | Heavy-metal contamination on the threshold menace |
To evaluate the HPI of the experimental water samples, the values of the heavy-matal content were considered using unit weight (Wi) and a standard acceptable value (Si) for the duration; April 2021 to March 2022.
In conducting the data analysis, various descriptive statistics were performed to thoroughly establish the distribution pattern of heavy-metals. Additionally, Pearson's correlation coefficients were utilised to investigate the source and association viewpoints. Furthermore, Multiple Linear Regression (MLR), a potent statistical method, was carried out to effectively assess the correlation between variables to provide information about distribution trends and patterns. The statistical test results were derived from a series of linear regression equations, as outlined below:
Y = a+b1X1+b2X2+…+bnXn
Where Y denotes a dependent variable, a signifies a constant, and b1, b2 indicates regression coefficient, and X1, X2 designate independent variables.
Results and Discussion
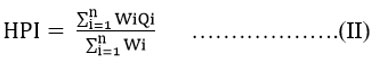
The current study has identified varying quantities of heavy-metals reported across different months of the year. These concentrations have been compared to the allowable limits set by WHO and BIS (Table 2). Table 1 precisely illustrates the month-to-month contents of experimental heavy-metals in the samples of groundwater. However, all investigated heavy-metals failed to meet their appropriate limits,23-27 potentially resulting in health-related issues, including chronic diseases. Figure 2 visually represents the monthly variation in heavy-metals found in the water sample.
Table 1: Month wise quantity of existing heavy-metals in the groundwater
Heavy metals (ppm) | Apr | May | Jun | Jul | Aug | Sep | Oct | Nov | Dec | Jan | Feb | Mar |
iron | 0.093 | 0.089 | 0.091 | 0.087 | 0.099 | 0.081 | 0.083 | 0.095 | 0.089 | 0.085 | 0.090 | 0.084 |
zinc | 0.057 | 0.051 | 0.053 | 0.016 | 0.001 | 0.013 | 0.046 | 0.054 | 0.059 | 0.054 | 0.048 | 0.053 |
copper | 0.021 | 0.029 | 0.023 | 0.018 | 0.016 | 0.041 | 0.051 | 0.058 | 0.068 | 0.071 | 0.085 | 0.089 |
manganese | 0.054 | 0.074 | 0.051 | 0.048 | 0.037 | 0.028 | 0.02 | 0.028 | 0.031 | 0.034 | 0.041 | 0.043 |
nickel | 0.068 | 0.067 | 0.059 | 0.074 | 0.062 | 0.059 | 0.043 | 0.036 | 0.039 | 0.035 | 0.036 | 0.033 |
chromium | 0.051 | 0.048 | 0.038 | 0.032 | 0.018 | 0.025 | 0.038 | 0.031 | 0.038 | 0.04 | 0.042 | 0.048 |
cobalt | 0.009 | 0.010 | 0.008 | 0.005 | 0.012 | 0.004 | 0.007 | 0.008 | 0.011 | 0.006 | 0.008 | 0.007 |
lead | 0.009 | 0.005 | 0.011 | 0.007 | 0.009 | 0.008 | 0.012 | 0.01 | 0.01 | 0.014 | 0.009 | 0.010 |
 | Figure 2: Month wise variation of quantities of existing heavy-metals in the groundwater
|
Iron is a crucial nutrient for humans, requiring a recommended daily intake of 5 mg. Due to this, many countries have classified drinking water as having a secondary limit for iron-based aesthetic issues (secondary maximum contaminant level, - SMCL). The groundwater sample analysis shows iron concentrations ranging from 0.081 ppm in September to 0.099 ppm in August, with an overall average of 0.089 ppm during the study period. In nations like Greece, Iran, Canada; the iron (Secondary Maximum Contaminant Level) SMCL in potable water is 0.30 mg/l.28 The occurrence of iron in the samples of groundwater is an immediate manifestation of its inherent abundance in subterranean rock/soil developments and the water from precipitation that permeates across such developments. Water surges across rocks and soil, dissolving iron, accumulating in aquifers, and eventually becoming a source of groundwater. The iron concentration remains below the WHO standard of 1.0 ppm. Iron in groundwater is primarily ferrous or bivalent (Fe++), or insoluble. Additionally, when water is allowed to stand, the presence of iron causes the water to develop a brownish-to-reddish hue.29 A surplus amount of iron also has an impact on the bacterial abundance in groundwater.
Zinc is a crucial factor in promoting human health, especially during prenatal and perinatal development, and its deficiency is linked to various health issues such as depression, weakness, diarrhea, alopecia, eye and skin problems, reduced appetite, compromised immune function, inefficient carbohydrate utilization, and reproductive issues in spermatogenesis.30 The zinc concentrations in the experimental water samples fluctuated from 0.001 ppm in August to 0.059 ppm in December. These variations can be attributed to a combination of natural factors and human activity. Zinc Sulphate, present in water at levels exceeding 3 mg/l, can cause an unpleasant taste. However, zinc concentrations in drinking water seldom surpass 0.1 ppm. Zinc is introduced into the air, water, and soil through a range of natural and human-induced processes. Waste from zinc and other metal manufacturing and chemical companies, as well as residential use and runoff from zinc-rich soil, are sources that release zinc into streams. Elevated zinc levels in local groundwater can be contributed by sludge, fertilizers, and chemical pesticides.
Copper is a crucial heavy-metal in trace amounts, but when its concentration exceeds permitted levels, it poses a threat to aquatic life and humans. Based on the research conducted, the copper concentrations in the research area varied from 0.016 to 0.089 ppm. The lowest concentration was detected in August, while the highest value was recorded in March, resulting in an average concentration of 0.048 ppm for the study year. The peak copper concentration in March may be attributed to copper intrusion from chemical enterprises, waste disposal from neighbouring manufacturing units, and domestic waste. It's worth noting that the copper concentration remains well below the WHO's acceptable range of 1.0 ppm.24
Manganese, similar to iron, is classified as a secondary priority chemical contaminant. The ingestion of manganese-contaminated water has been proven to cause neurotoxicity in both humans and animals. The utmost level of Mn was obtained in May at 0.074 ppm and in October; it reached at the lowest: 0.020 ppm, both well below the WHO permitted range of 0.5 ppm. Mn contamination can be attributed to domestic waste, natural geological sources, and industrial wastewater.31 High levels of manganese in drinking water can pose a significant health risk, especially for infants, who are more vulnerable to adverse neurological impacts. This element can be found in surface and groundwater, resulting from environmental causes and various human interferences, such as mining and industrial waste. When water enters soil and rock, it can dissolve minerals, including manganese, which then becomes part of groundwater.
The nickel values in the water samples analysed ranged from 0.033 to 0.074 ppm, with the highest concentrations detected in July. It is worth noting that nickel is commonly found in human tissues, and prolonged contact can substantially elevate its levels, which is important to consider.32-33 The contribution of nickel consumption through air and drinking water is generally less significant compared to dietary ingestion. Absorption is the most important mode of exposure to nickel. In animals, 1-10% of dietary nickel is absorbed through the gastrointestinal system. It is indispensable to recognise that the method of nickel absorption can significantly impact its bioavailability.34
Chromium is naturally found in trace concentrations. Elevated chromium levels beyond the permissible limit can be concerning. The significantly elevated quantity of chromium in contaminated water may be attributed to the presence of chromium in soaps and detergents used for washing and bathing.35 Exceeding the WHO limit for chromium levels poses an imminent threat to the health of people in the affected area. Anthropogenic activities can lead to chromium pollution in the environment, particularly from natural occurrences during the hexavalent process.36 Hexavalent chromium, classified as a human carcinogen, is a hazardous industrial waste, and its presence is a result of both regulating and non-regulating activities.37-38 The experimental water samples showed a variation in chromium concentration, ranging from 0.018 ppm in August to 0.051 ppm in April, averaging 0.037 ppm over the course of the trial year. These values consistently remained below the WHO 2007 guidelines.25
Cobalt exists in nature in the composition of the exterior layer of earth and consequently in the earth’s soil. It is found at the lowest levels in saltwater, surface water, and groundwater.39 When cobalt is released into the water, it can be absorbed by particles and eventually settle in the sediment. Elevated levels of cobalt in groundwater are often associated with human endeavours such as mineral extraction, treatment of cobalt-bearing mineral deposits, employing cobalt-bearing sludge material, phosphate fertilizers, dumping of cobalt-containing pollutants, the sizzling of fossil fuels, and combustion and refinement of metals.39 The water samples analysed showed cobalt concentration values ranging from 0.004 to 0.012 ppm, exhibiting a mean concentration value of 0.008 ppm over the study period. It's important to note that the standard authorised limit for cobalt content in drinking water is 0.05 ppm.23 It's also worth mentioning that cobalt concentrations in groundwater could be significantly greater in mining and farmland regions. While cobalt is crucial for human health by means of a constituent of vitamin B12, high cobalt concentrations may exert detrimental effects on human health, including respiratory symptoms, nausea and vomiting, visual issues, dermatitis, thyroid damage, severe heart harm, and even cancer.
Lead is usually toxic and accumulates in the kidneys and skeletons of animals. Children up to 6 years of age and pregnant women are most prone to its hostile effects.40 Groundwater samples collected in June, October, and January showed lead levels exceeding the WHO limit of 0.05 ppm. This could be attributed to the usage of leaded petroleum in cars, generators, and some mechanic shops near the study area, especially battery chargers.41 Furthermore, lead pollution of groundwater can also result from industrial effluent, old plumbing, home sewage, agricultural runoff including phosphate from fertilizers, and human and animal.42 In the present study in January and May, the lead levels in the water sources peaked at 0.014 ppm and bottomed out at 0.005 ppm, respectively, with an average of 0.010 ppm over the course of the study year. Symptoms of acute lead intoxication encompass a range of manifestations including dullness, restlessness, irritability, allergies, stiffness, hyperactivity, mood swings, queasiness, impassiveness, loss of focus, and convulsions. The heightened presence of lead (Pb) in the water sources may be linked to lead weathering and leaching from waste rocks, dumps, agricultural fields, domestic sewage, and other neighbouring areas.
Based on the findings, it is evident that the heavy-metal dispersion varies throughout the year. As depicted in Figure 2, the presence of iron outweighs that of other metals, peaking in the month of August. Additionally, it is worth noting that the average metal concentration in this particular area adheres to a specific order: cobalt < lead < chromium < manganese < copper < nickel < zinc < iron, in the studied year. The analysis presented in Figure 2 and Table 1, which reflect the WHO's recommendations regarding acceptable levels of examined heavy-metals, indicates that cobalt and lead are the least prevalent heavy-metals in the sampled water due to the remote location of the studied area, distant from industrial zones and urban centres, leading to the absence of significant human inputs such as ignition of fossil fuel, waste emissions, vehicular; aircraft exhaust, and cobalt and cobalt-containing alloys production. Moreover, there is reduced utilization of cobalt fertilizers and agricultural chemicals. However, the likelihood of lead contamination escalates when these materials are utilized and come into contact with water, but, in the studied residential and rural settings, the presence of lead-containing materials such as water pipes or minerals is uncommon and not typically associated with water sources. However, it is noteworthy that in the present study, lead concentrations exceeded the WHO's threshold in June, October, and January. The heavy-metal pathway entails a progressive buildup of Pb in the soil, stemming from the improper disposal of household and agricultural waste on the ground in particular months. Subsequently, rainfall, including irrigation, fosters the transport of these metals into the groundwater, amplifying the environmental impact. Additionally, chromium (Cr) levels exceeded permissible limits in April, likely due to the consequence of excessive use of Cr based agricultural chemicals and the improper disposal of waste in both the soil and water systems, while nickel (Ni) concentrations were found to be in excess of allowable thresholds in July as rainfall-driven soil leaching can result in the transportation of nickel contamination to groundwater. Alternatively, nickel can be directly redistributed from the atmosphere and soil to surface water sources through deposition and runoff. On the other hand, iron, zinc, copper, and nickel, were all within permitted limits throughout the months under study, which stem from the combination of suitable human conduct and environmental elements. All the heavy-metal levels were assessed against the specified thresholds, as outlined in Table 2.
Table 2: Standard specifications for drinking water
Heavy Metals | Standard value (ppm) as per [WHO: 1993, 2003, 2007, 2008] | Standard value (ppm) as per [BIS:2012] |
iron | 0.30 | 0.30 |
zinc | 3.00 | 15.0 |
copper | 1.00 | 1.50 |
manganese | 0.40 | 0.30 |
nickel | 0.07 | 0.02 |
chromium | 0.05 | 0.05 |
cobalt | 0.05 | 0.05 |
lead | 0.05 | 0.01 |
Further, as the HPI values represented in Table 3, are considered an excellent convenient aid in assessing the overall effluence of water bodies in terms of pollution with regard to several heavy-metals present in the water, the values of HPI in this current investigation designate that except for the months of May, July, August, September, November, and February, the samples of groundwater are relatively critically contaminated in terms of heavy-metals that can be analysed through Figure 3.
Table 3: Monthwise Heavy-Metal-Pollution-Index of the groundwater samples
Heavy metals | Wi | Qi | WiQi | HPI | Wi | Qi | WiQi | HPI |
Apr | May | |||||||
iron | 0.003333 | 31.0000 | 0.10333 | 78.21 | 0.003333 | 29.5000 | 0.09833 | 52.01 |
zinc | 0.000067 | 49.4300 | 0.00330 | 0.000067 | 49.4900 | 0.00330 | ||
copper | 0.000667 | 2.00000 | 0.00133 | 0.000667 | 1.44830 | 0.00097 | ||
manganese | 0.003333 | 23.0000 | 0.07667 | 0.003333 | 13.0000 | 0.04333 | ||
nickel | 0.014286 | 96.0000 | 1.37143 | 0.014286 | 94.0000 | 1.34286 | ||
chromium | 0.020000 | 102.000 | 2.04000 | 0.020000 | 96.0000 | 1.92000 | ||
cobalt | 0.020000 | 2.50000 | 0.05000 | 0.020000 | 0.00000 | 0.00000 | ||
lead | 0.100000 | 90.0000 | 9.00000 | 0.100000 | 50.0000 | 5.00000 | ||
Jun | Jul | |||||||
iron | 0.003333 | 31.0000 | 0.10333 | 86.12 | 0.003333 | 29.0000 | 0.09667 | 63.46 |
zinc | 0.000067 | 49.4700 | 0.00330 | 0.000067 | 49.8400 | 0.00332 | ||
copper | 0.000667 | 1.86210 | 0.00124 | 0.000667 | 2.2069 | 0.00147 | ||
manganese | 0.003333 | 24.5000 | 0.08167 | 0.003333 | 26.0000 | 0.08667 | ||
nickel | 0.014286 | 78.0000 | 1.11429 | 0.014286 | 108.0000 | 1.54286 | ||
chromium | 0.020000 | 76.0000 | 1.52000 | 0.020000 | 64.0000 | 1.28000 | ||
cobalt | 0.020000 | 5.00000 | 0.10000 | 0.020000 | 12.5000 | 0.25000 | ||
lead | 0.100000 | 110.000 | 11.0000 | 0.100000 | 70.0000 | 7.00000 | ||
Aug | Sep | |||||||
iron | 0.003333 | 31.0000 | 0.10333 | 69.48 | 0.003333 | 27.0000 | 0.09000 | 65.73 |
zinc | 0.000067 | 49.9900 | 0.00333 | 0.000067 | 49.8700 | 0.00332 | ||
copper | 0.000667 | 2.34480 | 0.00156 | 0.000667 | 0.6207 | 0.00041 | ||
manganese | 0.003333 | 31.5000 | 0.10500 | 0.003333 | 36.0000 | 0.12000 | ||
nickel | 0.014286 | 84.0000 | 1.20000 | 0.014286 | 78.0000 | 1.11429 | ||
chromium | 0.020000 | 36.0000 | 0.72000 | 0.020000 | 50.0000 | 1.00000 | ||
cobalt | 0.020000 | 5.00000 | 0.10000 | 0.020000 | 15.0000 | 0.30000 | ||
lead | 0.100000 | 90.0000 | 9.00000 | 0.100000 | 80.0000 | 8.00000 | ||
Oct | Nov | |||||||
iron | 0.003333 | 27.6667 | 0.09222 | 90.03 | 0.003333 | 31.6667 | 0.10556 | 74.38 |
zinc | 0.000067 | 49.5400 | 0.00330 | 0.000067 | 49.4600 | 0.00330 | ||
copper | 0.000667 | 0.06900 | 0.00005 | 0.000667 | 0.55170 | 0.00037 | ||
manganese | 0.003333 | 40.0000 | 0.13333 | 0.003333 | 36.0000 | 0.12000 | ||
nickel | 0.014286 | 46.0000 | 0.65714 | 0.014286 | 32.0000 | 0.45714 | ||
chromium | 0.020000 | 76.0000 | 1.52000 | 0.020000 | 62.0000 | 1.24000 | ||
cobalt | 0.020000 | 7.50000 | 0.15000 | 0.020000 | 5.00000 | 0.10000 | ||
lead | 0.100000 | 120.000 | 12.0000 | 0.100000 | 100.000 | 10.0000 | ||
Dec | Jan | |||||||
iron | 0.003333 | 29.6667 | 0.09889 | 76.26 | 0.003333 | 28.3333 | 0.09444 | 101.66 |
zinc | 0.000067 | 49.4100 | 0.00329 | 0.000067 | 49.4600 | 0.00330 | ||
copper | 0.000667 | 1.24140 | 0.00083 | 0.000667 | 1.4483 | 0.00097 | ||
manganese | 0.003333 | 34.5000 | 0.11500 | 0.003333 | 33.0000 | 0.11000 | ||
nickel | 0.014286 | 38.0000 | 0.54286 | 0.014286 | 30.0000 | 0.42857 | ||
chromium | 0.020000 | 76.0000 | 1.52000 | 0.020000 | 80.0000 | 1.60000 | ||
cobalt | 0.020000 | 2.50000 | 0.05000 | 0.020000 | 10.0000 | 0.20000 | ||
lead | 0.100000 | 100.000 | 10.0000 | 0.100000 | 140.0000 | 14.0000 | ||
Feb | Mar | |||||||
iron | 0.003333 | 30.0000 | 0.10000 | 70.76 | 0.003333 | 28.0000 | 0.09333 | 78.14 |
zinc | 0.000067 | 49.5200 | 0.00330 | 0.000067 | 49.4700 | 0.00330 | ||
copper | 0.000667 | 2.41380 | 0.00161 | 0.000667 | 2.68970 | 0.00179 | ||
manganese | 0.003333 | 29.5000 | 0.09833 | 0.003333 | 28.5000 | 0.09500 | ||
nickel | 0.014286 | 32.0000 | 0.45714 | 0.014286 | 26.0000 | 0.37143 | ||
chromium | 0.020000 | 84.0000 | 1.68000 | 0.020000 | 96.0000 | 1.92000 | ||
cobalt | 0.020000 | 5.00000 | 0.10000 | 0.020000 | 7.50000 | 0.15000 | ||
lead | 0.100000 | 90.0000 | 9.00000 | 0.100000 | 100.000 | 10.0000 | ||
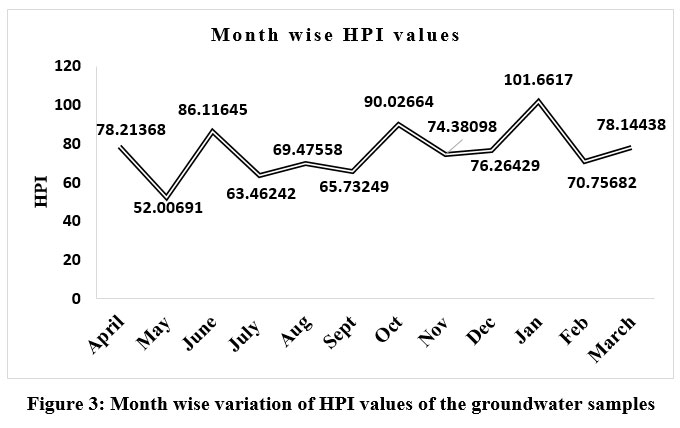 | Figure 3: Month wise variation of HPI values of the groundwater samples
|
The assessment of water quality using HPI values reveals that a value exceeding 100, such as the 101.66 recorded in our present study in January, signifies a high level of HPI. In this context, it's worth noting that the cultivation of vegetables and various cereals in adjoining agricultural fields can lead to increased heavy-metal pollution due to overexposure to pesticides, fertilizers, and sewage sludge. Additionally, the disposal of domestic and agricultural waste in ground areas near drinking water sources may also contribute to higher levels of heavy-metal-pollution-index. In contrast, measurements below 100 were recorded in several months throughout the year. But if the increasing trend persists, it has the potential to disturb the intricate harmony of the ecosystem, leading to adverse impacts on the environment and its inhabitants.
Descriptive Statistical Analysis
The distribution of heavy-metal concentrations demonstrates significant geographical variations, likely attributed to the diverse geological and topographical features of distinct regions.43 Skewness values serve as a measure to evaluate the symmetry or asymmetry of element distributions. A skewness value exceeding zero specifies a right-skewed (positive) distribution, although a value underneath zero directs a left-skewed (negative) distribution, signaling asymmetry.43 The descriptive statistics for the groundwater specimens are outlined in Table 4.
Table 4: The consequences of descriptive statistics of the existing heavy-metals in the groundwater
Statistical Variables | iron | zinc | copper | manganese | nickel | chromium | cobalt | lead |
Stand. Error | 0.002 | 0.006 | 0.008 | 0.004 | 0.004 | 0.003 | 0.001 | 0.001 |
Mean | 0.089 | 0.042 | 0.048 | 0.041 | 0.051 | 0.037 | 0.008 | 0.010 |
Med | 0.089 | 0.052 | 0.046 | 0.039 | 0.051 | 0.038 | 0.008 | 0.010 |
Stand. Dev. | 0.005 | 0.020 | 0.027 | 0.015 | 0.015 | 0.010 | 0.002 | 0.002 |
Var. | 0.000 | 0.000 | 0.001 | 0.000 | 0.000 | 0.000 | 0.000 | 0.000 |
Kurt. | -0.213 | 0.186 | -1.461 | 1.183 | -1.853 | -0.004 | -0.379 | 0.944 |
Skewn. | 0.420 | -1.328 | 0.291 | 0.912 | 0.161 | -0.555 | 0.119 | 0.000 |
Ran. | 0.018 | 0.058 | 0.073 | 0.054 | 0.041 | 0.033 | 0.008 | 0.009 |
Min | 0.081 | 0.001 | 0.016 | 0.020 | 0.033 | 0.018 | 0.004 | 0.005 |
Max | 0.099 | 0.059 | 0.089 | 0.074 | 0.074 | 0.051 | 0.012 | 0.014 |
The analysis ranks the metals in descending order of average concentration as follows:
Fe > Ni > Cu > Zn > Mn > Cr > Pb > Co
Table 5 implies the correlation matrix for the studied metals was generated using the Pearson correlation method, and the consequences.
Table 5: Outcomes of Pearson’s correlation-coefficients of the heavy-metals detected in groundwater samples
Parameters | iron | zinc | copper | manganese | nickel | chromium | cobalt | lead |
iron | 1.000 | |||||||
zinc | -0.085 | 1.000 | ||||||
copper | -0.373 | 0.491 | 1.000 | |||||
manganese | 0.203 | 0.152 | -0.396 | 1.000 | ||||
nickel | 0.197 | -0.505 | -0.927 | 0.570 | 1.000 | |||
chromium | -0.240 | 0.803 | 0.317 | 0.512 | -0.152 | 1.000 | ||
cobalt | 0.736 | 0.145 | -0.153 | 0.255 | 0.035 | 0.033 | 1.000 | |
lead | -0.133 | 0.351 | 0.430 | -0.618 | -0.644 | 0.006 | -0.142 | 1.000 |
Correlation is significant at 0.05 level
In the course of the investigation into the connections among the different elements, the study has revealed robust correlations, which are characterized by a prominent association between interconnected elements. In thirteen instances, negative and inverse associations were identified, including Zn – Fe, Cu – Fe, Mn – Cu, Ni – Zn, Ni – Cu, Cr – Fe, Cr – Ni, Pb – Fe, Pb – Mn, Pb – Ni, and Pb – Co. The intriguing observation is that every notable positive correlation among the heavy-metals suggests a clear interconnectedness of their origins. When there is a strong and meaningful link between these parameters, it is reflected in the high correlation they exhibit and the considerable similarities they share.44 Furthermore, this increases the likelihood that there are shared human-influenced origins or like causes. Thus in the present study, the substantial correlation coefficients among the heavy-metals indicate their similar geochemical properties and shared input sources. However, their negative association may stem from disparities in their origins, characteristics, and groundwater input. The strong positive correlation between the heavy-metals, approaching nearly one, suggests that an intensification of the amount of one metal is likely to result in a corresponding upsurge of the other metals’ content. This phenomenon may be attributable to household and agricultural waste seepage into groundwater.
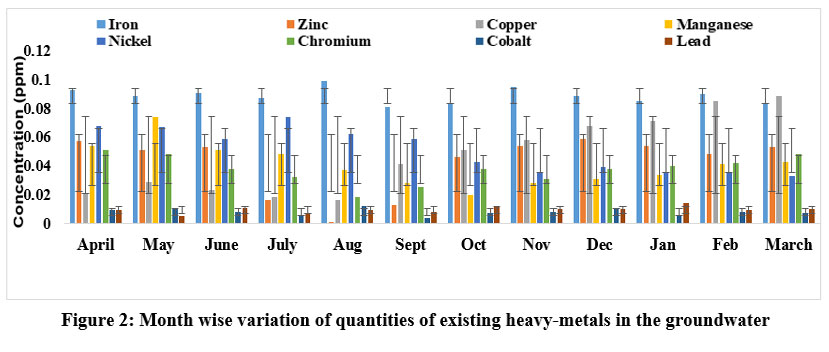
Analysis of multiple-linear-regression was also employed to evaluate the impact of specific heavy- metal variables on each other. The R-Square values presented in Table 6 exhibit a considerable range, spanning from 0.649 for Ni to an impressive 0.987 for lead. Additionally, Figure 4 illustrates the comparative analysis of the R-Square values that serve as a crucial indicator of the precision and trustworthiness of the findings, showcasing a substantial and strong association between each of the dependent and independent variables. The values demonstrate a strong and identifiable linear association, affirming the capacity to achieve meticulous and reliable results in heavy-metal concentration analysis for each sample. The findings underscore the profound influence of each individual heavy-metal variable on the others, indicating substantial percentage increases. The findings of the comprehensive multiple regression-analysis unequivocally demonstrate the substantial impact of the independent variable on the value of each heavy-metal, pointing to the interconnectedness and complexities within the system.
Table 6: Multiple-linear-regression: significance of heavy-metals to groundwater excellence
R value | R-Square value | R-Square adjusted value | Stand. Error |
Fe to water quality | |||
0.935 | 0.874 | 0.581 | 0.00344 |
Zn to water quality | |||
0.952 | 0.906 | 0.687 | 0.01137 |
Cu to water quality | |||
0.989 | 0.978 | 0.593 | 0.00718 |
Mn to water quality | |||
0.962 | 0.925 | 0.750 | 0.00735 |
Ni to water quality | |||
0.994 | 0.987 | 0.958 | 0.00306 |
Cr to water quality | |||
0.976 | 0.952 | 0.842 | 0.00364 |
Co to water quality | |||
0.806 | 0.649 | -0.170 | 0.00264 |
Pb to water quality | |||
0.891 | 0.793 | 0.311 | 0.00201 |
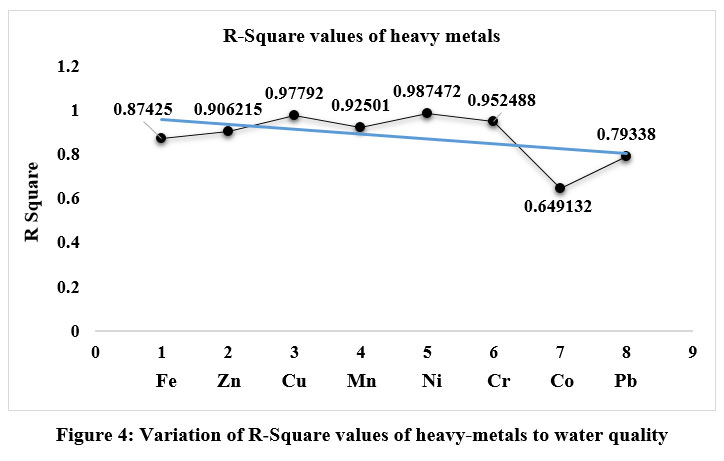 | Figure 4: Variation of R-Square values of heavy-metals to water quality
|
Conclusion
The main contributor to anthropogenic activity-related water quality effluence in the research area is the discharge of waste from households, including chemicals and organic matter, as well as agricultural pollutants such as fertilizers and pesticides. Groundwater can also become polluted due to various activities that take place on the surface, such as improper disposal of waste. Additionally, contamination can occur due to leakage from underground storage tanks or septic systems. Structures such as wells that are below the water table can also contribute to groundwater contamination, as can the presence of contaminated recharge water. Continuous monitoring of water samples is required, as the results indicate contamination levels that can determine the integrity of imbibing water. It is imperative for individuals to be cognizant of the probable threats allied to the consumption of contaminated water. An increased awareness of the detrimental impacts of consuming contaminated groundwater is strongly advised. Furthermore, the dissemination of knowledge to farmers on mitigating wastewater leaching, along with the promotion of prudent pesticide application, is essential to prevent groundwater pollution. Agricultural activities should be located away from residential regions to uphold environmental integrity. Certain fertilizers, herbicides, insecticides, rodenticides, fungicides etc., have the potential to persist in water and soil for extended periods, ranging from several months to years, resulting in contamination of groundwater by leaching process. Groundwater contamination may also result from animal waste originating from agricultural feedlots seeping into the soil. To mitigate these issues, it is essential to regularly remove and properly manage waste from feedlots to evade environmental pollution. Besides that, identification of heavy-metals based on HPI criteria, which were only detected in January, extremely high levels of heavy-metal contamination that could potentially impact the local ecosystem were observed. This characterisation of the water samples provides insight into the presence of pollution in water bodies, particularly heavy-metals, and can guide future management strategies aimed at preventing such contamination.
Acknowledgement
The author is very thankful to the authority of Siliguri College, Siliguri, West Bengal, for their immense support, the Panchayat members, and the local people of Rishipur village to complete the research work.
Funding Sources
The author(s) received no financial support for the research, authorship, and/or publication of this article.
Conflict of Interest
The author does not have any conflict of interest.
Data Availability Statement
The research is based on primary data obtained from laboratory experiments only.
Ethics Approval Statement
The study received prior consent from the Gramme Pradhan and was eventually approved by the local Panchayat of Rishipur village in the Malda district of West Bengal, India.
References
- Vanloon GW., Duffy SJ. The Hydrosphere. in: Environmental Chemistry: a Global Perspective. 2nd edition. New York: Oxford University Press. 2005;197-211.
- McMurry J., Fay RC. Hydrogen, Oxygen and Water. in: Mcmurry Fay Chemistry. K.P. Hamann, (Ed.). 4th Edn. New Jersey: 4th edition. Pearson Education. New Jersey. 2004;575-599.
- Vodela JK., Renden JA., Lenz SD., Mchel Henney WH., Kemppainen BW. Drinking Water Contaminants (Arsenic, Cadmium, Lead, Benzene, and Trichloroethylene). 1. Interaction of Contaminants with Nutritional Status on General Performance and Immune Function in Broiler Chickens. Poult Sci. 1997;76 (11):1474-1492. doi: 10.1093/ps/76.11.1474.
CrossRef - Jain CK., Bandyopadhyay A., Bhadra A. Assessment of Ground Water Quality for Drinking Purpose, District Nainital, Uttarakhand, India. Env Moni Asses. 2010;166(1-4):663–676. doi: 10.1007/s10661-009-1031-5.
CrossRef - Marcovecchio JE., Botte SE., Freije RH. Heavy Metals, Major Metals, Trace Elements. in: Handbook of Water Analysis. L.M. Nollet, 2nd edition. London: CRC Press. 2007;275-311.
CrossRef - Zenebe Y. Accumulation of Certain Heavy Metals in Nile Tilapia (Oreochromisniloticus) Fish Species Relative to Heavy Metal Concentrations in the Water of Lake Hawassa, Addis Ababa University School of Graduate Studies Environmental Science Program. 2011;1-63.
- Martinez-Lopez S., Martinez-Sanchez MJ., Gomez-Marinez MC., Perez-Sirvent C. Assessment of the Risk Associated with Mining-Derived Inputs in a Lagoon System. Env Geochem Health. 2020;42(8):2439-2450. doi: 10.1007/s10653-019-00385-5.
CrossRef - MacDonald AM., Calow RC. Developing Groundwater for Secure Rural Water Supplies in Africa. Desalination. 2009;248(1-3):546–556. doi: https://doi.org/10.1016 /j.desal. 2008.05.100.
CrossRef - Pobi KK., Nayek S., Saha R. Assessment of Heavy Metals in Water, Sediment and Adjacent Soil of a Contaminated Channel in Durgapur Industrial Zone, West Bengal, India. Int J Ecol Env Sc. 2017;43(4):275-285.
- Ghose NC. Heavy Metal Concentration in Ground Water of Greater Kolkata, West Bengal, India. Ind J Geol. 2001;73(1):55-66.
- Paul D., Sinha SN. Assessment of Various Heavy Metals in Surface Water of Polluted Sites in the Lower Stretch of River Ganga, West Bengal: A Study for Ecological Impact. Discov Nat. 2013;6(14):8-13.
- Sarkar A., Paul B., Darbha GK. The Groundwater Arsenic Contamination in the Bengal Basin-A Review in Brief. Chemosphere. 2022;299:134369. doi: https://doi.org/10.1016/ j.chemosphere.2022.134369.
CrossRef - APHA – AWWA and WPCF. Standard Methods for the Examination of Water and Waste Water, 20th Edition, Washington, DC. 1998.
- Trivedy RK., Goel PK. Chemical and Biological Methods for Water Pollution Studies. Env Publ Karad. 1984;1-22.
- Edet AE,. Offiong OE. Evaluation of Water Quality Pollution Indices for Heavy Metal Contamination Monitoring. A Study Case from Akpabuyo-Odukpani Area, Lower Cross River Basin (Southeastern Nigeria). Geo J. 2002;57:295-304. doi: https://doi.org/10.1023/B:GEJO.0000007250.92458.de.
CrossRef - Alexandra HM., Roman C., Ristoiu D., Popita G., Tanaselia C. Assessing of Water Quality Pollution Indices for Heavy Metal Contamination. A Study Case from Medias City Groundwaters. Agric Sci Prac. 2013;3(4):87-88. doi: https://doi.org/10.15835/arspa.v87i3-4.9974.
- Giri S., Singh AK. Assessment of Surface Water Quality Using Heavy Metal Pollution Index in Subarnarekha River, India. Water Qual Expo Heal. 2013;5(4):173-182. doi:10.1007/s12403-013-0106-2
CrossRef - Reza R., Singh G. Heavy Metal Contamination and its Indexing Approach for River Water. Int J Environ Sci Tech. 2010;7(4):785-792. doi:10.1007/BF03326187.
CrossRef - Kumar M., Padhy PK., Chaudhury S. Study of Heavy Metal Contamination of the River Water Through Index Analysis Approach and Environmetrics. Bull Environ Pharmacol Life Sci. 2012;1(10):7-15.
- Abdullah EJ. Evaluation of Surface Water Quality Indices for Heavy Metals of Diyala River-Iraq. J Nat Sci Res. 2013;3(8):63-70.
- Yankey RK., Fianko JR., Osae S., Ahialey EK., Duncan AE., Essuman DK., Bentum JK. Evaluation of Heavy Metal Pollution Index of Groundwater in the Tarkwa Mining Area, Ghana. Elixir Poll. 2013;54: 12663-12667.
- Moghaddam MH., Lashkaripour GR., Dehghan P. Assessing the Effect of Heavy Metal Concentrations (Fe, Pb, Zn, Ni, Cd, As, Cu, Cr) on the Quality of Adjacent Groundwater Resources of Khorasan Steel Complex. Int. Plan Anim Environ Sci. 2014;4(2):511-518.
- WHO. Guidelines for Drinking Water, Vol I, Health Criteria & Other Supporting Information. 1993.
- WHO. International Year of Fresh Water. General Assembly Resolution A/RES/55/196. 2003.
- WHO. International Standards for Drinking Water, Geneva. 2007.
- WHO. Guidelines for Drinking Water, 3rd edition: Vol I, Recommendations Incorporating the First and Second Addenda. 2008.
- Bureau of Indian Standards (BIS). Indian Standard Drinking Water Speci?cation (Second Revision) BIS 10500:2012, New Delhi. 2012.
- Ityel D. Ground Water: Dealing with Iron Contamination. 2011, Retrieved From: https://www.filtsep.com/content/features/ground-water-dealing-with-iron-contamination/, on 11.08.2024.
- Elinge CM., Itodo AU., Peni IJ., Birnin – Yauri UA., Mbongo AN. Assessment of Heavy Metals Concentrations in Bore-Hole Waters in Aliero Community of Kebbi State. Adv Appl Sci Res. 2011;2(4):279-282.
- Dutta D., Sarma HP. Copper (Cu), Zinc (Zn) and Cadmium (Cd) Contamination of Groundwater in Dikrong River Basin, Paumpare District, Arunachal Pradesh, India, IOSR. J Env Sci Toxicol Food Tech. 2015;9(10):20-23. doi: 10.9790/2402-091022023.
- Senthil Kumar RD., Narayanaswamy R., Ramakrishnan K. Pollution Studies on Sugar Mill Effluent-Physico-Chemical Characteristics and Toxic Metals. Poll Res. 2001;20(1):93-97.
- Grandjean P. Human Exposure to Nickel. IARC Sci Publ. 1984;53:469-485.
- Chang LW. Toxicology of Metals. Lewis publishers: New York, USA. 1996;245-246.
- Cempel M., Nikel G. A Review of Its Sources and Environmental Toxicology. J of Environ Stud. 2006;15(3):375-382.
- Iqbal MA., Gupta SG. Studies on Heavy Metal Ion Pollution of Ground Water Sources as an Effect of Municipal Solid Waste Dumping. African J Basic & Appl Sci. 2009;1(5-6):117-122.
- Tomolo ., Ancona V., Paola DD., Losacco D., Campanale C., Massarelli C., Uricchio VU. Chromium Pollution in European Water, Sources, Health Risk, and Remediation Strategies: An Overview. Int J Environ Res Public Health. 2020;17(15):5438. doi: 10.3390/ijerph17155438.
CrossRef - IARC. Monographs on the Evaluation of Carcinogenic Risks to Humans. IARC, Chromium, Nickel and Welding. Vol. 49. Lyon, IARC Scientific Publications, France. 1990.
- U.S EPA. Environmental Criteria and Assessment Office. Cincinnati, OH: United States Environmental Protection Agency; Integrated Risk Information System (IRIS). 1992.
- Smith IC., Carson BL. Trace Metals in the Environment. Ann Arbor, MI, Ann Arbor Science Publishers. 1981.
- Abdulrafiu OM., Adeleke AK., Lateef OG. Quality Assessment of Groundwater in the Vicinity of Dumpsites in Ifo and Lagos, Southwestern Nigeria. Adv Appl Sci Re. 2011;2(1):289-298.
- Ali N., Oniye SJ., Bararabe ML., Auta J. Concentration of Fe, Cu, Cr, Zn and Pb in Makera Drain, Kaduna, Nigeria. Chem class J. 2004;2:69-73.
- Abdul Jameel A., Sirajudeen J., Abdul VR. Studies on Heavy Metal Pollution of Groundwater Sources between Tamilnadu and Pondicherry India. Adv Appl Sci Res. 2012;3:424-429.
- Van der Perk M., Vilches A.E. Compositional Dynamics of Suspended Sediment in the Rhine River: Sources and Controls. J Soils Sediments. 2020; 20(3),1754–1770. doi:10.1007/s11368-019-02490-5.
CrossRef - Armah FA., Obiri S., Yawson DO., Onumah E.E., Yengoh GT., Afrifa EKA., Odoi JO. Anthropogenic Sources and Environmentally Relevant Concentrations of Heavy Metals in Surface Water of a Mining District in Ghana: A Multivariate Statistical Approach. J Environ Sci Heal A. 2010;45(13):1804-1813. doi: 10.1080/10934529.2010.513296.
CrossRef


