Urban Heat Island Dynamics of the Fast-Growing Cuttack-Bhubaneswar Twin City: A Geospatial-Temporal Analysis
Priyanka Chakraborty1
 , Md Mainul Sk1
*
 , Tapas Ranjan Patra1
 , Labani Sarkar1
 , Sajal Ghosh2
 and Kalyan Sardar3

1
Department of Geography,
Rajendra University, Prajna Vihar,
Bolangir,
Odisha
India
2
Department of Geography,
Hiralal Bhakat College,
Nalhati,
West Bengal
India
3
Department of Geography,
Ranchi University,
Ranchi,
Jharkhand
India
Corresponding author Email: mainuls919@gmail.com
Copy the following to cite this article:
Chakraborty P, Sk M. M, Patra T. R, Sarkar L, Ghosh S, Sardar K. Urban Heat Island Dynamics of the Fast-Growing Cuttack-Bhubaneswar Twin City: A Geospatial-Temporal Analysis. Curr World Environ 2025;20(1).
Copy the following to cite this URL:
Chakraborty P, Sk M. M, Patra T. R, Sarkar L, Ghosh S, Sardar K. Urban Heat Island Dynamics of the Fast-Growing Cuttack-Bhubaneswar Twin City: A Geospatial-Temporal Analysis. Curr World Environ 2025;20(1).
Citation Manager Publish History
Select type of program for download
| Endnote EndNote format (Mac & Win) | |
| Reference Manager Ris format (Win only) | |
| Procite Ris format (Win only) | |
| Medlars Format | |
| RefWorks Format RefWorks format (Mac & Win) | |
| BibTex Format BibTex format (Mac & Win) |
Article Publishing History
| Received: | 2025-01-27 |
|---|---|
| Accepted: | 2025-03-18 |
| Reviewed by: | 
 Babu Rao
|
| Second Review by: |

 Ms. Faradiba
|
| Final Approval by: | Dr. V P Tewari |
Introduction
A serious problem with urban climate is the phenomenon known as "Urban Heat Islands," or UHIs, which has drawn the attention of numerous researchers. British scientist Luke Howard (1980) made the initial observation of the UHI phenomenon in London, which was warmer than its surrounding rural areas.1 The first steps towards the development of a UHI condition are created when natural land cover is replaced by manufactured patterns of land use, such as high-rise glass structures, heat-absorbing pavements, and pavements. It's a kind of pollution of the air that fuels worldwide warming as well. UHI raises the temperature of metropolitan areas compared to rural surroundings.2 One of the most significant climate problems that humans have encountered in the 21st century is UHI, which is a result of industrialization and urbanisation. The enormous quantities of heat-generating urban structures are the primary sources of UHI.3 Urbanisation is an anthropogenic alteration that results in changes to the surface materials because of soil sealing, vegetation reduction, and variations in albedo. These modifications affect the regional energy balance and contribute to the development of the UHI.4 The prime reasons for the formation of UHI are: i. use of heat-absorbing building materials; ii. Surface friction by skyscrapers and other constructions minimizes the wind speed and air mixing; and iii. enhanced solar radiation absorption from surfaces with reduced albedo. High population density causes horizontal and vertical growth of the city. In similar environmental conditions, the urban climate differs from the country-side climate with a high trend of temperature graph especially in late afternoon and evening. Global warming coupled with urban heating affects the urban population adversely which is needed to be addressed by the planners.5 The present UHI effect may be brought on by climate change and the quickening pace of urbanisation. The presence of a substantial temperature contrast between urban and rural regions is primarily driven by rapid population growth, urban expansion, industrial activities, and reduced vegetation cover.6 Additionally, a dense transportation network and widespread infrastructure development contribute to rising urban temperatures. The widespread loss of green spaces, deforestation, and increasing built-up areas—coupled with materials like asphalt, concrete, and tar—alter the thermal equilibrium, leading to elevated temperatures in cities compared to surrounding rural environments.
60% of the world's population is expected to live in urban areas by 2030, with one in three of them residing in cities with a population of at least 500,000. Currently, half of all people live in cities.7-9 According to Mohajerani et al., the UHI may be viewed as a global issue that jeopardises the viability and liveability of cities and urban ecosystems.10 Urban planning, energy management, quality of life and health, and urban air pollution have all been influenced.11 LST is a yardstick to measure the surface temperature variation based on LU/LC changes, variation in vegetation cover and built-up area changes. Climate change coupled with rapid urbanization enhances the UHI phenomena in urban areas and to calculate surface heat balance, LST plays an important detrimental role.6 Changes in vegetation cover and LU/LC directly affect on environmental change.12 Since UHI is a component of environmental change, it results from changes in built-up area, vegetation cover, and LU/LC. Temperature and its variations are not measured by the satellite. In addition to helping study UHI, the Urban Thermal Field Variation Index (UTFVI) is also valuable for keeping an eye on the ecological state of urban regions.13 Industrial areas, scattered vegetation, parking lots, high-rise buildings, and sidewalks are important determinants of the hotspots of UHI.14 Remarkable Surface UHI mostly exists at night, on the other hand, Atmospheric UHI is predominantly observed during the day and night time.15 Machine Learning and Artificial Intelligence along with Remote Sensing have made it easy to explore the hidden structure of UHI phenomena in the recent advanced and technological era. But in future, the impact of UHI on human health, heat waves, air pollution in particular, and ecological security will receive scientific attention.16 The compact urban form, presence of dense vegetation, and use of building materials like concrete and asphalt retain more heat to intensify the UHI phenomena. The intensified UHI aggravates the health risk. The rate of urbanization and density of built-up land are also important determinants of UHI intensity.17 The UHI is positively co-related with man-made substances but negatively associated with natural substances like water bodies, green space etc. The acceleration of UHI intensity seriously affects residents' Quality of Life (QoL). So, it is necessary to increase the green and natural environment for UHI phenomena reduction.18 Nighttime land surface temperature is considered a good indicator to measure the urban heating effect. Urbanization-induced anthropogenic surfaces, emission of greenhouse gases, change of LU/LC pattern etc are key factors of continuous increase of temperature in urban areas of India.19 Delhi's nighttime urban temperature is greater than its daytime temperature because of changes in LU/LC as well as the presence of changing aerosols.20 Authors have looked at the difference between the UHI conditions in less crowded suburban and urban areas. It is discovered that there is a negative association between relative humidity and wind speed and a positive link with anthropogenic surfaces.21 Dewan et al., have explored in their study that the Surface heat island is higher in big cities than in small towns due to the lack of greenery and anthropogenic factors.22 The UHI phenomenon is the combined result of Indirect Solar Heating and anthropogenic factors. To reduce the impact of UHI it is necessary to revamp the urban designing and planning parameters.23 Wong and Yu have revealed that there is a sharp difference in temperature as an indicator of UHI between the green belt area and the heart of the city and also between the southern urban and northern rural areas of Singapore city.24 The population density and UHI are strongly correlated. High population density means high energy consumption which ultimately enhances high UHI intensity. The green spaces and water bodies account for low LST and UHI. Conversely, the barren terrain and asphalt–paved surfaces record high LST, Iran's capital, Tehran, has a high UHI after that.25
In Noida City, there is a negative association between LST and emissivity and the Normalised Difference Vegetation Index (NDVI), but a positive correlation between LST and the Normalised Difference Built-up Index (NDBI).26 Ryu and Baik have observed that Three-dimensional urban geometry, impermeable surfaces, and anthropogenic warming are the main causal factors of UHI intensity.27
The prime focus of the present paper is to investigate changes in LU/LC, vegetation area and built-up area and eco-environmental condition of the twin city (Cuttack- Bhubaneswar) of Odisha between the years 1990 to 2020 and to detect the LST variation of the four years viz. 1990, 2001, 2010 and 2020 and lastly to study the condition of UHI phenomena in twin cities over the study period and for future urban management and planning.
Materials and Methods
The USGS Earth Explorer website, located at https://earthexplorer.usgs.gov/, is the source of the remotely sensed datasets. For this investigation, four satellite data sets—Path140 and Row 46—from the years 1990, 2001, 2010, and 2020 are employed. The three decades with 10 years gap have been selected because this selection is based on significant urban expansion phases of twin cities, high quality satellite imagery and this interval is able to show critical changes in UHI intensity. The LU/LC of the study region and the UHI study are determined using Landsat 5 Thematic Mapper (TM) and Landsat 8 Operational Land Imager (OLI/TIRS) data, using LST and a few spectral indicators.
Table 1: Details of Satellite data of different years
Satellites | Sensor | Date | Path & Row | Data Source |
Landsat 5 | TM | 18.04.1990 | 140/46 | https://earthexplorer.usgs.gov/ |
Landsat 5 | TM | 15.03.2001 | 140/46 | |
Landsat 5 | TM | 25.04.2010 | 140/46 | |
Landsat 8 | OLI/TIRS | 20.04.2020 | 140/46 |
Source: https://earthexplorer.usgs.gov/
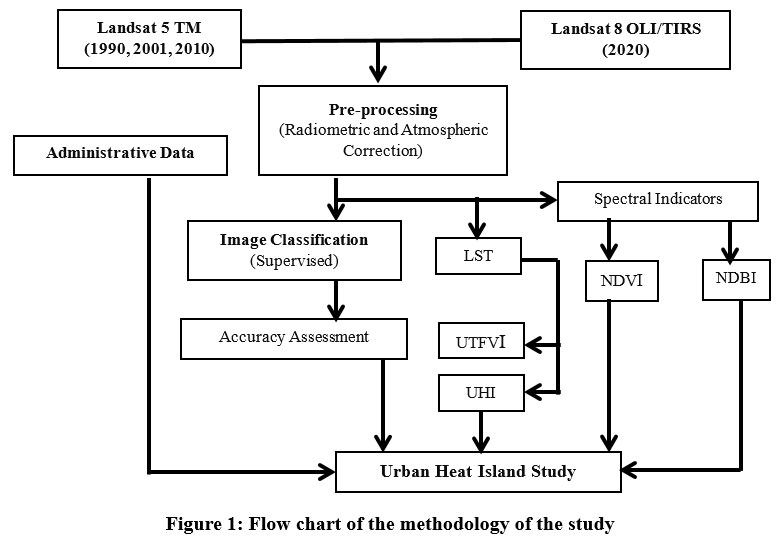 | Figure 1: Flow chart of the methodology of the study
|
Normalized Difference Vegetation Index (NDVI)
The NDVI scale runs from -1 to +1; areas with values close to 0 are covered in unhealthy or degraded vegetation, including built-up and barren areas. Healthy forest cover and vegetation are indicated by values close to (+1). The area of the water body is indicated by the area near (-1). NDVI equation is (eq. 1)

Normalized Difference Built-up Index (NDBI)
What an NDBI may measure value is -1.0 to +1.0. The built-up area is detected by the NDBI and formula is below (eq. 2).
![]()
LST for Landsat TM & Landsat OLI/TIRS
The built-up land is influenced by surface heat budget, net radiation and LST. Sequentially LST is retrieved from the thermal bands of Landsat 5 (TM) and Landsat 8 (OLI).
The Urban Thermal Field Variance Index (UTFVI)
UTFVI is calculated using following formula (eq. 3)
![]()
Where Ts represents the LST in Kelvin and Tmean
The Urban Thermal Field Variation Index (UTFVI) classifies environmental impact into six categories. When the index is below 0.000, conditions remain optimal. A range between 0.000 and 0.005 indicates favourable conditions, whereas values from 0.005 to 0.010 suggest moderate changes. Higher values between 0.010 and 0.015 signify deteriorating conditions, with increasing thermal stress. When the index rises to 0.015–0.020, severe environmental impacts are observed. Any value above 0.020 represents a critical risk to urban ecological balance.
The Urban Heat Island (UHI)
The study of urban heat islands (UHI) plays a crucial role in understanding urban energy balance. To assess temperature variations across the twin cities and their surrounding areas, a UHI index is computed using the following equation:
![]()
where:
This calculation helps in identifying spatial variations in urban thermal intensity, providing insights into temperature disparities between built-up and non-urbanized regions.
Kappa Co-efficient
The Kappa Coefficient is created as a statistical measure to assess the accuracy of categorisation. When the K value is zero, it means that the classification is no more accurate than random selection. A K value around 1 signifies a considerable improvement in categorization compared to random (eq. 5).
Kappa (K) = (total accuracy - random accuracy)/ (1-random accuracy) [5]
West Bengal, Chhattisgarh, Andhra Pradesh, and Jharkhand are the states that border Odisha, which is situated in the eastern region of the Indian subcontinent. Geographically, it lies between latitudes 17° 47? N to 22° 34? N and longitudes 81° 22? E to 87° 29? E in the tropical zone.12 The second-biggest city in Odisha, Cuttack was once the capital of the historical state of Odisha. The study area spans an approximate area of 147 square kilometres and is roughly between latitudes 20° 21' and 20° 30' N and longitudes 85° 46' E and 85° 57' E.28 It functions as the Cuttack district's administrative centre. Cuttack (CTC), with its millennium history and renowned silver filigree works, is referred to as the "Silver City" as well as the "Millennium City." The city is surrounded on the southeast by Old Jagannath Road and boasts a deltaic location sandwiched between the Kathajodi and Mahanadi rivers. Cuttack begins at Kandarpur in the east and extends west as far as Naraj, while it stretches from Phulnakhara in the south over the Kathajodi to Choudwar in the north across the Birupa River. The city is traversed by four rivers: the Mahanadi and its distributaries, the Kathajodi, Kuakhai, and Birupa. At the head of the delta (between the branches of the Mahanadi River and Kathajodi River), a new township known as "Satellite Town"-Mahanadi Vihar, Markat Nagar, Naranpur, Jagatpur, etc. emerged because of the massive urban expansion. A significant number of people have moved into the area surrounding the twin city because of the development of the majority of the administrative offices, hospitals, educational facilities, and industries. Because of its proximity, growth trajectory, and economic interdependence, the concept of the Bhubaneswar-Cuttack twin city was born.
Bhubaneswar (BBSR) is positioned on the western side of the coastal plains of Odisha, within the Khurda district, along the major axis of the Eastern Ghats. Geographically, it lies between 20°12’N to 20°25’N latitude and 85°44’E to 85°55’E longitude. The city is situated along the Kuakhai River, a tributary of the Mahanadi, and forms part of the western segment of the Mahanadi delta. With an average elevation of 45 meters above mean sea level (MSL), Bhubaneswar is positioned along the mid-coastal plains of Odisha.29 One of the biggest urban agglomerations in Odisha is Cuttack-Bhubaneswar, home to over 80,000 people living in 59 wards. The city is 148.10 square kilometers in total size. The first capital of Odisha after independence, Bhubaneswar (M. Corp + OG) was planned in 1946 by German architect Dr. Otto H. Königsberger, who also designed Cuttack in 1999. As part of the "Smart City Mission of Government of India," Bhubaneswar has emerged as one of the most significant smart cities in Odisha. "Temple City" is another well-known name for the city. The Daya River borders the city on the south, while the Kuakhai River borders it on the north. Eastern lowland and western upland are its defining features. The topographical features of the city are characterized by the existence of hillocks in the northern and western regions. The city has acquired a dumbbell shape dissected by NH-5 into northern new BBSR and southern old BBSR. The city is the epitome of educational and research institutions along with tertiary and economic activities. The city is experiencing population pressure due to the tremendous growth in education and the economy. As a result, many planned residential extensions, such as those in Sahid Nagar, Nayapalli, Chandrasekharpur, and Niladri Bihar, are being built to accommodate the expanding population.
Table 2: Demographic profile of Twin City
Characteristics | Bhubaneswar (M. Crop + O.G) | Cuttack (M. Crop) |
Wards | 59 | 67 |
Area | 148.10 sq. km. | 149.16 sq. km. |
Population | 8,85,363 | 6,10.189 |
Sex-ratio | 892 | 929 |
No. of households | 196496 | 123034 |
S.C Population | 69521 | 70629 |
S.T Population | 42374 | 9238 |
Results
Urbanization brings three types of changes viz. Demographic, Behavioural, and functional. Urbanization spawns’ employment opportunities in different economic sectors, advanced technological and infrastructural facilities, modern transport and communication systems, and improved education and health systems. It acts as the urban expansion thus leading to improved quality of life with economic growth, social development, and cultural mixing.
The study deals with LU/LC change dynamics of 30 decades in the years of 1990, 2001, 2010 and 2020 of the Cuttack-Bhubaneswar twin cities. Here, six LU/LC classes—built-up land, vegetation cover, land for agriculture, open area, water bodies, and sand—are distinguished for both cities.
The Cuttack- Bhubaneswar twin city came into existence due to the proximity location, growth and economic inter-dependency. Administrative offices, educational and industrial hubs, health facilities and accessibility of transportation facilities have been developed in and around the twin city which promotes the population influx and amplifies the urban expansion.
The twin city (BBSR - CTC) is developed at a rapid pace. For both cities, the built-up land has been increased around 145.85% (CTC) and 152.26% (BBSR). The rapid acceleration of growth of urbanization and expansion of built-up area deduces the area under agricultural land (- 82.60%) and open space (- 41.05%) in CTC (1990-2020). The propagation of built-up areas and sand mining reduces the area under sand cover (-32.58%) from 1990 to 2020 in Cuttack. The area under vegetative cover has been reduced across the four years (-70.20%). The area under waterbody has decreased at the rate of -9.28% in the city during the three decades. Bhubaneswar has experienced a significant reduction in agricultural land, vegetative cover, open spaces, and water bodies because of human activity and the fast growth of populated places. Unlike Cuttack, where sand cover has decreased, Bhubaneswar has seen an increase in land with sand deposits. In 1990, built-up areas were mostly concentrated in the city's central region, while the western and southwestern parts remained dominated by open spaces and vegetation due to the presence of hilly terrain. Agricultural land was primarily found along the northern, eastern, and southern periphery.
By 2001, urban expansion had replaced a large portion of agricultural and vegetative land, with open spaces being converted for agricultural use. The trend continued in 2010 as built-up areas further expanded, encroaching upon the surrounding landscape. Built-up structures substantially replaced the water bodies that were previously concentrated in the city's southern, northeastern, and northern regions. By 2020, significant changes were observed across the urban landscape, with a drastic decline in water bodies and open spaces due to continued urbanization. Only a small patch of vegetation remains on the western side, while some agricultural land persists in the city's northern section. Scattered open areas are still visible in certain areas (Fig. 2).
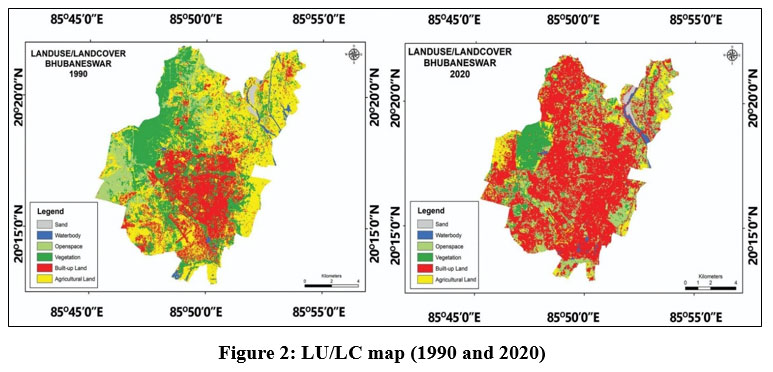 | Figure 2: LU/LC map (1990 and 2020)
|
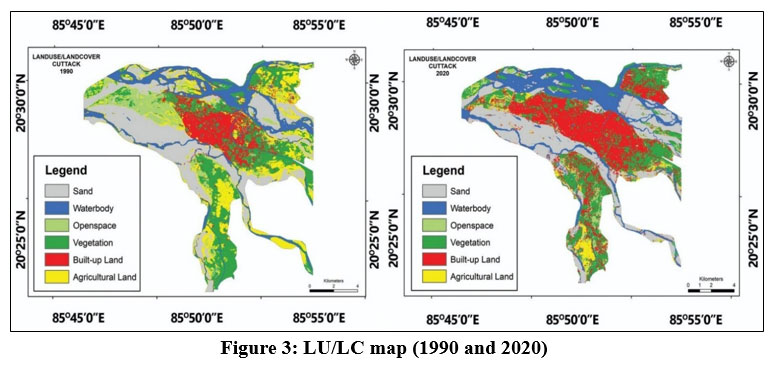 | Figure 3: LU/LC map (1990 and 2020).
|
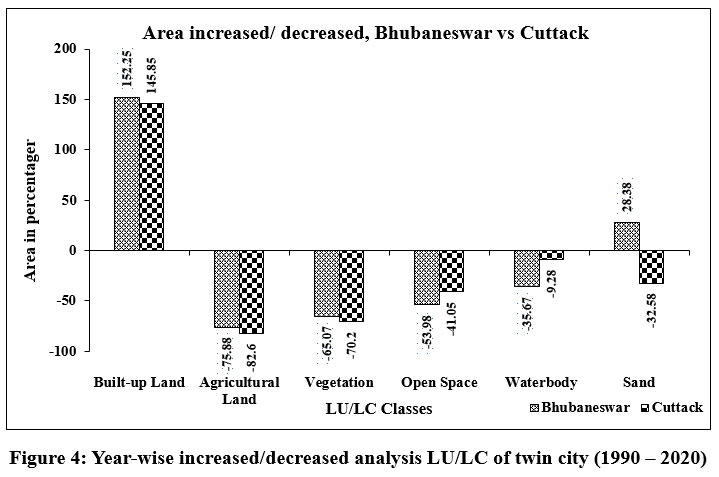 | Figure 4: Year-wise increased/decreased analysis LU/LC of twin city (1990 – 2020).
|
Many regions of the BBSR had good vegetation in 1990, but because of population pressure and urbanization, those areas are witnessing a decline in vegetation and an increase in the urban environment. The expansion of urban areas can be attributed to variations in land value across the study region. So, people migrate to the open space areas and start to reside encroaching on the agricultural land due to the low land value. Thus, in 2020, the NDVI map (Fig. 5) shows the greenery change of the city due to rapid urbanization. The same condition also prevails in the case of CTC city (Fig. 6) but with the pace of urbanization, the vegetation quality degrades more in BBSR than in CTC from 1990-2020. Tables 3 and 4 depict that the built-up area increased sharply during the three decades in both cities. In Cuttack and Bhubaneswar, the proportion of agricultural land is passing through negative growth rates - 82.59% and - 75.88% respectively (1990-2020). The share of vegetated land in Cuttack has decreased continuously from 1990 to 2020 with a -70.20% growth rate. In CTC, vegetation cover is also reducing from 1990 to 2020 with negative growth (-65.07%). The share of open space accounts for 0.07% in 2020 which is lower than in 1990 with an 8.66% share but there is a sharp upward curvature of the trend graph in the years 2001 and 2010. The share of water bodies also shows a similar trend to open space. The land share under sand cover is continuously falling due to sand mining and possession by built-up areas (Table 3).
Table 3: Area Calculation of classification image of Cuttack City in different years
Class Names (Cuttack) | Area in Hec (Hec.) | Area in Percentage (%) | ||||||
1990 | 2001 | 2010 | 2020 | 1990 | 2001 | 2010 | 2020 | |
Built-up land | 1779.57 | 2736.69 | 3576.277 | 4374.99 | 10.79 | 17.50 | 22.93 | 37.09 |
Agricultural land | 3061.71 | 3113.68 | 2699.004 | 532.89 | 18.56 | 19.91 | 17.30 | 4.51 |
Vegetation | 3690.63 | 1583.28 | 1473.007 | 1099.81 | 22.37 | 10.12 | 9.45 | 9.32 |
Open space | 1429.11 | 2722.212 | 2441.308 | 842.49 | 8.66 | 17.41 | 15.65 | 0.07 |
Waterbody | 2313 | 2248.98 | 2158.052 | 2098.36 | 14.02 | 14.38 | 13.83 | 17.78 |
Sand | 4222.71 | 3590.028 | 3246.889 | 2846.889 | 25.60 | 20.38 | 20.84 | 24.13 |
TOTAL | 16496.73 | 15634.87 | 15594.537 | 11795.429 | 100 | 100 | 100 | 100 |
Source: District Census Handbook, Odisha, Census of India, 2011
In Bhubaneswar, the vegetation covers drastically reduced from the year 1990 (26.30%) to 11.28% in 2020. The share of open space has thrived from 9.73% (1990) to 5.49% (2020). The land share of sand cover shows positive growth. On the other hand, the proportion of water bodies falls from 1.90% (1990) to 1.50% (2020) with a slight increase in mid-years (Table 4).
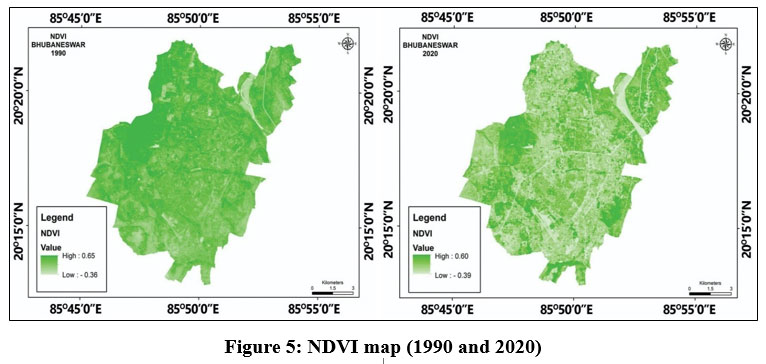 | Figure 5: NDVI map (1990 and 2020).
|
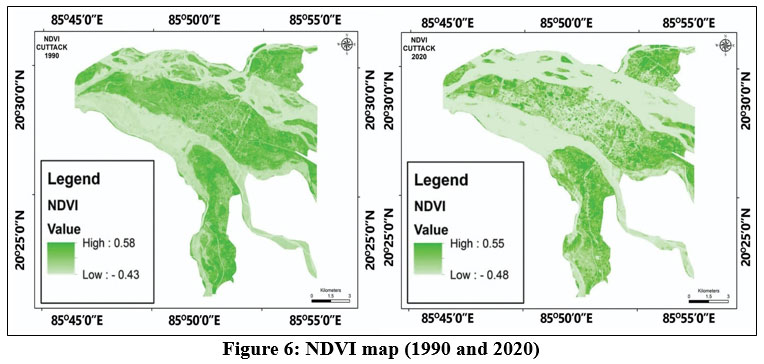 | Figure 6: NDVI map (1990 and 2020)
|
Table 4: Area calculation of classification image of Bhubaneswar City in different years
Class Names (Bhubaneswar) | Area in Hec (Hec.) | Area in Percentage (%) | ||||||
1990 | 2001 | 2010 | 2020 | 1990 | 2001 | 2010 | 2020 | |
Built-up land | 3249.27 | 4668.426 | 7059.511 | 8196.48 | 22.35 | 32.13 | 43.49 | 69.23 |
Agricultural land | 5690.88 | 5550.095 | 5340.389 | 1372.59 | 39.15 | 38.19 | 32.90 | 11.59 |
Vegetation | 3822.39 | 2199.301 | 1585.398 | 1334.97 | 26.30 | 15.13 | 9.76 | 11.28 |
Open space | 1413.63 | 871.8998 | 715.7158 | 650.46 | 9.73 | 6.00 | 4.41 | 5.49 |
Waterbody | 276.75 | 1118.137 | 1393.27 | 178.02 | 1.90 | 7.69 | 8.58 | 1.50 |
Sand | 82.44 | 123.7086 | 136.6936 | 105.84 | 0.57 | 0.85 | 0.86 | 0.89 |
TOTAL | 14535.36 | 14532 | 16230.98 | 11838.36 | 100 | 100 | 100 | 100 |
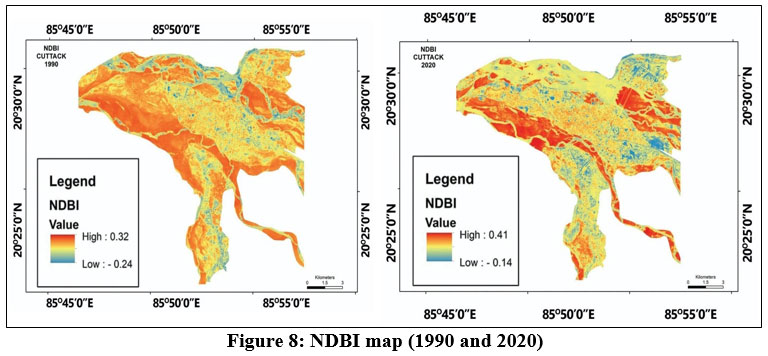
Mainly, the urban expansion has occurred encircling the north, northeast, south, and central parts of the city. The western side is also experiencing urban expansion in BBSR (Fig. 7). The urban expansion mainly occurred in the central part of Cuttack City as well as it also spread to the northern and southern parts of the city. In 2020, the western and eastern parts where agricultural land and open space exist, are now converted to urban built-up areas (Fig. 8).
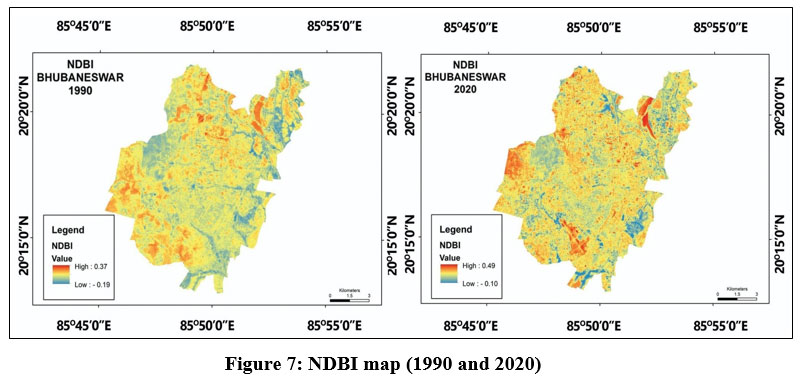 | Figure 7: NDBI map (1990 and 2020).
|
 |
|
Discussion
In 1990, the land surface temperature (LST) in Cuttack ranged from 24.30°C to 35.50°C, with an average of 29.90°C. By 2001, the temperature range shifted to 24.54°C (minimum) and 28.25°C (maximum), averaging 26.69°C. In 2010, temperatures fluctuated between 25.04°C and 29.65°C, with a mean of 27.34°C. By 2020, the minimum and maximum temperatures had increased to 34.57°C and 41.40°C, respectively, with an average of 37.98°C. This indicates that between 1990 and 2020, the temperature variations in Cuttack ranged approximately from 10.27°C to 5.90°C.
Similarly, in Bhubaneswar, the LST in 1990 ranged between 26.54°C and 36.43°C. In 2001, the minimum and maximum temperatures were recorded at 24.75°C and 27.48°C, respectively. The temperature continued to vary, reaching 25.32°C (minimum) and 29.06°C (maximum) in 2010, while in 2020, it further increased to 36.67°C and 43.25°C. Over the 30 years, temperature differences in Bhubaneswar fluctuated between 10.13°C and 6.82°C.
The LST maps of both cities indicate that higher temperatures are represented by red shades, whereas cooler temperatures appear in green. A notable increase in temperature was observed in Bhubaneswar, where the maximum LST rose from 36.43°C in 1990 to 43.25°C in 2020 (Fig. 9). In Cuttack, the corresponding increase was from 35.50°C in 1990 to 41.40°C in 2020 (Fig. 10). In Bhubaneswar, between 2001 and 2010, the intensification of red zones across the western and central parts of the city was attributed to rapid urban expansion, infrastructural growth, and increased concretization, particularly with the development of high-rise glass buildings. However, by 2020, the previously deep red areas had transitioned to a yellowish shade, indicating a reduction in LST. This change suggests that government-led initiatives such as rooftop gardening, urban greening programs, and afforestation efforts contributed to
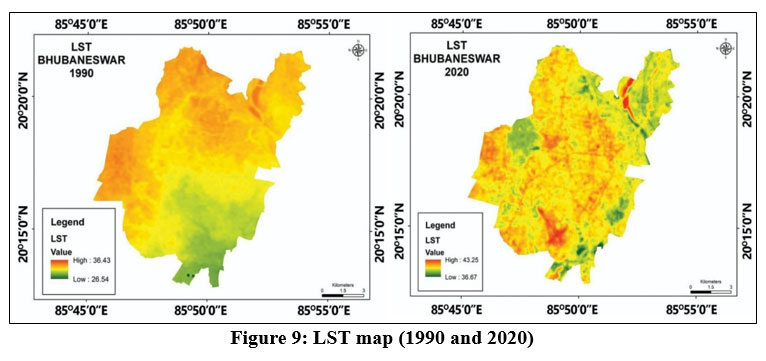 | Figure 9: LST map (1990 and 2020)
|
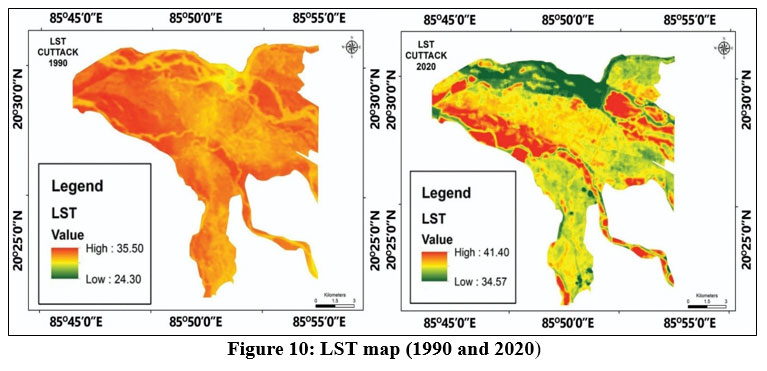 | Figure 10: LST map (1990 and 2020)
|
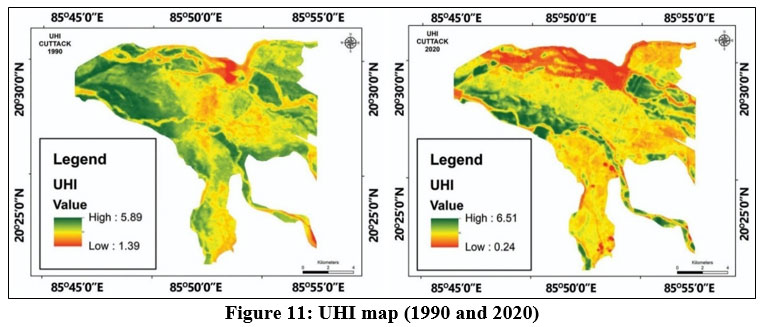
UHI is considered as evidence of urban climatic features. UHI exerts its influence and alters the urban ecological balance, soil quality, urban atmospheric environment, hydrological condition, biochemical cycle and human health.30 The UHI mapping follows the LST mapping for both of the cities. The green-to-red colour indicates high to low urban heat islands from the year 1990 to 2020. As the LST is increasing, the UHI is also increasing for the twin cities. Due to the riverine deltaic location, the sand bar is heated more. Therefore, in 1990 the UHI value was high along the river bank and medium in the central part of the city. In 2020, due to the encroachment of the river banks by the rapid expansion of the built-up areas, the greenish colour with a high UHI value was converted into a yellowish colour with a medium UHI value. So, the sand bars are the main controlling factor of UHI in CTC (Fig. 11). Sand mining is also an important factor in reducing LST and UHI conditions.
 |
|
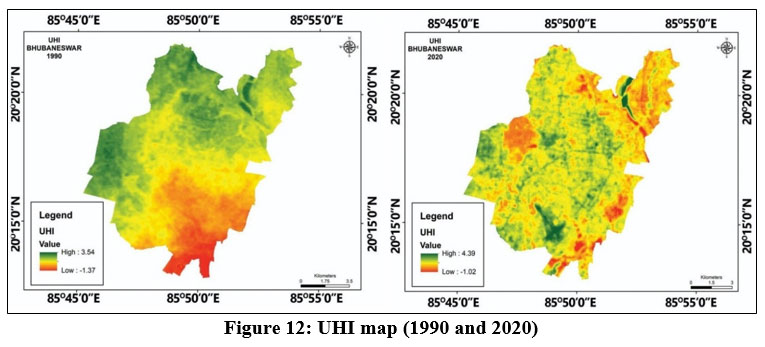 | Figure 12: UHI map (1990 and 2020).
|
Urban Density & Compactness: Cuttack is an older, densely populated city with a compact urban layout; narrow streets and closely packed buildings trap more heat, reducing airflow and increasing localised warming. In contrast, Bhubaneswar has a more planned urban structure with wider roads and open spaces. These factors contribute to the UHI effect being generally stronger in Cuttack than in Bhubaneswar. Green Cover & Open Spaces: Because of its historical, uncontrolled growth and land limits, Cuttack has comparatively fewer green spaces than Bhubaneswar, which has more parks, tree-lined roadways, and open areas that help reduce temperatures. Water Bodies and Drainage: Although the Mahanadi and Kathajodi rivers encircle Cuttack, urbanisation has resulted in the loss of wetlands and other natural water bodies, decreasing their cooling effect. In contrast, Bhubaneswar still has lakes that are in good working order and better-planned water drainage, which also helps to keep the heat down. Building Materials & Surface Reflectivity: Bhubaneswar boasts more contemporary structures with reflective surfaces and improved thermal management, while Cuttack features older structures made of heat-absorbing materials like brick and concrete that hold heat for longer. Traffic and Industrial Activities: Bhubaneswar has greater airflow and more effective heat dispersion due to its planned road networks, but Cuttack has more commercial hubs and more traffic congestion, which increases heat generation.
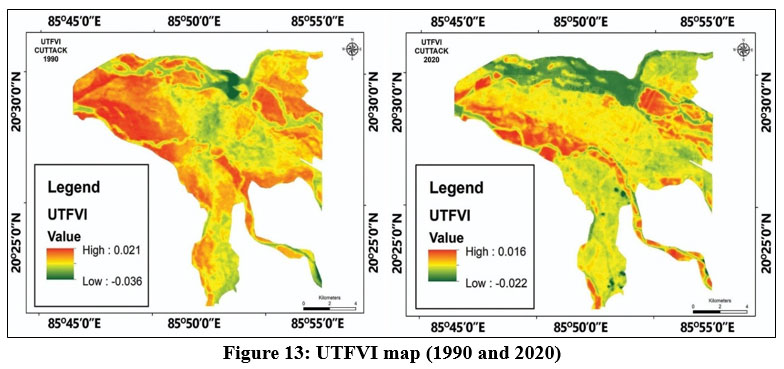
The vulnerability of Surface Heat Island (SUHI) can be measured by UTFVI.31 NDVI and NDBI maps of both cities depict that the healthy vegetation cover is continuously degrading in both cities due to the continuous urban expansion, deforestation, and population boom. People of both cities prefer to live in the open spaces or by cutting the vegetative cover at the periphery or fringe areas due to low land values. Hence, in both cities, built-up areas spread out in the surrounding region because of low land value with low house rent and availability of large areas act as centrifugal forces in the twin cities to shove people from the city centre towards the periphery regions. The natural environment converts into an urban environment for both cities. UTFVI expresses the eco-environmental condition of the twin cities. Deterioration of vegetative cover and increase of built-up area with an acceleration rate of LST and UHI have triggered the decrease of UTFVI value in both cities between 1990 and 2020.
In, CTC, the areas under sand bars along the riverside have high LST and UHI values, hence, the UTFVI is also high (>0.021) which implies that there is the worst condition in 1990. The UTFVI value improved from 1990 to 2020 (0.021-0.016) as the sand bars were converted in built-up areas and vegetative land cover which reduces heat absorption resulting in low LST and UHI (Fig. 13).
 |
|
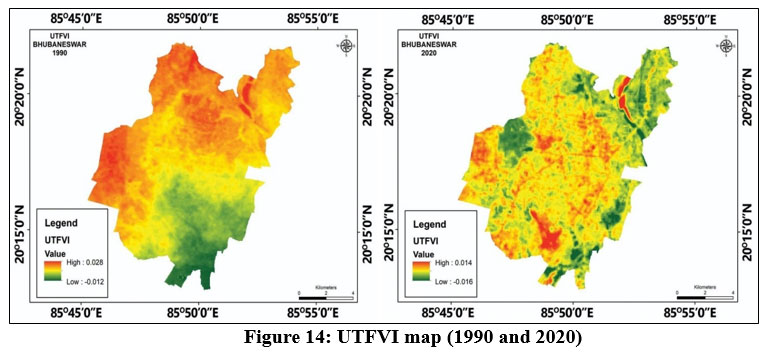 | Figure 14: UTFVI map (1990 and 2020).
|
From the error matrix of the year 2020, it is revealed that the accuracy level or inter-rate reliability of LU/LC classification in CTC is 78% (K Value) which means the strength of agreement is good (Table 6) and in the case of BBSR the K value is 70% (Table 5) which is lesser than K value of CTC but the strength of agreement is same i.e. good.
Table 5: Accuracy assessments using the error matrix table of the classification image of Bhubaneswar City, 2020.
Classes | Ground Truth | Row Total | Commission Error | Users Accuracy | ||||||
Built-Up Land | Agricultural Land | Vegetation | Open Space | Waterbody | Sand | |||||
Predicted / Classified | Built-up Land | 24 | 0 | 0 | 5 | 9 | 0 | 38 | 12 | 63% |
Agricultural Land | 1 | 19 | 7 | 5 | 1 | 0 | 33 | 0 | 58% | |
Vegetation | 0 | 0 | 17 | 0 | 0 | 0 | 17 | 26 | 100% | |
Open space | 0 | 6 | 1 | 14 | 0 | 1 | 22 | 27 | 64% | |
Waterbody | 0 | 0 | 0 | 1 | 14 | 0 | 15 | 10 | 93% | |
Sand | 0 | 0 | 0 | 0 | 1 | 24 | 25 | 12 | 96% | |
Column Total | 25 | 25 | 25 | 25 | 25 | 25 | 150 | |||
Comission Error | 4 | 22 | 11 | 27 | 1 | 3 | ||||
Producer's Accuracy | 96% | 76% | 68% | 56% | 56% | 96% | ||||
Table 6: Accuracy assessments using the error matrix table of the classification image of Cuttack City, 2020.
Classes | Ground Truth | Row Total | Commission Error | Users Accuracy | ||||||
Built-Up Land | Agricultural Land | Vegetation | Open Space | Waterbody | Sand | |||||
Predicted / Classified | Built-up Land | 24 | 0 | 0 | 0 | 0 | 0 | 24 | 0% | 100% |
Agricultural Land | 0 | 17 | 9 | 6 | 0 | 0 | 32 | 47% | 53% | |
Vegetation | 0 | 0 | 15 | 0 | 0 | 0 | 15 | 0% | 100% | |
Open space | 1 | 6 | 1 | 19 | 0 | 0 | 27 | 30% | 70% | |
Waterbody | 0 | 1 | 0 | 0 | 23 | 1 | 25 | 8% | 92% | |
Sand | 0 | 1 | 0 | 0 | 2 | 24 | 27 | 11% | 89% | |
Column Total | 25 | 25 | 25 | 25 | 25 | 25 | 150 | |||
Commission Error | 4% | 32% | 40% | 24% | 8% | 4% | ||||
Producer's Accuracy | 96% | 68% | 60% | 76% | 92% | 96% | ||||
Conclusion
Cuttack- Bhubaneswar twin city, bounded by Mahanadi and Kathajodi rivers is the only large urban agglomeration serving as an important urban complex in Odisha. Industrialization, agglomeration of different economic activities, transportation connectivity, and accessibility of basic services and amenities are the positive side of urbanization of the twin city. But this rapid urban expansion has also a negative impact on the environment as well as on human health. High-rise buildings, concretization, pavements, and sidewalks trap the heat with low terrestrial radiation. Urban flood is another important negative consequence of the rapid urbanization of the twin city. In both cities, the area under agricultural land and water bodies is continuously decreasing. Vegetative cover is degrading due to overwhelming construction and urbanization which is reducing groundwater recharge. Hence, the BBSR-CTC twin city is experiencing high levels of UHI conditions with the continuous increase of LST and air temperature. In a nutshell, proper rainwater harvesting, wetland development, development of urban green space, rooftop gardening, and proper tree plantation are necessary steps to combat the adverse impact of rapid urbanization by reducing LST and UHI.
BBSR is a new planned city in India after independence but still, it is facing the land surface temperature increase which is transforming it into an urban heat island. CTC is an old unplanned city in Odisha with a riverine deltaic location which will now allow the spatial expansion of the city after a certain limit. So, rapid urban expansion within an enclosed location is hammering the phenomena of LST and UHI increase. The study has tried to identify that the increasing LST and UHI are the outcomes of rapid urbanization, industrialization and dense transportation connectivity by occupying open space, agricultural land, filling the water bodies and degrading vegetative cover. The conversion of natural land cover by man-made land use plays a crucial role in land surface and air temperature rise in the twin city. Therefore, this is high time for the government and local people to take special concern and initiative to abate the phenomena of LST and UHI resulting in a negative impact on the fast-growing twin city.
Acknowledgement
The authors would like to express their appreciation to all the authors and online resources that were cited in this work. The authors would like to thank Dr. Kunal Kanti Maiti, GIS Expert, Vidyasagar University, West Bengal for supporting this research.
Funding Sources
The author(s) received no financial support for the research, authorship, and/or publication of this article
Conflict of Interest
The authors do not have any conflict of interest.
Data Availability Statement
This statement does not apply to this article.
Ethics Statement
This research did not involve human participants, animal subjects, or any material that requires ethical approval.
Informed Consent Statement
This study did not involve human participants, and therefore, informed consent was not required.
Author Contributions
Priyanka Chakraborty contributed to the conceptualization, study design, literature review, data interpretation, manuscript drafting, and revisions.
Md. Moinul Sk and Tapas Ranjan Patra were responsible for the literature review, data collection, experimental analysis, and validation of results.
Labani Sarkar, Sajal Ghosh, and Kalyan Sardar assisted in data analysis and manuscript preparation.
Reference
- Roth M., Chow W. T. L. A historical review and assessment of urban heat island research in Singapore. Singapore Journal of Tropical Geography. 2012, 33(3); 381-397. https://doi.org/10.1111/sjtg.12003
CrossRef - Stewart I. D., Oke T. R. Local Climate Zones for Urban Temperature Studies. Bulletin of American Meteorological Society. 2012, 93(12); 1879–1900. https://doi.org/10.1175/BAMS-D-11-00019.1
CrossRef - Jabbar H. K., Hamoodi M. N., & Al-Hameedawi A. N. Urban heat islands: a review of contributing factors, effects, and data. IOP Conference Series: Earth and Environmental Science, 3rd International Conference on Smart Cities and Sustainable Planning. 2023, 1129; 1-9. https://doi.org/10.1088/1755-1315/1129/1/012038
CrossRef - Oke T. R. The energetic basis of the urban heat island, Quarterly Journal of the Royal Meteorological Society.1982,108(455);1–24. https://doi.org/10.1002/qj.49710845502.
CrossRef - Wang K., Atkas, Y D., Stocker J., Carruthers D., Hunt J., Malki?Epshtein L. Urban heat island modelling of a tropical city: case of Kuala Lumpur. Geoscience Letters.2019, 6(4); 1-11. https://doi.org/10.1186/s40562-019-0134-2
CrossRef - Halder B., Bandyopadhyay J., Banik P. Monitoring the effect of urban development on urban heat island based on remote sensing and geo-spatial approach in Kolkata and adjacent areas, India. Sustainable Cities and Society. 2021, 74;1-18. https://doi.org/10.1016/j.scs.2021.103186
CrossRef - W. H. Organization. Health as the pulse of the new urban agenda, United Nations Conference on Housing and Sustainable Urban Development. Quito, October 2016, 1-44.
- Sk M. M., Ali S. A., Ahmad A. Optimal sanitary landfill site selection for solid waste disposal in Durgapur city using geographic information system and multi-criteria evaluation technique. KN-J Cartogr Geogr Inf. 2020; 70:163-80. https://doi.org/10.1007/s42489-020-00052-1
CrossRef - Sk M. M. Assessing vulnerability of a solid waste management system through GIS and the rank sum method: a case study of Durgapur city, India. Adv Environ Technol. 2025;11(1):36-62. http://dx.doi.org/10.22104/AET.2024.7053.1939
- Mohajerani A., Bakaric J., Jeffrey-Bailey T. (2017). The urban heat island effect, its causes, and mitigation, with reference to the thermal properties of asphalt concrete. Journal of Environmental Management. 2017, 197; 522-538. https://doi.org/10.1016/j.jenvman.2017.03.095
CrossRef - Peres L de Faria., Lucena A J de, Rotunno., Filho O C Rotunno., França J R de Almeida. The urban heat island in Rio de Janeiro, Brazil, in the last 30 years using remote sensing data. International Journal of Applied Earth Observation and Geoinformation. 2018, 64; 104–116, https://doi.org/10.1016/j.jag.2017.08.012
CrossRef - Patra P K., Behera D; Naik S P; Goswami S. Spatio-temporal variation of vegetation and urban sprawl using Remote Sensing and GIS: A case study of Cuttack city, Odisha, India. Journal of Geosciences Research. 2021, 6(2); 213-219.
- Tomlinson C J., Chapman L., Thornes J E., Baker C J. Including the urban heat island in spatial heat health risk assessment strategies: A case study for Birmingham, UK. International Journal of Health Geographics. 2011, 10(42); 1–14. https://doi.org/10.1186/1476-072X-10-42
CrossRef - Bagyaraj M., Senapati V; Kartikeyan S; Chung S Y; Khatibi R; Nadiri A A; Lajayer Ba. A study of urban heat island effects using remote sensing and GIS techniques in Kancheepuram, Tamilnadu, India. Urban Climate. 2023, 51. https://doi.org/10.1016/j.uclim.2023.101597
CrossRef - Mathew A., Sarwesh P., Khandelwal S; Shekar P R; Alao J O; Abdo H G. Thermal dynamics of Jaipur: analyzing urban heat island effects in-situ and remotely sensed data. Cogent Engineering. 2023, 10(2) ;1-36. https://doi.org/10.1080/23311916.2023.2269654
CrossRef - Shi H; Xian G; Auch R; Gallo K; Zhou Q. Urban heat island and its regional impacts using remotely sensed thermal data- A review of recent development and methodology. Land. 2021, 10(8); 1-30 .https://doi.org/10.3390/land10080867
CrossRef - Monteiro F F; Goncalves W A; Andrade L de M B; Villavicencio L M M; Silva C M dos Santos. Assessment of urban heat island in Brazil based on MODIS remote sensing data. Urban Climate. 2021, 35. https://doi.org/10.1016/j.uclim.2020.100726
CrossRef - Yin Z; Liu Z; Liu X; Zheng W; Yin L. Urban heat island and their effects on thermal comfort in the US: New York and New Jersey. Ecological Indicators. 2023, 154, https://doi.org/10.1016/j.ecolind.2023.110765
CrossRef - Siddiqui A., Kushwaha G; Nikam B; Srivastav S K; Shelar A; Kumar P. Analysing the day/night seasonal and annual changes and trends in land surface temperature and surface heat island intensity (SUHII) for Indian cities. Sustainable Cities and Society. 2021; 75. https://doi.org/10.1016/j.scs.2021.103374
CrossRef - Pandey A K., Singh S; Berwal S; Kumar D; Pandey P; Prakash A; Lodhi N; Maithani S; Jain V K; Kumar K. Spatio-temporal variation of urban heat island over Delhi. Urban Climate. 2014, 10(Part-1);119-133.https://doi.org/10.1016/j.uclim.2014.10.005
CrossRef - Yadav N., Sharma C., Peshin S K., Masiwal R. Study of intra-city urban heat island intensity and its influence on atmospheric chemistry and energy consumption in Delhi. Sustainable Cities and Society. 2017, 32; 202-211. https://doi.org/10.1016/j.scs.2017.04.003
CrossRef - Dewan A., Kiselev G; Botje D; Mahmud G I; Bhuian Md H; Hassan Q K. Surface urban heat island intensity in five major cities of Bangladesh: Patterns, drivers, and trends. Sustainable Cities and Society. 2021, 71. https://doi.org/10.1016/j.scs.2021.102926
CrossRef - Memon R. A., Dennis Y C; Chunho LIU. A review on the generation, determination, and mitigation of Urban Heat Island. Journal of Environmental Sciences. 2008, 20(1); 120-128. https://doi.org/10.1016/S1001-0742(08)60019-4
CrossRef - Wong N H., Yu C. Study of green areas and urban heat island in a tropical city. Habitat International. 2005, 29(3); 547-558. http://dx.doi.org/10.1016/j.habitatint.2004.04.008
CrossRef - Mehdi B., Zarkesh M K; Arasteh P D; Hosseini A. Assessment of Urban Heat Island on the relationship between land surface temperature and Land Use/ Land Cover in Tehran. Sustainable Cities and Society. 2016, 23;94-104. https://doi.org/10.1016/j.scs.2016.03.009.
CrossRef - Kikon N., Singh P; Singh S K; Vyas A. Assessment of urban heat islands (UHI) of Noida city, India using multi- temporal satellite data. Sustainable Cities and Society. 2016, 22; 19-28. http://dx.doi.org/10.1016/j.scs.2016.01.005
CrossRef - Ryu Y H., Baik J J. Quantitative analysis of factors contributing to urban heat island intensity. Journal of Applied Meteorology and Climatology, 2012, 51(5); 842-854. https://doi.org/10.1175/JAMC-D-11-098.1
CrossRef - Daspattanayak P., Das P P. (2016). Building spatial database for Cuttack Municipal Corporation: A Geospatial Technological Approach. International Journal of Research in Engineering and Technology. 2016, 5(1); 58-63. https://doi.org/10.15623/IJRET.2016.0501010
CrossRef - Achary G S., Mohanty S K., Pattanaik N. Comparative study over the years of ground water quality in Bhubaneswar city. International Journal of Current Engineering and Technology. 2013, 3(5); 1720- 1729.
- Yang L., Qian F., Song D-Xuan., Zheng, Ke-Jia. Research on Urban Heat-island Effect. Procedia Engineering. 4th International Conference on Countermeasures to Urban Heat Island (UHI). 2016, 169; 11-18. https://doi.org/10.1016/j.proeng.2016.10.002 .
CrossRef - Naim Md. N H., Kafy Abdulla A. (2021). Assessment of urban thermal field variance index and defining the relationship between land cover and surface temperature in Chattogram city: A remote sensing and statistical approach. Environmental Challenges. 2021, 4; 1-14. https://doi.org/10.1016/j.envc.2021.100107
CrossRef


