Green Space Cooling Effect and Relation to Mitigate Surface Urban Heat Island Effect of Metropolitans Cities of India
Rupesh Kumar Gupta
*

1
Department of Continuing Education and Extension,
Faculty of Social Sciences, University of Delhi,
Delhi
India
Copy the following to cite this article:
Gupta R. K. Green Space Cooling Effect and Relation to Mitigate Surface Urban Heat Island Effect of Metropolitans Cities of India. Curr World Environ 2024;19(2).
Copy the following to cite this URL:
Gupta R. K. Green Space Cooling Effect and Relation to Mitigate Surface Urban Heat Island Effect of Metropolitans Cities of India. Curr World Environ 2024;19(2).
Citation Manager Publish History

Introduction
The definition of an urban heat island (UHI) is a metropolitan area that experiences temperatures that are noticeably higher than the rural areas that surround it1. Human activities include industrialization, transportation, energy generation, and replacing natural vegetation with impermeable surfaces, like building areas, asphalt, etc., that absorb and hold heat2,3. The primary classifications of urban heat islands are surface (SUHI) and atmospheric (AUHI)4. Summertime is when SUHI is most noticeable, and winter and nighttime are when AUHI is most noticeable5. UHIs have been linked to various environmental and health issues, such as increased energy consumption for cooling, heat-related health problems, and elevated pollution levels6. Mitigating UHIs is crucial for reducing cooling energy demands, preventing smog formation, and improving overall urban environmental quality2.
The presence of Urban Green spaces (UGS) helps to mitigate the effect of Urban Heat Islands due to evapotranspiration and cooling effects7,8,9. The presence of vegetation cover significantly decreases the air temperatures of the adjacent areas10, 11. The green spaces also create a cooler microclimate near them and help in reducing the SUHI effect12, 13. Vulnerable populations, particularly in underserved communities, are disproportionately affected by extreme heat events 14. On the other hand, urban greenspaces have been found to affect physical and mental health and well-being positively15. Their size and extent strongly influence the cooling effect of urban green spaces. On average, green spaces of around 50 hectares can reduce temperature ranges by 1.5–3.0 degrees Celsius16, 17, while larger areas exceeding 150 hectares exhibit even more pronounced cooling effects on the adjacent air temperatures8. Hence, the UGS proved effective in providing better thermal comfort to the urban dwellers residing in their vicinity. Increased exposure to greenspaces can benefit mental health by providing opportunities for social interaction, recreation, and relaxation18. Integrating greenery in urban planning, such as vertical greenery systems and green roofs, has been proven effective in mitigating UHIs19, 20. Optimising cooling efficiency with the help of green spaces is crucial to balancing urban development and minimising the influence of UHIs21.
This study uses remotely sensed data to compare the spatial pattern of the UHI effect in four metropolises in India. This approach advances our understanding of urban environments and the urban heat island effect. The index-based strategy allows a greater understanding of the link between LST, SUHI, UTFVI, and NDVI. Even though the UHI effect has been extensively studied elsewhere, more research is still required to fully understand the influence of SUHI and other index-based methods. This study closes a knowledge gap by explaining how greenness could mitigate the impact of SUHI in a rapidly growing Indian metropolis.
This work adds a new perspective on the cooling effect of green areas and how they can mitigate the effects of SUHIs on urban microclimates and habitats, which has substantially enhanced our understanding of the topic. This study investigates LST patterns on the ground, the impact of heat islands on the surface, and the cooling impacts of UGS on the LST and its surroundings in a metropolitan area of India. It is predicated on index-based methodology and data from remote sensing. We can also solve the issue that just a few urban cooling studies have examined the thermal effects of green space samples by examining every green area in a large city. Additionally, the study expands our knowledge of the regional impacts of surface temperature and heat islands on the ground, which assist decision-makers and administrators in creating practical strategies to relieve the harmful effects of heat islands on urban ecosystems and people's health.
Methodology
Location
Four Indian metropolitan cities, i.e. Delhi, Lucknow, Jaipur, and Ahmedabad, were considered for the study due to their geographical location and that face similar contemporary urban issues like infrastructure development, pollution, health concerns, etc.
Delhi, a crucial part of India's National Capital Region, rests in the north of the country, averaging 216 meters above sea level across its approximately 1483 square kilometres. Important geographical features include the Yamuna floodplains and the Delhi Ridge. With a population of around 17 million as of the 2011 Census, Delhi is renowned for its diverse landscapes, from ancient monuments to bustling markets, government offices, and modern residential and commercial sectors.
The state capital of Rajasthan, Jaipur, is surrounded by the Aravalli Mountains and is amidst lush plains, hills, and immense deserts. The estimated population of Jaipur was 2.8 million in 2011, and it is a model city for urban planning and development.
Lucknow, the capital of Uttar Pradesh, is situated on the verdant alluvial plains of the Ganges River. The Gomti River is a major water channel in this area. With a population projected for the 2011 Census at over 4.6 million, the city's cultural tradition and modernity contribute to its increased regional relevance.
Ahmedabad, Gujarat's leading financial and commercial centre, is fortunate to have a diverse landscape. Warm summers and pleasant winters are typical of its semi-arid climate. Encircling the suburbs of Ahmedabad are desert landscapes with large areas of industrial and agricultural zones. As of 2011, the city has 5.5 million residents, symbolising economic activity, urban growth, and historical significance.
Datasets
The Landsat 8 datasets were incorporated to study the Green cover of the four cities using an index-based approach, whereas the thermal characteristics were extracted using the MODIS Terra satellite datasets (Table 1). Thermal and optical remote sensing data were collected to assess the spatial pattern of LST and land surface characteristics in these four cities. The USGS (United States Geological Survey) provided radiometrically calibrated and atmospherically corrected Landsat 8 data (L2), which was employed to assess land surface features. MODIS thermal data provided by NASA Earth data was used to create LST maps to evaluate the UHI effect on the cities.
Table 1: Details of the acquired Satellite Data.
Satellite | Landsat 8 – OLI & TIRS | MODIS - Terra |
Spatial Resolution | 30 × 30 m | 1000 × 1000 m |
Acquisition Period | June 2023 | June 2023 |
(TIRS, or Thermal Infrared Sensor; OLI, or Operational Land Imager)
Source: USGS-Earth Explorer & NASA Earth Data
Methodology
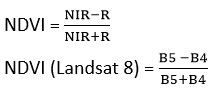
In several disciplines, including ecology, biology, agriculture, earth science, horticulture and forestry, the Vegetation Index of NDVI is a commonly used geo-statistic. It is a widely used indicator in many urban green space studies. NDVI is derived from the ratio of near-infrared (NIR) and red reflectance of vegetation, providing insights into vegetation greenness, productivity, and phenology22. It is a valuable indicator of vegetation health, biomass, and responses to environmental changes like climate fluctuations23.
A remote sensing-based approach can be beneficial for analysing green cover and the surface land temperatures of cities24, 25. Thermal infrared remote sensing has become a key technology in studying Urban Heat Islands26. The GIS tools and techniques can further utilise the acquired Remote Sensing data to study their spatial patterns and distribution and the correlation of the Green Cover and SUHI27, 28).
The NDVI is used to analyse the four cities' Urban Green Spaces29,30,31,32, 33. It is calculated by the following Equation34:
Where, NIR: Near Infrared
R: Red
B: Band
The Thermal characteristics of the cities were calculated using the MODIS LST data products35,36. To improve the results of the Surface Urban Heat Island, the LST Satellite datasets were enhanced by adding the UTFVI, or Urban Thermal Field Variance Index. Google Earth was also utilised to extract and verify the area characteristics of the NDVI. The values obtained from the indices were reclassified into High, medium, and low values. The results were further analysed, interpreted, and represented using various statistical tools.
Results and Discussions
Urban Green Spaces (UGS)
The spatial coverage of green spaces in cities was analyzed using data from the Landsat satellite. The range of NDVI values is +1 to -1; values closer to +1 suggest the existence of healthy plant cover, while values closer to -1 are associated with other land use classifications. The NDVI values calculated in the study give an insight into the state of health and intensity of vegetation in each of the discussed cities (Table 2). The higher values for NDVI maximum for Delhi (0.585), Ahmedabad (0.560), Jaipur (0.550), and Lucknow (0.416) imply that they have healthier and denser vegetation.
Table 2: NDVI Values
City | NDVI-Maximum | NDVI-Minimum |
Lucknow | 0.416 | 0.0171 |
Jaipur | 0.550 | -0.069 |
Ahmedabad | 0.560 | -0.072 |
Delhi | 0.585 | -0.136 |
Source: USGS Earth Explorer
Area Statistics with High NDVI Values for the four cities are indicated in Table 3. There is a significant variation in the percentage of high vegetation zones among the cities listed. Delhi has the highest rate at 28.29 per cent, followed by Ahmedabad at 26.77 per cent, Jaipur at 25.39per cent, and Lucknow at 21.16 per cent. Numerous factors, including geography, climate, bodies of water, and human activity, impact high vegetation zones. For example, areas along rivers like the Sabarmati in Ahmedabad, the Yamuna in Delhi, or the Gomati in Lucknow tend to have more vegetation due to water availability.
Table 3: High Vegetation Zones
City | High Vegetation Zones (per cent of total Area) | Location |
Lucknow | 21.16 | Kukrail Forest, Cantonment, RDSO, Outskirts along Hardoi Road, Janeshwar Park, Areas along Gomti |
Jaipur | 25.39 | The dense vegetation surrounding Jhalana Safari Park, Jal Mahal, Central Park, and the Aravali Mountains |
Ahmedabad | 26.77 | Sabarmati River-front neighborhoods to the city's north and south |
Delhi | 28.29 | Areas along the Yamuna, Kamla Nehru Ridge, Model Town, Dhirpur Wetland, Yamuna Biodiversity Park, PUSA Hill Forest, and the vicinity of JNU are examples of peri-urban areas in Northern and Southern Delhi. |
Source: USGS Earth Explorer
 | Figure 1: Index of Normalized Difference Vegetation
|
Source: USGS Earth Explorer
The Urban Surface Heat Island
LST is calculated using the brightness temperature measured by the satellite sensors. MODIS thermal bands measure brightness temperatures, converted into physical temperatures (LST) using GIS (Table 4).
Table 4: Maximum and Minimum Land Surface Temperatures
City | LST-Maximum (in °C) | LST-Minimum (in °C) |
Lucknow | 46.17 | 39.15 |
Jaipur | 45.51 45.19 | 37.17 |
Ahmedabad | 37.31 | |
Delhi | 47.27 | 32.93 |
Source: NASA Earth Data
The LST Calculation findings provide each city's thermal properties of the land surface. With a minimum of 39.15°C and a maximum of 46.17°C, Lucknow has the highest maximum LST, closely followed by Jaipur, which has a minimum of 37.17°C and a maximum of 45.51°C. In Ahmedabad, the minimum temperature is 37.31°C while the maximum temperature is somewhat lower at 45.19°C. Interestingly, Delhi displays the highest maximum LST among the cities at 47.27°C and the lowest minimum LST at 32.93°C, indicating significant temperature fluctuations within the town. However, Lucknow's temperature ranges between its maximum and minimum values with moderate variability (7.02°C). At 8.34°C, Jaipur's temperature range is somewhat broader than Lucknow's, indicating marginally more significant temperature swings. Ahmedabad exhibits a 7.88°C temperature range comparable to the fluctuations noted in Jaipur and Lucknow. With a range of 14.34°C, Delhi, on the other hand, exhibits the broadest range of temperatures among the cities, showing notable variations in temperature inside the town.
To show the Thermally Active and Inactive zones of the four cities, the Urban Thermal Field Variance index was also calculated using the LST. Higher UTFVI values indicate larger thermally active zones and, thus, more significant temperature variability. Conversely, uniform temperature distributions and thermally inactive zones are marked by lower UTFVI values.
The UTFVI of Lucknow has a range of 0.0075 to -0.0216, Jaipur 0.0143 to -0.0328, Ahmedabad, 0.0167 to -0.0269 and Delhi, 0.0110 to -0.0305, respectively (Table 5).
Table 5: UTFVI (Urban Thermal Field Variance Index) values.
City | UTFVI-Maximum | UTFVI-Minimum |
Lucknow | 0.0075 | -0.0216 |
Jaipur | 0.0143 | -0.0328 |
Ahmedabad | 0.0167 | -0.0269 |
Delhi | 0.0110 | -0.0305 |
Source: NASA Earth Data
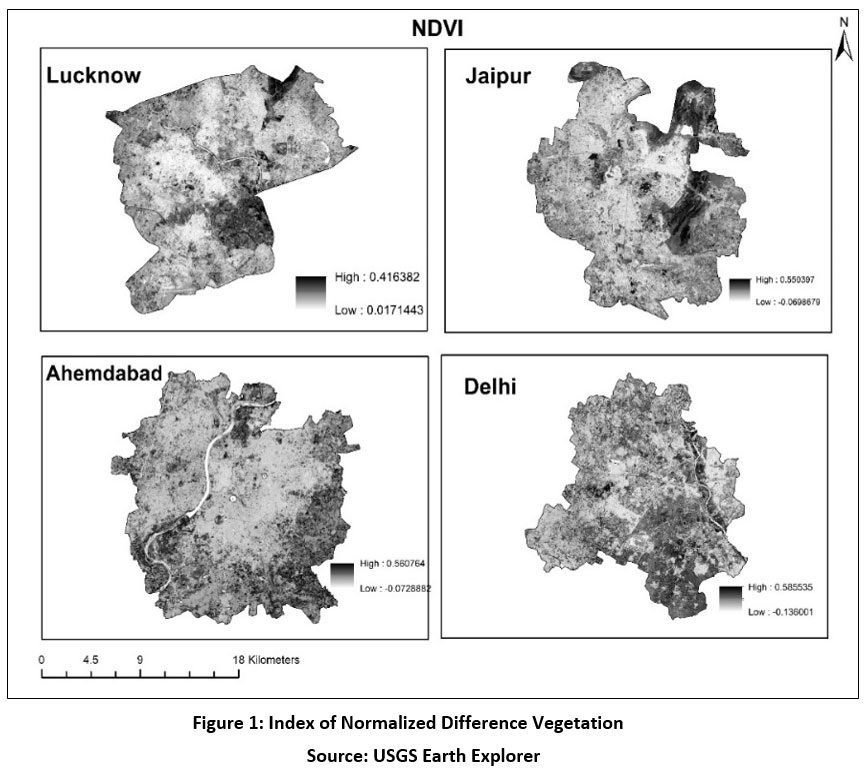
Spatial Distribution of SUHI potential zones has been depicted in Table 6, where Lucknow shows 29.41 per cent of its total area characterized by a Low potential SUHI Zone, contrasting with 15.97 per cent designated as a high potential SUHI Zone. Jaipur exhibits a 12.69per cent High potential SUHI Zone and 30.45per cent low potential SUHI Zone, indicating a notable prevalence of favourable thermal conditions. Similarly, Ahmedabad presents an 18.37per cent High potential SUHI Zone and a 27.62per cent low potential SUHI Zone. Delhi features a 14.98per cent High potential SUHI Zone but is significantly higher at a 39.97per cent Low potential SUHI Zone, suggesting a relatively higher prevalence of thermally favourable environments despite existing challenges (Figure 2).
Table 6: Surface Urban Heat Island Potential Zones
City | Low potential SUHI Zone (per cent of total Area) | Medium potential SUHI Zone (per cent of total Area) | High potential SUHI Zone (per cent of total Area) |
Lucknow | 30.11 | 51.74 | 18.15 |
Jaipur | 30.45 | 56.86 | 12.69 |
Ahmedabad | 35.53 | 50.92 | 13.55 |
Delhi | 40.20 | 42.63 | 17.17 |
Source: NASA Earth Data
 | Figure 2: depicts surface urban heat islands.
|
Source: NASA Earth Data
Table 7: Provides the specific Locations of the High and Low Potential SUHI areas
City | Low Potential SUHI | High Potential SUHI |
Lucknow | Areas around Kukrail Forest, RDSO, Cantonment zone, Kathauta Lake, and Mango orchards along Hardoi Road | Chowk, Balaganj, Thakurganj, Khadra, Alambagh, Indiranagar etc. |
Jaipur | The Aravali Mountains, Central Park, Jhalana Safari Park, and Jal Mahal are places with dense vegetation. | Bapu Bazar, Shastrinagar, and other northwest industrial neighborhoods of the city. |
Ahmedabad | the Chandola Lake, Kankaria Lake, Sabarmati River basin, certain peri-urban areas of the city, and so on. | The industrial zones in the east of the city, Old City, Khadia, and certain peri-urban areas south of the town are where open undeveloped land can be found. |
Delhi | Sites along the Yamuna River, Yamuna Biodiversity Park, JNU, Kamla Nehru Ridge, PUSA Hill Forest, and Dhirpur Wetland. | The Okhla industrial sites, Shahadra, Patparganj, Chandni Chowk, Karolbagh, and the peri-urban area consist of undeveloped property on the western fringe of the city, etc. |
Source: NASA Earth Data
An Analysis of the four Metropolitan Cities
Lucknow
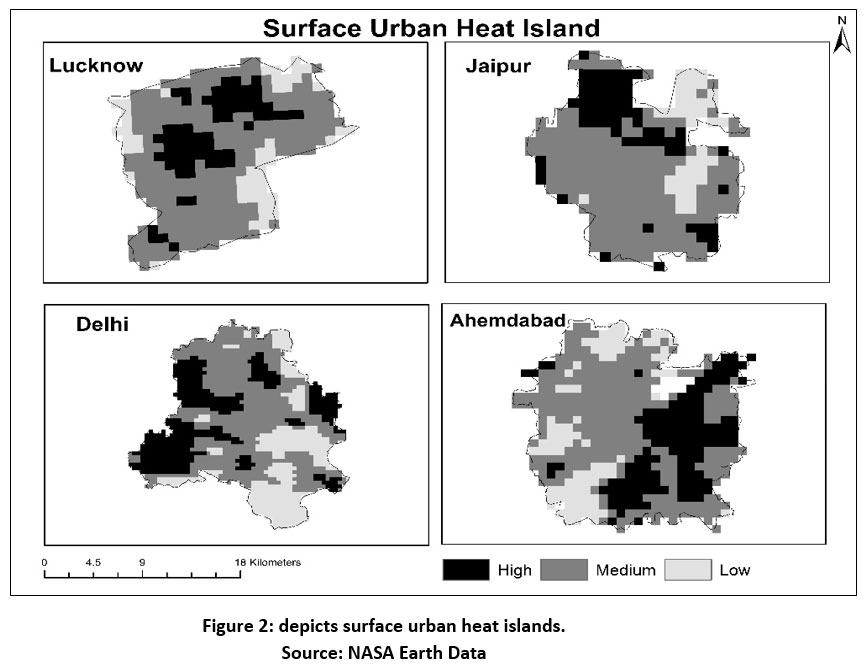
Most areas that experienced low values of LST were concentrated in the areas of high vegetation. The Areas around Kukrail forest (Figure 3a) experienced LST of around 39-40 °C, providing high thermal comfort to the nearby people. Similarly, abundant vegetation in the area of Cantonment (Figure 3b) provides much relief to the residents. The older parts of the city where there is a significant lack of vegetation receive sweltering temperatures, whereas the newly built areas like Gomtinagar and Ashiyana have been planned in such a way that the vegetation cover provides thermal comfort in the areas (Figure 3c). The NDVI research identifies various plant types, including urban parks, greenery, vegetation beside roads, and urban woodlands. These measures help diminish the severity of the Surface Urban Heat Island phenomenon by minimizing the LST values in the affected locations.
 | Figure 3: a-c. NDVI & LST of Lucknow
|
Source: Open-Source Satellite Data
Jaipur
Jaipur, a city recognized for its urban planning, saw a modest urban heat island due to green cover. The areas around Aravali(Figure 4a) and the northern part(Figure 4b) have been densely covered with greenery, which results in the cooling of nearby areas. The temperature found in these regions was around 39-40 °C. The greenery inside Jaipur also helps the city remain considerably excellent compared to the places that lack green cover (Figure 4c).
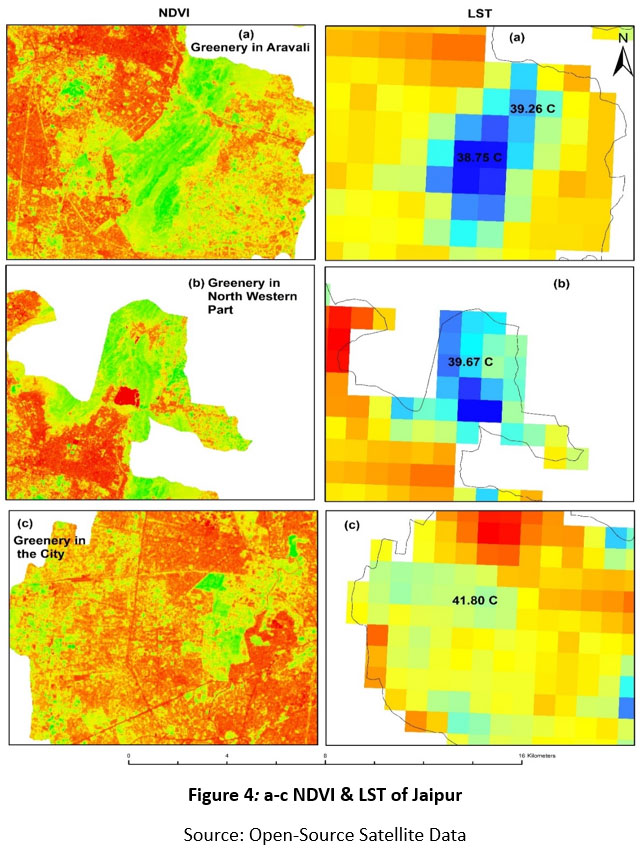 | Figure 4a-c: NDVI & LST of Jaipur
|
Source: Open-Source Satellite Data
Delhi
Delhi, India's most populated Urban centre, witnesses various landscapes like Urban forests, ridges, the Yamuna River, densely constructed buildings, etc. The areas around the dense vegetation areas like the Pusa, Kamla Nehru Ridge, and Asola experience the moderating influence of the green cover (Figure 5 a, b). Certain areas of Delhi with a good amount of green cover (Figure 5c) witness temperatures around 37- 39°C, less than the areas devoid of vegetation cover or with a high density of built-up areas.
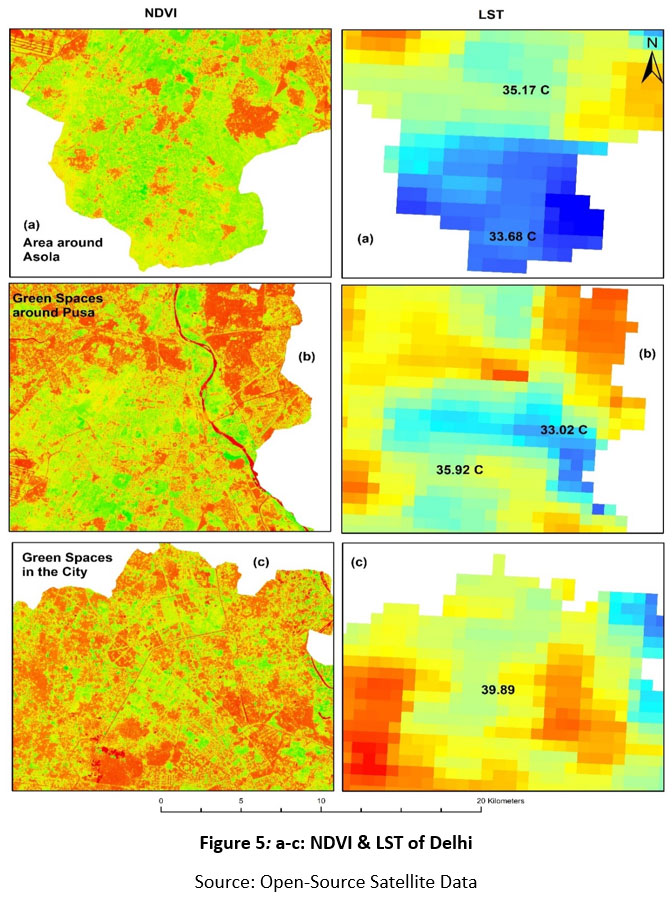 | Figure 5: a-c. NDVI & LST of Delhi
|
Source: Open-Source Satellite Data
Ahmedabad
Ahmedabad has a substantial amount of green cover in certain city pockets. The peri-urban areas of the city experience moderate temperatures due to the abundance of green cover. The areas of the Western city also have high levels of thermal comfort due to the presence of vegetative cover (Figure 6 a,b). The temperatures around the green spaces in Ahmedabad city were around 37-39°C. The northern part of the city also witnessed low LST values due to the vegetation cover (Figure 6c).
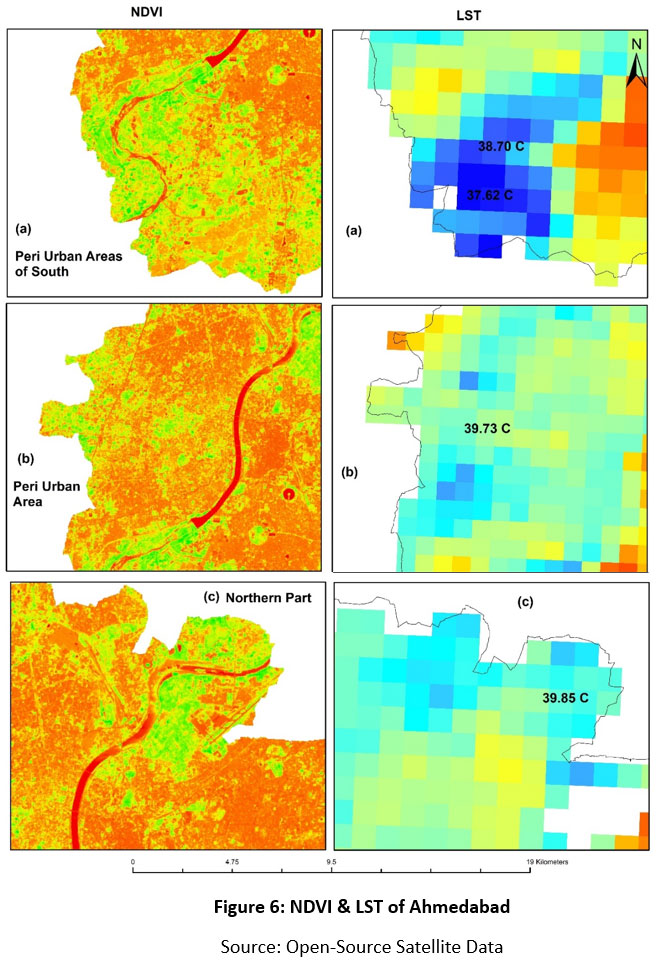 | Figure 6: NDVI & LST of Ahmedabad
|
Source: Open-Source Satellite Data
Conclusion
The study revealed valuable insights into the spatial distribution of green areas, LST, and the UHI phenomenon in four major Indian cities. Across these cities, Landsat satellite datasets revealed spatial patterns of green spaces through NDVI and LST estimates, showing each city's thermal peculiarities.
The spatial distribution of LST revealed a correlation between high vegetation areas and lower temperatures, highlighting the cooling effects of green spaces. Urban planning initiatives, such as those observed in Jaipur, demonstrated the moderating influence of green cover on temperature extremes within cities.
The rich tapestry of green spaces, from urban parks to green riverbanks, serves as a lifeline amid the concrete sprawl. These lush pockets are crucial in moderating temperatures, fostering biodiversity, and enhancing urban liveability. On the other hand, the disparities in land surface temperatures reflect the unequal distribution of urban heat islands, where densely built-up areas experience elevated thermal stress. The variability in thermal characteristics underscores the complexity of urban environments, shaped by various factors, including geography, climate, and human activities.
Hence, it becomes evident that promoting sustainable urban development requires a holistic approach that prioritizes the preservation and expansion of green infrastructure in the form of transforming vacant lands in the cities into urban parks, implementing green mufflers along roads, promoting rooftop gardens among citizens, installing vertical gardens in government and corporate offices. By integrating nature into the fabric of our cities, we can create more resilient, equitable, and vibrant urban environments that enhance the health and welfare of the present and subsequent generations.
Acknowledgement
The authors thank NASA Earth Data and the U.S. Geological Survey (USGS) for supplying the open-source satellite data. We appreciate the efforts of the editors and potential reviewers.
Funding Sources
There are no funding sources or financial support for this research work.
Conflict of Interest
The author declares there is no conflict of interest. The authors state that no known conflicting financial interest or personal relationship appears to have affected the work presented in this study.
Author Contribution
The author developed the idea and designed the study, organised the resources, gathered and analysed data, composed the article, proofread it, and granted approval.
Data Availability Statement
The datasets used and analysed in this work were from online open sources.
Ethics Approval Statement
Not applicable to this research work.
References
- Liu L., Zhang Y. Urban heat island analysis using the Landsat TM data and ASTER data: A case study in Hong Kong. Remote sensing. 2011; 3(7) 1535-1552.
- Akbari H., Rose L. Urban surfaces and heat island mitigation potentials. Journal of the Human-Environment System. 2001; 11(2) 85-101. https://doi.org/10.1618/jhes.11.85
- Sailor D., Lu L. A top–down methodology for developing diurnal and seasonal anthropogenic heating profiles for urban areas. Atmospheric Environment. 2004;38(16) 2737-2748.
- Valsson S., Bharat A. Urban heat island: Cause for microclimate variations. Architecture – Time Space & People.2009;20-25
- Chen X.L., Zhao H.M., Li P.X., Yin Z.Y. Remote sensing image-based analysis of the relationship between urban heat island and land use/cover changes. Remote Sensing of Environment. 2006; (104) 2:133-146.
- Hanapiah N. Urban heat island phenomenon in Penang Island, Malaysia. Journal of Advance Research in Applied Science. (ISSN 2208-2352). 2019; 6(7) 01-13. https://doi.org/10.53555/nnas.v6i7.764
- Bowler D.E., Buyung-Ali, L., Knight T.M., Pullin, A.S. Urban greening to cool towns and cities: A systematic review of the empirical evidence. Landscape and Urban Planning. 2010; 97:147–155.
- Alavipanah S., Wegmann M., Qureshi S., Weng Q., Koellner T. The role of vegetation in mitigating urban land surface temperatures: A case study of Munich, Germany during the warm season. Sustainability. 2015; 7:4689–4706.
- Amani-Beni M., Zhang B., Xie G., Shi Y. Impacts of urban green landscape patterns on land surface temperature: evidence from the adjacent area of Olympic forest park of Beijing, China. Sustainability, 2019; 11(2) 513. https://doi.org/10.3390/su11020513
- Yokobori T., Ohta S. Effect of land cover on air temperatures involved in the development of an intra-urban heat island. Climate Research. 2009; 39: 61–73
- Yan H., Fan S., Guo C., Wu F., Zhang N., Dong L. Accessing the effects of landscape design parameters on intra-urban air temperature variability: The case of Beijing, China. Build. Environ. 2014; (76) 44–53.
- Pang B., Zhao J., Zhang J., & Li Y. How to plan urban green space in cold regions of china to achieve the best cooling efficiency. Urban Ecosystems. 2022;25(4) 1181-1198. https://doi.org/10.1007/s11252-022-01202-1
- Kong F., Yin H., Wang C., Cavan G., & James P. A satellite image-based analysis of factors contributing to the green-space cool island intensity on a city scale. Urban Forestry & Urban Greening. 2014; 13(4) 846-853. https://doi.org/10.1016/j.ufug.2014.09.009
- Zhang Y., Jiang P., Zhang H., & Cheng P. Study on urban heat island intensity level identification based on an improved restricted Boltzmann machine. International Journal of Environmental Research and Public Health. 2018;15(2) 186. https://doi.org/10.3390/ijerph15020186
- Gianfredi V., Buffoli M., Rebecchi A., Croci R., Oradini?Alacreu A., Stirparo G., … & Signorelli C. Association between urban greenspace and health: A Systematic Review of the literature. International Journal of Environmental Research and Public Health. 2021; 18(10) 5137. https://doi.org/10.3390/ijerph18105137
- Doick K.J., Peace A., Hutchings T.R. The role of one large green space in mitigating London’s nocturnal urban heat island. Sci. Total Environ. 2014; 493: 662–671.
- Hamada S., Ohta T. Seasonal variations in the cooling effect of urban green area on surrounding urban areas. Urban For. Urban Green. 2010; 9:15–24
- Wu S., ???, ?., Webster, C., Xu, B., & Gong, P. Improved Equality of Human Exposure to Greenspace in the 21st Century Urbanization, 2023; https://doi.org/10.21203/rs.3.rs-2638867/v1
- Li H., Meier F., Lee X., Chakraborty T., Liu J., Schaap M., Sodoudi S. Interaction between urban heat island and urban pollution island during summer in Berlin. Sci. Total Environ. 2018; 636:818–828.
- Price A., Jones E., & Jefferson F. Vertical greenery systems as a strategy in urban heat island mitigation. Water Air & Soil Pollution. 2015;226(8). https://doi.org/10.1007/s11270-015-2464-9
- Le M., Cao T., & Tran N. The role of green space in the urbanization of Hanoi city. E3s Web of Conferences, 2019; 97, 01013. https://doi.org/10.1051/e3sconf/20199701013
- Hamel S., Garel M., Festa-Bianchet M., Gaillard J., & Côté S. Spring normalized difference vegetation index (NDVI) predicts annual variation in the Timing of peak faecal crude protein in mountain ungulates. Journal of Applied Ecology. 2009; 46(3) 582-589. https://doi.org/10.1111/j.1365-2664.2009.01643.x
- Kern A., Marjanovi? H., & Barcza Z. Evaluation of the quality of NDVI 3g dataset against collection 6 MODIS NDVI in Central Europe between 2000 and 2013. Remote Sensing, 2016; 8(11) 955. https://doi.org/10.3390/rs8110955
- Zhou D., Xiao J., Bonafoni S., Berger C., Deilami K., Zhou, Y., & Sobrino J. Satellite remote sensing of surface urban heat islands: progress, challenges, and perspectives. Remote Sensing. 2018;11(1) 48. https://doi.org/10.3390/rs11010048
- Li Z. Analysis of urban heat island effect based on remote sensing monitoring of ground objects changed. https://doi.org/10.1117/12.3020962, 2023;
- Ryan S. Advancing understanding on greenspace and mental health in young people. Geohealth. 2024; 8(3). https://doi.org/10.1029/2023gh000959
- Cao S., Yin W., Su J., Chen F., Du Y., Jun Z.,& Li Y. Spatial and temporal evolution of multi-scale green space environments and urban heat islands: a case study of Beijing sub-center. Sensors and Materials. 2023; 35(2) 589. https://doi.org/10.18494/sam4189
- Hong, T. Exploring the spatiotemporal relationship between green infrastructure and urban heat island under multi?source remote sensing imagery: a case study of Fuzhou city. CAAI Transactions on Intelligence Technology. 2023; 8(4) 1337-1349. https://doi.org/10.1049/cit2.12272
- Reed B., Brown J., VanderZee D., Loveland T., Merchant J., & Ohlen D. Measuring phenological variability from satellite imagery. Journal of Vegetation Science. 1994;5(5) 703-714. https://doi.org/10.2307/3235884
- Huang X., Zhang T., Yi G., He D., Zhou X., Li J., & Miao J. Dynamic changes of NDVI in the growing season of the Tibetan plateau during the past 17 years and its response to climate change. International Journal of Environmental Research and Public Health. 2019;16(18) 3452. https://doi.org/10.3390/ijerph16183452
- Chang Y.J., Xiao X., Li D., Zhou Y. Wu. Combining GOES-R and ECOSTRESS land surface temperature data to investigate diurnal variations of surface urban heat island., Science of The Total Environment.2022;823, Article 153652, https://doi.org/10.1016/j.scitotenv.2022.153652
- Piao S., Wang X., Ciais P., Zhu B., Wang T., & Liu J. Changes in satellite?derived vegetation growth trend in temperate and boreal Eurasia from 1982 to 2006. Global Change Biology.2011;17(10) 3228-3239. https://doi.org/10.1111/j.1365-2486.2011.02419.x
- Mao D., Wang Z., Liu L., & Ren C. Integrating AVHRR and MODIS data to monitor ndvi changes and their relationships with climatic parameters in northeast china. International Journal of Applied Earth Observation and Geoinformation. 2012; 18: 528-536. https://doi.org/10.1016/j.jag.2011.10.007
- Gupta, R. K. Geospatial and Statistical Analysis of Land Surface Temperature and Land Surface Characteristics of Jaipur and Ahmedabad Cities of India, Journal of Geoscience and Environment Protection, 2024;12,1-19. (Impact factor 0.72) https://doi.org/10.4236/gep.2024.128001
- Yang B., Chen S., Liu Q., Xiao Q., & Cao C. Land surface temperature and emissivity retrieval by integrating MODIS data onboard terra and aqua satellites. International Journal of Remote Sensing. 2011;32(5) 1449-1469. https://doi.org/10.1080/01431160903559754
- Phan T., Kappas M., & Degener J. Estimating daily maximum and minimum land air surface temperature using Modis land surface temperature data and ground truth data in Northern Vietnam. Remote Sensing, 2016; 8(12) 1002. https://doi.org/10.3390/rs8121002


