Biodecolorization of Azo Dye by Bacteria Alcaligenes faecalis sub sp. phenolicus Isolated from a Bark-beetle Tunnel Developed in Peltophorum pterocarpum Plant
Kusumlata
 , Rajat Pratap Singh
and Ashish Kumar
*
, Rajat Pratap Singh
and Ashish Kumar
*
1
Department of Biotechnology,
Guru Ghasidas Vishwavidyalaya (A Central University),
Bilaspur,
Chhattisgarh
India
http://dx.doi.org/10.12944/CWE.19.2.25
Copy the following to cite this article:
Kusumlata K, Singh R. P, Kumar A. Biodecolorization of Azo Dye by Bacteria Alcaligenes faecalis sub sp. phenolicus Isolated from a Bark-beetle Tunnel Developed in Peltophorum pterocarpum Plant. Curr World Environ 2024;19(2). DOI:http://dx.doi.org/10.12944/CWE.19.2.25
Copy the following to cite this URL:
Kusumlata K, Singh R. P, Kumar A. Biodecolorization of Azo Dye by Bacteria Alcaligenes faecalis sub sp. phenolicus Isolated from a Bark-beetle Tunnel Developed in Peltophorum pterocarpum Plant. Curr World Environ 2024;19(2).
Download article (pdf)
Citation Manager
Publish History

Introduction
Globally, there are more than 10,000 commercially available dyes, and each year, more than 0.7 million tons of dyes, including acidic, basic, reactive, and diazoic dyes, are manufactured. There has been a greater growth of industrial dyes due to the widespread use of chemically synthesized dyes in pulp, dyeing, textiles, paper, and other sectors. The most dangerous chemical types are dyes, mostly found in industrial wastewater2. Every year, improper dyeing techniques result in the loss of approximately 200,000 tonnes of unbound azo dyes throughout the processes of dying and finishing in the effluents. Around 15% of dye-containing effluent discharges untreated throughout the world into the environment3.
The textile sector uses the majority of azo dyes because they are versatile. Resistance to disintegration and degradation, as well as biological and photocatalytic stability, are the advantages of this dye. Aromatic amines, byproducts of the biodegradation of azo dyes, are produced during azo bond (-N=N-) cleavage and are frequently linked to carcinogenicity, genotoxicity, and chronic and acute biotoxicity4. They include single or several azo groups, which can resist degradation and build up at large concentrations with a substantial amount of persistence in the environment5. As azo dyes are xenobiotics, they are regarded as the main environmental contaminants6. Among the most common and widely used azo dyes that are difficult to remove are reactive dyes3. The transparency of dye-laden wastewater can cause acute and long-term toxicity, which also prevents aquatic plants and fauna from undergoing photosynthesis and reduces their oxygen in take3. These discharged dyes negatively affect aesthetic qualities, decrease dissolved oxygen, and disrupt aquatic ecosystems by blocking sunlight7. Furthermore, many aromatic amines and azo dyes are poisonous and carcinogenic, affecting aquatic organisms and human health via the food chain. Efficiently degrading azo dyes from dye-containing effluent has thus become an urgent challenge8. Due to the carcinogenic nature of textile dyes and their by-products, their removal is needed for the treatment of wastewater2.
The options for treatment for azo dye include physical, chemical, and biological degradation. However, because of their complete degradation, economic efficiency, and sustainability, biological approaches are the most often used7,9. Enzymatic approaches, phytoremediation, fungal decolorization, and bacterial decolorization are examples of biological techniques. The dye breaks down into many small compounds by microorganisms, which then disperse into water, carbon dioxide, and occasionally inorganic chemicals10. In recent years, Klebsiella sp. Y3 has been shown to decolorize various azo dyes6. Microbes of the genera Rhizobium, Azospirillum, and Pseudomonas are capable of degrading difficult chemical substances. They also function as PGPR (plant growth-promoting rhizobacteria), producing phytohormones and hydrogen cyanide (HCN).
The enzymatic phase, which consists of cleaving azo links with the help of an azoreductase and a donor of electrons, typically starts the degradation of the azo dye by bacteria. The resulting compounds, like some aromatic amines, can be broken down by the bacteria's oxygenase and hydroxylase11. It has been reported that several PGPRs not only encourage the growth of plants but also improve their environment through the removal of different pollutants. Compared to chemical and physical methods, microbial biodegradation is an effective, eco-friendly, and cost-effective approach. The advantages of rapid multiplication and degradation, demonstrated by bacteria such as Acinetobacter baumannii (which degrades Reactive Red 198), Bacillus fermus (which degrades Direct Blue 14), and Dermacoccus abyssi (which degrades Brilliant Black BN and Brilliant Crocein MOO), have drawn particular attention to bacterial degradation of textile dyes12.
Materials and Methods
Sample collection, dyes, and chemicals
The tunnel developed by the bark borer insect (Indarbela tetraonis) in the trunk of the Peltophorum pterocarpum plant was used as a sample for the isolation of microorganisms for the decolorization and degradation of reactive red 120 (RR120) dyes. The samples were collected in a sterile zigzag polybag. The geographical coordinates for the sampling site were latitude (22.12821°) and longitude (82.13816°). RR120, phenol red, acid blue 113, Congo red, and Orange II, dyes were purchased from Sigma Aldrich. Bushnell Hass broth medium (BHM) was prepared as follows: (g/L-1) FeCl3 0.05, CaCl2 0.02, MgSO4 0.2, and NH4NO3 1.0, K2HPO4 1.0, supplemented with glucose (0.4% w/v), 1% RR120 dye and yeast extract (0.2% w/v) media pH 7.013.
Isolation, screening, and characterization of RR120 dye-degrading bacteria
A total of 3 (WR-1, WR-2, and WR-3) bacteria that break down reactive red 120 dyes were isolated from the bark borer tunnel (Figure 1A). A 100 ml flask containing 40 ml of BHM broth medium with 100 mg/L RR 120 dye, was filled with 5 g of the sample. The flask was then shaken at 120 rpm for 3 days at 35°C. Static anaerobic environments were maintained for three days at 35°C after 3 g of sample was added to 30 ml of BHM broth medium. Additionally, the decolorized samples (Figure 1b) were serially diluted, and plating was performed using dilutions of 10–6 and 10–7 on BHM agar supplemented with 100 mg/L Reactive Red 120. The isolated bacterial cultures were screened based on the percentage of decolorization. All isolated cultures were screened based on degradation efficiency, for which WR-2 was selected (Table 1). By staining and biochemical tests, the culture and colony morphology of the WR-2 isolates were identified. The genomic DNA of the positively isolated WR-2 was extracted for molecular characterization, and the 16F27 (5'-CCA GAG TTT GAT CMT GGC TCA G-3') and 16R1492 (5'-TAC GGY TAC CTT GTT ACG ACT T-3') universal primers were utilized for analyzing the 16S rRNA gene nucleotide sequence. An automated DNA sequence (ABI3730XL) was used to sequence the products. The EzBioCloud database was used for identification after the Lasergene package was used for assembly.
Table 1: Decolorization percentage of dye RR120 by the isolated bacterial cultures
No. | Bacterial isolates | Decolorization percentage | ||
24 Hours | 48 Hours | 72 Hours | ||
1. | WR-1 | 93.66±4.27 | 96.14±1.06 | 95.29±1.64 |
2. | WR-2 | 97.80±0.94 | 97.81±1.38 | 96.96±1.13 |
3. | WR-3 | 17.87±1.77 | 35.49±3.39 | 54.17±1.33 |
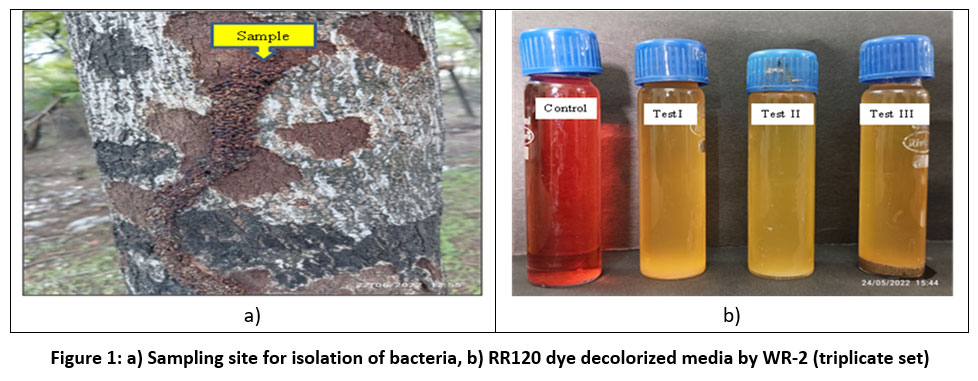 | Figure 1: a) Sampling site for isolation of bacteria, b) RR120 dye decolorized media by WR-2 (triplicate set)
|
Decolorization studies
BHM-containing media was added as a supplement. A screw cap tube containing 30 ml of BHM supplemented with 1 ml culture solution of bacteria grown throughout the night was added for inoculation. Medium without dye solution was used as the blank, and the dye-containing uninoculated media was used as the control. For 48–72 hours, at 37°C, the tubes were incubated. At 12-hour intervals during the incubation period, 5 ml of culture media was removed, and the bacterial cell mass was separatedafter centrifugation of mixture at 10,000 rpm for 10 minutes at 4°C. The absorbance of the culture supernatants at the RR120 dye maximum absorption wavelength (524 nm) was measured using UV-Vis spectroscopy to assess the decolorization potential. The formula was used to determine the percentage of decolorization, which was used to express the decolorizing efficiency14.
Microbial inoculums preparation
BHM broth was used to cultivate the isolates. Following the inoculation, the 30 ml screw-cap tubeswere placed at 35 °C in a static incubator until they reached their log phase, at which point they were used as inoculums (1.5×10⁸ cells/ml).
Effect of aeration, inoculum concentration, and incubation time
The decolorization of RR120 was investigated in both static and continuously shaking environments. In 100 ml flasks, 30 ml of BHM with RR 120 dye (100 mg/L-1) was included for the decolorization study under continuous shaking conditions. Then inoculated with a bacterial strain and maintained at 35 °C for 12–72 hours while being shaken at 150 rpm. In 30 ml screw-capped tubes, the inoculation medium was taken out, and the plates were placed in an incubator under static conditions for 12–72 hours at 35°C. Decolorization was studied at different incubation times (12 to 72 hours). The experiments were carried out with the previously described inoculation mixture in a static culture environment. The effect of different inoculum concentrations on decolorization was assessed at different concentrations (0.3–3 ml) of BHM. The BHM was then incubated under ideal static culture conditions for 12 hours14.
Taguchi Experimental Design
The 5 variables pH range 4-8, temperature 25°C- 45°C at 5°C intervals, 0.1, 0.2, 0.3, 0.4, and 0.5 mg/L RR120 dye Con; starch, lactose, sucrose, glucose, and fructose carbon sources (0.4% w/v); urea, ammonium sulfate, peptone, ammonium nitrate, and yeast nitrogen sources (0.2% w/v) were mutually exclusive and were used in the Taguchi design of the experiments. RR120 dye (100 mg/L-1) was added to the BHM media. A suitable range of parameter alterations is included due to the selection of the 5 parameter levels. Tests were set up using the L25 orthogonal array of TOM after the parameters that were effective at 5 different levels were selected. As previously mentioned, performing a large number of experiments is necessary for the full factorial design. When more factors are involved, the process becomes more complicated andlengthy. Taguchi recommended an orthogonal array technique, a particularly constructed method that reduces the number of tests needed to observe the full parameter space, as a solution to this problem. Thus, Taguchi suggested measuring performance traits that vary from the desired desired outcome using the loss function. The signal-to-noise (S/N) ratio is then obtained from the outcome of this loss function. To analyze the S/N ratio,three performance category parameters are usually used. The three categories are smaller-the-better, larger-the-better, and nominal-the-best15.
Immobilization of Alcaligenes faecalis subsp. phenolicus
A. faecalis subsp. phenolicus was cultured in LB media for 24 h at 35 °C and pH 7 before being immobilized. The cell pellets were extracted by centrifuging them for 10 minutes at 4°C at 5000 rpm. They were then washed with phosphate buffer solution (50 mM, pH 7.0) and suspended. The obtained cell suspension was mixed with sodium alginate (3%, w/v) and PVA (5%, w/v) in an even mixture. Using a syringe, the mixture was dripped dropwise into CaCl2 (3%, w/v). As soon as SV-PVA cells were dripped into CaCl2 (3%, w/v), beads (0.5 mm, 10 beads) were formed, which were kept in a shaker for 30 minutes. After restoring the cells for 48 hours in heterotrophic media, the produced beads were sterilized with distilled water and then kept in a CaCl2 (3%, w/v) solution at 4oC for further use. Bacteria-free beads were made for the control experiments16, 17.
Batch-continuous decolorization
The studies were carried out in 30 ml screw-cap tubes that had 30 ml of RR120 dye, which included A. faecalis subsp. phenolicus immobilized 10 beads (0.5 mm size) and BHM broth medium. Batch decolorization tests were performed under static anaerobic conditions, 100 mg l-1 dye with pH 7 and 35°C temperature . to evaluate the impact of operating and environmental factors on the efficiency of dye removal18. After 12 hours, the beads were transferred to a fresh medium so that nutrients continued to be provided, and batch decolorization of the dye continued to be performed.
Evaluation of azo dye and azo dye mixture decolorization by A. faecalis subsp. phenolicus
The A. faecalis subsp. phenolicus strain was used for this purpose, and each strain was inoculated individually in BHM broth medium before being incubated at 35-37°C. A. faecalis strains were utilized in studies to lessen azo dyes and mixed dyes (100 mg/l) from BHM media. Additionally, the percentage of dye decolorization at different incubation times was measured for the medium. Using a UV- 1900 UV?Vis spectrophotometer, the absorbance of the culture supernatants was measured at the maximum absorption wavelength of the azo dye mixture (525.6 nm), RR120 (524 nm), congo red (500 nm), phenol red (550 nm), orange II (484 nm) and acid blue 113 (570 nm)19.
Fabric decolorization
Fabric purchased from the local market in Bilaspur, Chhattisgarh, consisted of two sets of 100% cotton fabric (red and blue) cut into small, uniform pieces. The cloth pieces were properly packaged and autoclave-sterilized. The aseptic conditions of sterilized BHM broth media (30 ml) were used to separate tubes containing pieces of red and blue sterilized cloth. An overall quantity of 0.3 milliliters of inoculum was transferred to the test sample tubes, while the control medium remained uncultured. Anaerobic conditions were maintained for 2 days while all tubes were cultured at 35–37 °C20.
Impact of heavy metals on the RR120 decolorizing potential of A. faecalis subsp. phenolicus
Cu, Pd, Zn, Ni, and Cd metal ions were used in a study to determine the efficacy of heavy metal tolerance. Separate additions of the heavy metals ranging from 1 to 6 mg/l were made to the dye decolorization reaction mixtures to examine the impact of ions from heavy metals on the biodegradation ability of Reactive Red 120. Additionally, all experiment was run in triplicate, and the previously indicated parameters were used when determining the decolorization rate. The dye decolorization rate measured in the lack of a bacterial strain was used as a control21,22.
Enzyme assay
A. faecalis subsp. phenolicus strain was grown on LB broth media. For 24 hours, the culture tubes were incubated at 35 °C. After that, they were harvested by centrifuging the cells for 15 minutes at 4°C and 10000 rpm and then suspending them in pH 7.4 50 mM phosphate buffer. After centrifugation of homogenate for 15 minutes at 10,000 rpm, the supernatant was used as a source of crude enzymes23. Biotic and abiotic cultures were used as native and positive controls, respectively 24. The presence of tyrosinase, laccase, and manganese peroxidase in the cell-free extract was tested. 0.01% guaiacol in a 2 ml reaction mixture sample was mixed with 0.1 M phosphate buffer (pH 7.4) for laccase screening. Reactions between the released laccases and guaiacol resulted in a reddish-brown colour25. The color change in the tubes containing 0.5 ml of thereaction solution with 0.5 ml of sodium tartrate buffer, 0.5 ml of guaiacol, and 10 mM H2O2 indicated the presence of manganese peroxidase. When the two substances and secreted manganese peroxidase react, a brownish-red color appears. The activity of tyrosinase was measured in a pH 7.4 0.1 M phosphate buffer with 2 ml of a reaction mixture containing 0.01% catechol. All enzyme screenings were performed at 30°C using reference blanks that lacked any component other than the enzyme. The enzyme screening test was carried out three times 26.
EPS-producing strain study
To create the EPS, the strain was introduced into a commercial MRS medium at 37°C for 48 hours. After adding twice as much chilled ethanol and centrifuging it for 24 to 48 hours while it was chilled at 4°C, the precipitates were obtained27, 28.
PGPR-producing strain study
NH3 and indole acetic acid (IAA) production conformation tests have been studied as PGPR trait indices. The IAA generation of the bacterial strains was determined using the Gordon and Weber (1951) method29. The IAA precursor L tryptophan was added to the LB broth and the A. faecalis sub sp. phenolicus strain was then added. IAA content and supernatant were measured after 48 hours of incubation. 1 ml of Salkowski reagent was introduced into the supernatants, which were then left at room temperature for 30 minutes to quantify IAA. The intensity of the generated pink color was checked30. Rhizobacteria isolated from A. faecalis subsp. phenolicus were evaluated for the production of hydrogen cyanide (HCN)
The culture was grown on Kings medium broth supplemented with 4.4 g/L glycine, further, the culture tubes were incubated at 35°C for four days. The formation of HCN is indicated through the development of an orange or red color. Peptone broth medium was prepared for NH3 production. To produce ammonia, this strain of rhizobacterium was cultivated in peptone broth and incubated for 48 to 72 hours at 35°C. After adding 0.5 mL of Nessler's reagent to the bacterial suspension following incubation. A color change from brown to yellow signifies the generation of ammonia31.
Decolorization and degradation analysis
FTIR, GCMS, and UV-visible spectroscopy studies were conducted on the Reactive Red 120 azo dye model to confirm the decolorization and degradation of the A. faecalis subsp. phenolicus strain. Bacterial strains were cultured in BHM growth media supplemented with 50 mg/L RR120 dye for 12 hours at 35–37 °C. Control and test samples were analyzed following centrifuge at 10,000 × g for 10 minutes at 4°C to study the UV?Vis, GC?MS, and FTIR results. According to Agrawal et al, the peak variations within the treated and control dyes were measured utilizing a UV-Vis spectrophotometer32. Based on earlier research, the decolorized broth was extracted two times with ethyl acetate in double quantities. To examine the composition alterations within the molecules of the dye found in the effluents when the dye biodegradation procedure, 16-scan speed FTIR dye and extracted metabolite spectra in the 400–4000 cm–1 mid-IR range were obtained. After diluting the sample residue with 1 ml of HPLC-grade methanol, GC-MS evaluation was performed immediately. Under oven conditions, the injector temperature in the GC was maintained at 300°C with split-way oven temperature and hold time (80°C-2min, 100°C-2min, 210°C-5min, 230°C-4min, 250°C-2min, 300°C-10min). A solvent delay of 3 minutes was selected, and helium was utilized as the carrier gas. The MS was run in total ion current (TIC) mode, scanning at 70 electron volts (eV) between 50 and 450 m/z. By comparing the mass spectra in the NIST library database, the dye decolorization metabolites were identified33.
Results
Identification of selected isolate
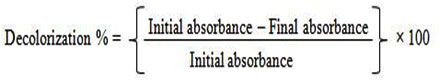
The Bark borer, Indarbela tetraonis, of the Guru Ghasidas Vishwavidyalaya Bilaspur, campus contained the bacterial strain WR-2, which significantly degraded RR120 dye after 12 h. According to the result of the biochemical test of selected WR-2 strains, catalase, methyl red, citrate utilization, and mobility tests were found positive, and urease, indole, starch and gelatin hydrolysis, mannitol salt agar, phenylalanine deamination, gas, and H2S production test were found negative. The 16s RNA sequencing results showed that strain WR-2 was linked closely to Alcaligenes faecalis sub sp. phenolicus DSM 16503(T) accession number AUBT01000026 at 98.84%. The 16S rRNA gene sequences of the WR-2 strain from the NCBI and Mega 11 databases were used to construct a phylogenetic tree (Figure 2). The sequence has been uploaded to Gen Bank (MTCC) with accession number 13437.
 | Figure 2: Phylogenetic tree of A. faecalis subsp. Phenolicus with different bacterial species
|
Optimization of the impact of agitation Shaking and Static, time, and inoculum size in RR120 decolorization
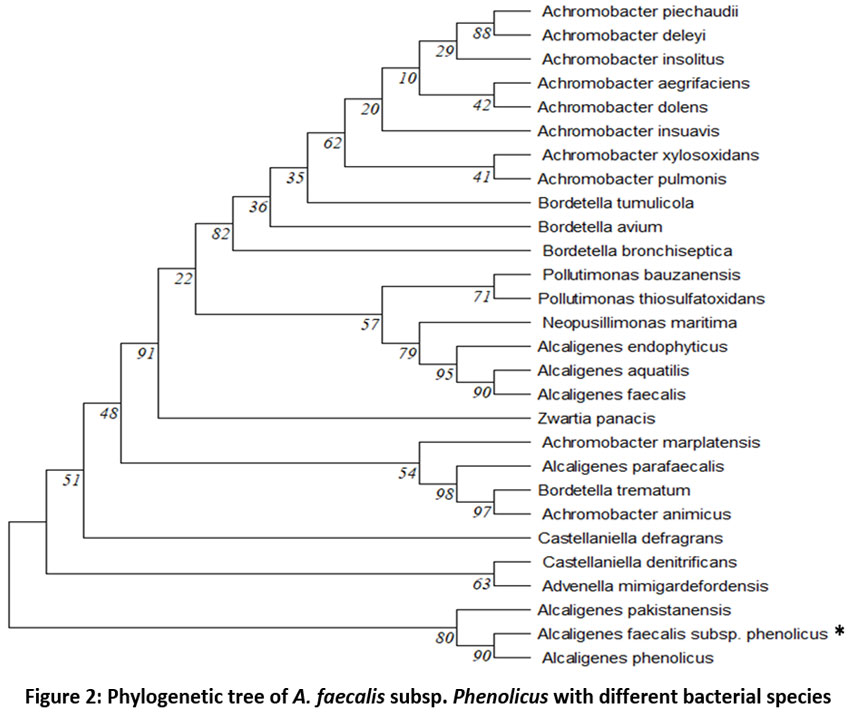
Shaking and Static conditions for cell growth are shown in Figure 3a. At the cell growth stage, oxygen has an important effect on physiological properties. Oxygen can either promote or prevent azo dyes from being broken and degraded by microbes. Under static conditions, the A. faecalis subsp. phenolicus strain decolored RR120 96%; however, under shaking conditions, only 32.47% decolorization was observed (Figure 3b). Under anaerobic and static conditions, A. faecalis subsp. phenolicus could completely decolorize RR 120 (100 mg/l) after 12 hours of incubation (Figure 3b). A. faecalis subsp. phenolicus was shown to decolorize RR120 dye in 0.3–3 ml of inoculums (Figure 3c). The decolorization rate increased significantly with a subsequent increase in inoculum size above the optimal value.
 | Figure 3: Impact of a) growth, b) static and shaking conditions; c) inoculum size on RR120 decolorization by A. faecalis subsp. phenolicus
|
Taguchi analysis
The use of statistical systems for support, such as the Taguchi design, has resulted from the parametric understanding of RR120 biodegradation by the A. faecalis subsp. phenolicus strain and an attempt to quantify the effect of individual parameters on the notable degradation of RR120. This experimental design aimed to determine the optimal parameters for RR120 degradation and a high degradation percentage in a short time. The S/N ratio is used by the Taguchi method to measure the level that deviates from the intended value. The S/N ratios differ based on the type of characteristic. The L25 array type of TOM was used in this work to assess five-level process parameters: temperature, carbon, nitrogen source, pH, and dye concentration. The significance of the process parameters' impact on one another increases. The collected observations were entered into the Taguchi Minitab software 19 after the tests recommended by the L25 orthogonal array were completed in triplicate under the different situations stated in the orthogonal table (Table 2), and the necessary decolorization percentage, S/N ratio and means (Table 3) were calculated. A higher S/N ratio should be taken into consideration when calculating the degradation percentage. The software used a statistical approximation using the mean of the S/N ratio (a higher ratio indicates better performance) to identify and introduce the ideal conditions for each physical and chemical factor (pH, initial dye concentration, carbon, nitrogen source, and temperature). When the experiment was performed in triplicate under optimal conditions, the final results were 99% accurate, according to the software34. The mean ratios are shown in Figure 4. The ideal dye concentration was 1 (0.1 mg), the initial pH was 2 (7), the temperature was 3 (35°C), the carbon source was 4 (fructose), and the nitrogen source was 5 (peptone). Ultimately, 99.66% dye removal can be obtained under these conditions18. The signal and noise in the Taguchi method signify the acceptable and undesirable values for the respective output characteristic. The Taguchi approach uses the S/N ratio to measure the quality feature that deviates from the ideal quantity. The S/N response graph for RR120 solution decolorization is displayed in Figure 4.
Table 2: L25 Orthogonal observation using the Taguchi method for RR120 dye degradation
Exp. | pH | Tem. | Carbon | Nitrogen | Dye conc. mg/L-1 | Decolorization % | SNRA1 | Mean1 |
L1 | 4 | 25 | Glucose | Yeast extract | 0.1 | 63.975 | -36.1202 | 63.975 |
L2 | 4 | 30 | Fructose | Peptone | 0.2 | 78.655 | -37.9145 | 78.655 |
L3 | 4 | 35 | Sucrose | Ammonium sulphate | 0.3 | 46.08 | -33.2702 | 46.08 |
L4 | 4 | 40 | Lactose | Ammonium nitrate | 0.4 | 44.185 | -32.9055 | 44.185 |
L5 | 4 | 45 | Starch | Urea | 0.5 | 29.71 | -29.4581 | 29.71 |
L6 | 5 | 25 | Fructose | Ammonium sulphate | 0.4 | 57.73 | -35.228 | 57.73 |
L7 | 5 | 30 | Sucrose | Ammonium nitrate | 0.5 | 25.11 | -27.9969 | 25.11 |
L8 | 5 | 35 | Lactose | Urea | 0.1 | 94.55 | -39.5132 | 94.55 |
L9 | 5 | 40 | Starch | Yeast extract | 0.2 | 39.965 | -32.0336 | 39.965 |
L10 | 5 | 45 | Glucose | Peptone | 0.3 | 64.875 | -36.2415 | 64.875 |
L11 | 6 | 25 | Sucrose | Urea | 0.2 | 69.75 | -36.8709 | 69.75 |
L12 | 6 | 30 | Lactose | Yeast extract | 0.3 | 59.86 | -35.5427 | 59.86 |
L13 | 6 | 35 | Starch | Peptone | 0.4 | 86.645 | -38.7549 | 86.645 |
L14 | 6 | 40 | Glucose | Ammonium Sulphate | 0.5 | 41.46 | -32.3526 | 41.46 |
L15 | 6 | 45 | Fructose | Ammonium nitrate | 0.1 | 92.845 | -39.3552 | 92.845 |
L16 | 7 | 25 | Lactose | Peptone | 0.5 | 75.845 | -37.5985 | 75.845 |
L17 | 7 | 30 | Starch | Ammonium sulphate | 0.1 | 90.27 | -39.1109 | 90.27 |
L18 | 7 | 35 | Glucose | Ammonium nitrate | 0.2 | 99.665 | -39.9709 | 99.665 |
L19 | 7 | 40 | Fructose | Urea | 0.3 | 95.455 | -39.596 | 95.455 |
L20 | 7 | 45 | Sucrose | Yeast extract | 0.4 | 95.24 | -39.5764 | 95.24 |
L21 | 8 | 25 | Starch | Ammonium nitrate | 0.3 | 78.06 | -37.8486 | 78.06 |
L22 | 8 | 30 | Glucose | Urea | 0.4 | 94.41 | -39.5004 | 94.41 |
L23 | 8 | 35 | Fructose | Yeast extract | 0.5 | 91.75 | -39.2521 | 91.75 |
L24 | 8 | 40 | Sucrose | Peptone | 0.1 | 94.18 | -39.4792 | 94.18 |
L25 | 8 | 45 | Lactose | Ammonium sulphate | 0.2 | 94.215 | -39.4824 | 94.215 |
Table 3: Response observation for means value and signal-to-noise ratio
Level | pH | Temperature | Carbon | Nitrogen | Dye conc. | |||||
Means | S/N | Means | S/N | Means | S/N | Means | S/N | Means | S/N | |
1 | 52.52 | -33.93 | 69.07 | -36.73 | 83.29 | -38.27 | 67.97 | -35.62 | 87.16 | -38.72 |
2 | 56.45 | -34.2 | 69.66 | -36.01 | 72.88 | -36.84 | 65.95 | -35.89 | 76.45 | -37.25 |
3 | 70.11 | -36.58 | 83.74 | -38.15 | 73.73 | -37.01 | 80.04 | -38 | 68.87 | -36.5 |
4 | 91.3 | -39.17 | 63.05 | -35.27 | 66.07 | -35.44 | 76.78 | -36.99 | 75.64 | -37.19 |
5 | 90.52 | -39.11 | 75.38 | -36.82 | 64.93 | -35.44 | 70.16 | -36.51 | 52.77 | -33.33 |
Delta | 38.77 | 5.24 | 20.69 | 2.88 | 18.36 | 2.83 | 14.09 | 2.38 | 34.39 | 5.38 |
Rank | 1 | 2 | 3 | 3 | 4 | 4 | 5 | 5 | 2 | 1 |
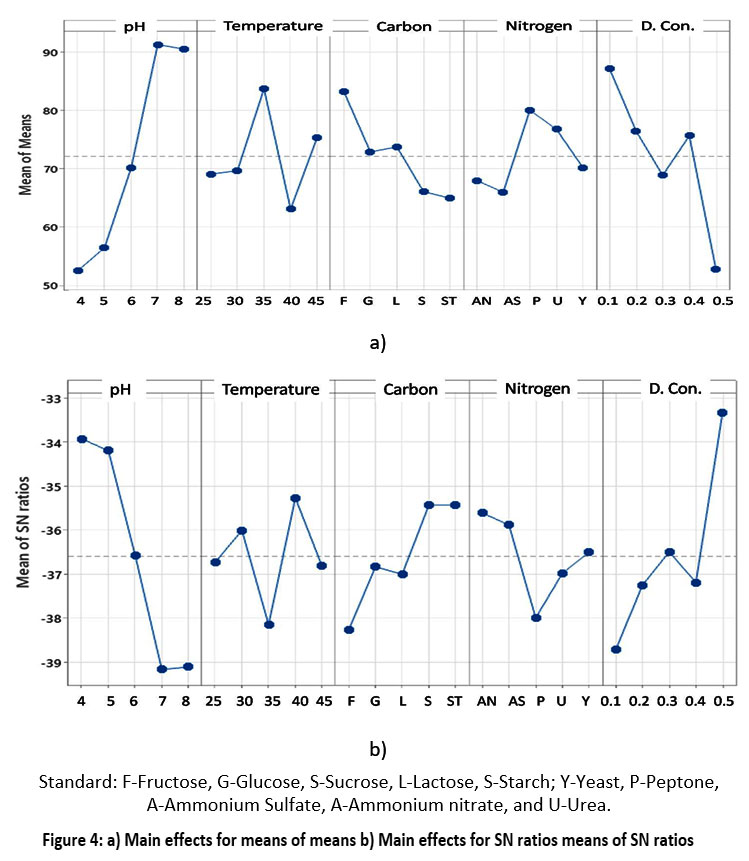 | Figure 4: a) Main effects for means of means b) Main effects for SN ratios means of SN ratios
|
Repeated-batch decolorization
Complete decolorization was observed using immobilized bacterial beads for up to 25 cycles in anaerobic environments. After 5 cycles, the rate of decolorization decreased significantly; however, with the bacterial beads immobilized in this study, more than 95% decolorization was still observed in subsequent cycles (Table 4). For RR120 decolorization, the immobilized bacteria-mediator beads demonstrated excellent reusability.
Table 4: Decolorization percent of RR120 by using immobilized beads
Cycle | Decolorization percent | |
Immobilized cell beads (Cell-SA-PVA) | Control (cell Free beads) (SA-PVA) | |
1 Cycles | 96.39±1.82 | 8.66±1.24 |
2 Cycles | 97.55±0.87 | 8.66±0.47 |
3 Cycles | 97.61±0.61 | 5.66±1.69 |
4 Cycles | 97.95±0.56 | 10±2.16 |
5 Cycles | 97.84±1.31 | 7.33±1.69 |
Decolorization of azo dye and dye mixtures
The bacterial strain was subsequently analyzed using a BHM medium supplemented with 300 mg/l concentrations of the corresponding dyes for the decolorization of AB 113, orange II, congo red, RR120, and phenol red individual dye and dye mixtures. For all dyes, there were differences in the rate of decolorization. It decolored 76.51% of AB 113, 96.8% of orange II, 98.47% of congo red, 98.3% of RR120, 97.92% of phenol red individual dyes, and 94.72% of the dye mixture at the 12-hour mark of the incubation period. It decolorized 99.1% of AB 113 after 24 hours of incubation. The nature and position of the substituent in aromatic rings, as well as the reaction between the azo link and various dyes, are the main factors influencing the variations in the dye decolorization pattern. These variations also affect structure, complexity, and specificity, according to reports.
Enzyme assay
The difference between the production of enzymes found in the control and the cells produced after decolorization is indicated by the results. It is likely that biotransformation enzymes, such as laccase and MnP, are primarily responsible for the decolorization of cells. For every microbe, there may be differences in the appropriate contributions of MnP and laccase to the decolorization of dyes. According to previous studies, a significant enhancement in the activity of these enzymes during decolorization suggests that these enzymes are involved in the dye breakdown process.
PGPR activity
The production of HCN, IAA, and NH3 was found to have good potential in the A. faecalis subsp. phenolicus strain. After 48 hours of incubation under static conditions, the cells were observed.
EPS production
The extracellular polysaccharide that was isolated for this investigation, however, is a white powder. The pale yellow color of the powder could have resulted from bacteria. No powder was obtained in the control tubes because of the EPS production capacity of the Alcaligenes faecalis subsp. phenolicus strain was compromised.
Fabric decolorization
The fabric was separated from each tube, then washed 3 times with phosphate buffer, and dried at room temperature. Comparative observation and Raman Microscopic (Figure 5 a) and b) were performed on the color of the control fabrics and bacteria-treated fabrics. Compared with that of the control, the color of the bacterial-treated fabric became colorless. The fabric decolorization test showed the capability of bacteria to remove dye from the colored fabric.
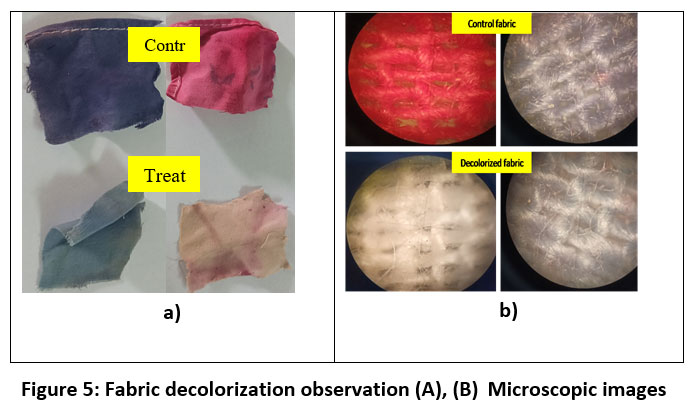 | Figure 5: Fabric decolorization observation (A), (B) Microscopic images
|
Metal tolerance activity
According to the amount of time needed for the RR120 azo dye to completely decolorize, the impacts of heavy metal ions on the strain's ability to decolorize dye were studied. Figure 6 shows the results obtained from experiments carried out with Cu, Pd, Zn, Ni, and Cd heavy metal ions present at various concentrations. The A. faecalis subsp. phenolicus strain required 12 hours to completely decolorize Reactive Red 120 when no heavy metal ions were present. Remarkably, in the presence of metal tolerance, the time needed for the rate of 100% decolorization was reduced by around 72 hours. When the amount of metal ions, viz. Zn, Cu, Pd, and Ni, increased from 2% to 6%, there was a minor decrease in the amount of 72 h needed for RR120 to decolorize 100% of the media sample. >72 h required for 100% dye decolorization at a concentration of 1-6% for the metal ion Ni. Textile effluents with heavy metal ions may have issues with low biodegradability, extending the time required for biological treatment.
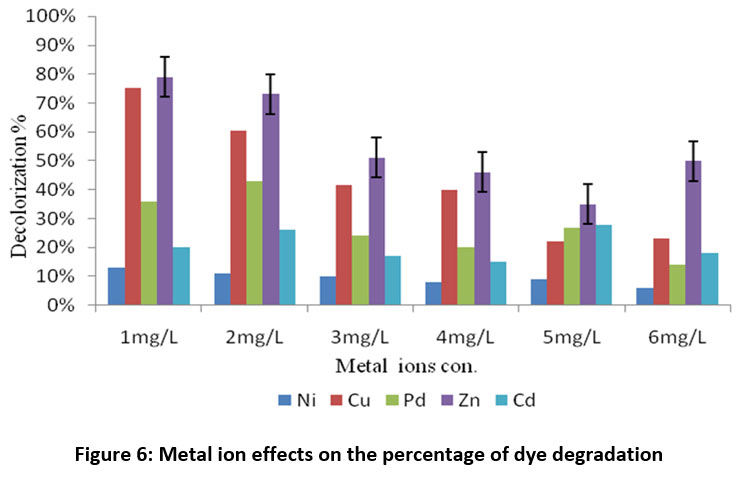 | Figure 6: Metal ion effects on the percentage of dye degradation.
|
UV, FTIR, GCMS analysis
The most common and basic technique for analyzing dye decolorization is UV-Vis spectroscopy. Figure 7 clearly shows how the decolorization of the RR120 azo dye results in the elimination of the sharp peak at the maximum wavelength of RR120 (?max 524 nm), showing that the dye within the medium was destroyed by the bacteria after a 12-hour incubation period. Additionally, FTIR is often used as a suitable technique to examine the degradation of dyes. FTIR is a useful analytical technique in dye degradation research because it can be used to determine the type and degree of interactions that take place inside azo dyes with many functional groups which are degraded by bacteria. Therefore, the biodegradation method was studied using the mid-IR 400–4000 cm-1 range of FT-IR spectroscopy in addition to the previously discussed analytical methods. After mixing the samples with spectroscopically pure KBr, the analyses were completed. The presence of the dye compound is indicated by a medium peak in the control RR120 dye spectrum that revealed an O-H stretch of the phenolic group at 1381.38 cm?1 and a C?=?N stretch of the amine at 1130.61 cm-1 and 1028.09 cm-1.When the FTIR spectrum of RR120 was compared to that of its degraded metabolites after 24 hours, it was evident that A. faecalis subsp. phenolicus biodegraded the dye. Additionally, the FTIR spectra of the extracted metabolites revealed a moderate peak at 3353.43 cm-1 corresponding to the formation of aliphatic primary amines through N–H stretching, with a strong peak at 1555.37 cm-1 corresponding to the N–O stretch and the formation of nitro compounds. Halo compound C-I stretching is indicated by the medium peak at 534.52 cm-1. The results are displayed in Figure 8A and B. In RR120 dye, ten peaks were found during GC-MS analysis. RR120 dye components were identified Dodecane, 2, 6, 11-trimethyl-$$ 2, 6, 11-Trimethyldodecan, Tetrapentacontane, Tetrapentacontane, Bis (2-ethylhexyl) phthalate $$ Phthalic acid, and Hexatriacontane $$ n-Hexatriacontane. The broken-down metabolites of Reactive Red 120 were identified by GC-MS analysis (Figure 9, Table 5) and organic solvent extraction as pentanoic as acid (molecular mass 116, m/z 116, retention time 3.297, area 24.38%), pentanoic acid (molecular mass 116, m/z 116, retention time 5.253, area 0.35%), 2-piperidinone (molecular mass 99, m/z 99, retention time 13.617, area 39.28%), methyl tetradecanoate (molecular mass 242, m/z 242, retention time 23.934, area 0.27%), 1,4-diazabicyclo[4.3.0]nonan-2,5-dione (molecular mass 168, m/z 168, retention time 24.307, area 3.35%), cyclo(L-prolyl-L-valine) (molecular mass 196, m/z 196, retention time 25.490, area 12.77%), cyclo(L-prolyl-L-valine) (molecular mass 196, m/z 196, retention time 25.981, area 1.94%), and pyrroline This set off a series of events that eventually produced a stable intermediate.
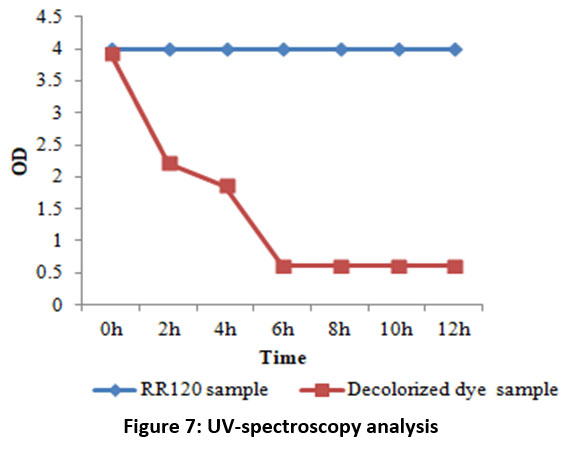 | Figure 7: UV-spectroscopy analysis
|
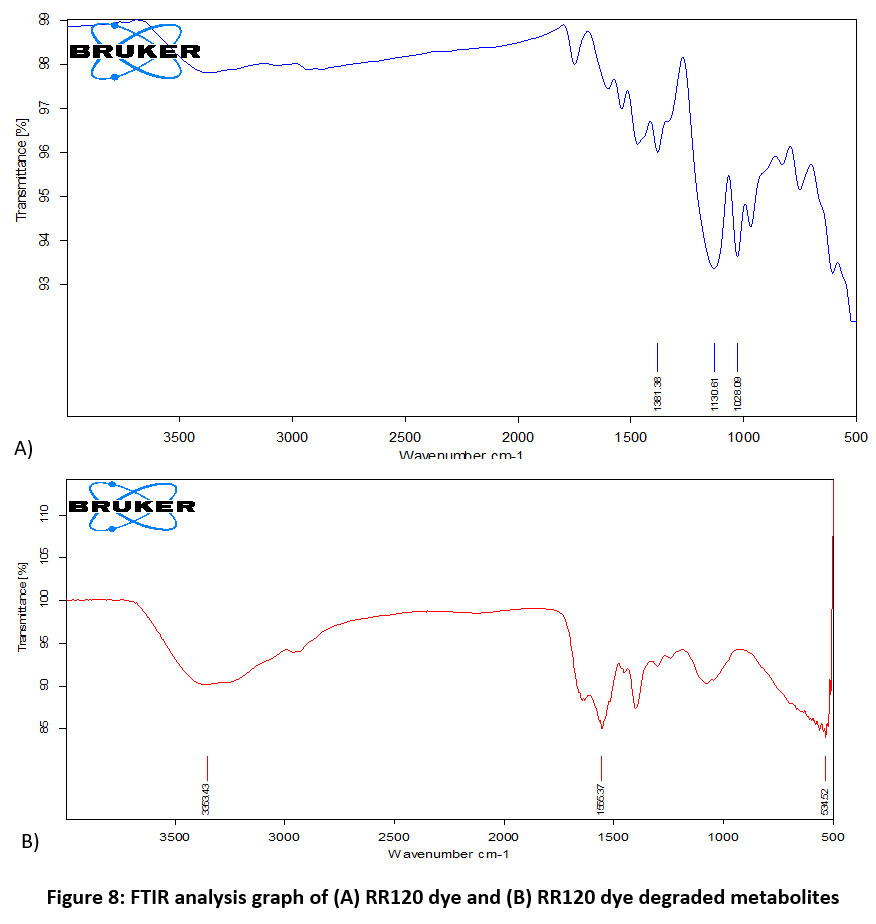 | Figure 8: FTIR analysis graph of (A) RR120 dye and (B) RR120 dye degraded metabolites
|
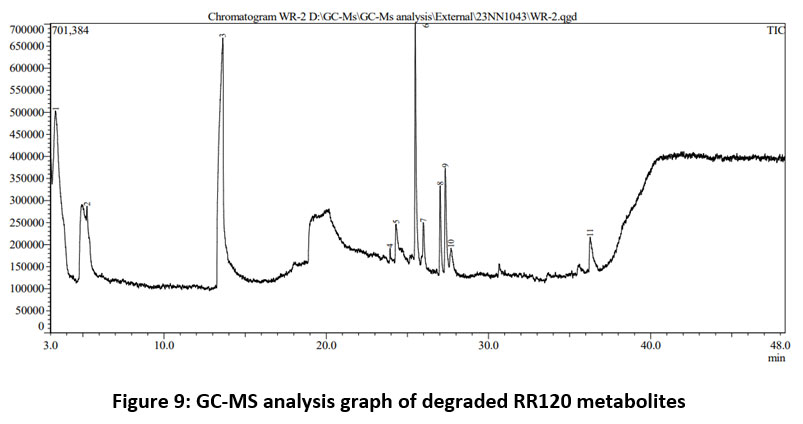 | Figure 9: GC-MS analysis graph of degraded RR120 metabolites
|
Table 5: GCMS identified compounds and degraded metabolites of RR120 dye
Compound | Molecular formula | R.Time (min.) | Molecular Weight (g/mol) | Peak Area % | Peak Height % |
Pentanoic acid | C6H12O2 | 3.315 | 116 | 12.18 | 8.08 |
Pentanoic acid | C6H12O2 | 5.304 | 116 | 0.68 | 1.62 |
2-Piperidinone | C5H9NO | 13.611 | 99 | 48.86 | 25.61 |
Methyl tetradecanoate | C15H30O2 | 23.920 | 242 | 0.83 | 3.38 |
1,4-diazabicyclo[4.3.0]nonan-2,5-dione | C8H12N2O2 | 24.286 | 168 | 2.47 | 3.84 |
Cyclo(L-prolyl-L-valine) | C10H16N2O2 | 25.492 | 196 | 12.63 | 22.97 |
Cyclo(L-prolyl-L-valine) | C10H16N2O2 | 25.985 | 196 | 2.01 | 4.25 |
Hexadecanoic acid | C17H34O2 | 26.804 | 270 | 0.42 | 1.54 |
Pyrrolo[1,2-a]pyrazine-1,4-dione | C11H18N2O2 | 27.028 | 210 | 4.22 | 7.88 |
Pyrrolo[1,2-a]pyrazine-1,4-dione | C11H18N2O2 | 27.342 | 210 | 7.13 | 11.05 |
Pyrrolo[1,2-a]pyrazine-1,4-dione | C11H18N2O2 | 27.691 | 210 | 1.63 | 2.15 |
Heptadecanoic acid | C19H38O2 | 30.504 | 298 | 0.24 | 0.87 |
1-Isobutylsulphanylmethyl-2,8,9-trioxa-5-aza-1-sila-bicyclo[3.3.3]undecane $$ Isobuty | C11H23NO3SSi | 30.670 | 277 | 0.88 | 1.77 |
Pyrrolo[1,2-a]pyrazine-1,4-dione | C14H16N2O2 | 36.248 | 244 | 5.55 | 4.43 |
Ethyl homovanillate | C14H22O4 | 47.211 | 282 | 0.27 | 0.58 |
Discussion
According to a study by Rehaman et al, 74% and 85% of the PGPR Azospirillum sp. and Pseudomonas sp. decolorized reactive blue dye at 37°C, respectively, within 20 days35. Maniyam et al noted that the decolorization effectiveness of the methyl red dye was greater in a static situation than under shaking conditions for two Rhodococcus strains UCC 0016 and UCC 000836. In this study, the PGPR A. faecalis sub sp. phenolicus was able to decolorize RR120 (0.1 mg/l), which reached 99% at pH 7, 35°C, 1% inoculum, and under static conditions within 12 h. Among the 8 azo dyes, namely, reactive blue R, Janus Green B, ponceau S, cibacron brilliant Red, Evans Blue, Alura Red AC, and brilliant green Bacillus subtilis was determined to be the most effective bacterium. The decolorization rate ranged between 71.8% and 100%37. A. faecalis subsp. phenolicus was able to degrade many azo dyes (76.51% of AB 113, 96.8% of orange II, 98.47% of congo red, 98.3% of RR120, and 97.92% of phenol red individual dyes and 94.72% of dye mixture), according to this work. According to the results, using a carbon source increased Enterococcus faecium's methyl orange decolorization by 100% and in Bacillus cereus by 75%38. According to this study, using a fructose and peptone carbon nitrogen source and 0.1% dye contraction increased the decolorization of RR120 by A. faecalis subsp. phenolicus 100%.To decolorize Congo red dye Goswami et al, combined ozonation with a packed bed bioreactor that contained biochar immobilized with Providencia stuartii39. As a pre-treatment, the biological method removed dye with an efficiency of 92%. The complete decolorization of RR120 by A. faecalis subsp. phenolicus-immobilized cells in a batch continuous reactor were used in this study. Bacillus megaterium KY848339.1 was capable of decolorizing the acid red 337 azo dye at an optimal pH 7 and 91% efficiency at a primary concentration of 500 mg/l in less than a day. Dye biodegradation is influenced by effluent pH. Bacillus sp. removes the azo dyes Navy blue and methyl red at different pH values (5–8)40. The degradation efficiency of Bacillus sp. strain CH12, when various carbon sources were added, was greater than that of the carbon-free culture (27–51%), with decreasing efficiency of 95% to 100%. In contrast to inorganic sources, which produced the maximum degradation efficiency, the inclusion of peptone and yeast extract as a source of nitrogen produced the highest degradation efficiency (>90%) in the same study41. Parma and Shukla investigated how various dye concentrations affected the way Staphylococcus hominis subsp. DSM 20328 degraded the C.I. Reactive Blue 4, an anthraquinone-based dye. They studied an increase in the dye's quantity followed by a reduction in the degradation efficiency of dyes42. Arsenic, nickel, copper, and zinc salts were tolerated by the moderately halotolerant strain of Klebsiella at concentrations of 1.25 mM, 1.5 mM, 3 mM, and 5 mM, respectively, because they degraded Congo red and Acid Orange 743. In this study, the A. faecalis subsp. phenolicus strain decolorized RR120 when heavy metals were present (1% Ni, Pd, Cu, Cd, and Zn).
Conclusion
Reactive red 120 dye was decoloured in simulated BHM using heavy metal-tolerant and EPS-producing A. faecalis subsp. phenolicus strains under various physicochemical and operational conditions. Comparing Taguchi's method of parameter design to full factorial analysis, the latter requires fewer experiments and obtains comparable results. The dye concentration, pH, carbon-nitrogen sources, and temperature all affected decolorization. A temperature of 35°C, pH of 7, dye concentration of 0.1 mg/l, carbon source of fructose, and nitrogen source of peptone, a duration of 12 hours, static conditions, and 0.3 ml of inoculums were the most suitable parameters for Reactive red 120 dye removal. The immobilized beads were found to be stable for 12 hours in repeated batch cultivation for RR120 degradation when A. faecalis subsp. phenolicus was used continuously for this purpose. The results of this investigation demonstrated the great decolorization efficiency of this A. faecalis subsp. phenolicus bacteria strain. This strain decolored 76.51% of AB 113, 96.8% of orange II, 98.47% of congo red, 98.3% of RR120, 97.92% of phenol red individual dyes, and 94.72% of the dye mixture at the 12-hour. Aliphatic primary amines, nitro compounds halo compounds were detected by FTIR analysis in the isolated metabolites that were produced during dye decolorization. GC-MS analysis was used to identify low molecular weight substances. The significant removal of the color rate of the strain of bacteria in natural environments suggests that it has the potential to be both economically and environmentally beneficial when used in the microbial treatment of dye-containing effluents.
Acknowledgment
The authors are thankful to the National Centre for Microbial Resource, Pune, Maharashtra, and the Central Instrumentation Lab, Central University of Punjab, Bhatinda, for GC-MS analysis.
Funding sources
The author(s) received no financial support for the research, authorship, and/or publication of this article
Conflict of interest
The authors do not have any conflict of interest.
Data Availability Statement
All dataset incorporated in the manuscript are produced by the authors
Ethics Statement
This research did not involve human participants, animal subjects, or any material that requires ethical approval
Authors Contribution Statement
Kusumlata; writing—original data preparation, Rajat Pratap Singh; review, Ashish Kumar; Data analysis, review, editing and visualization.
References
- Guembri M., Neifar M., Saidi M., Ferjani R., Chouchane H., Mosbah A., Ouzari H. I. Decolorization of textile azo dye Novacron Red using bacterial monoculture and consortium: Response surface methodology optimization. Water Environment Research 2021; 93(8): 1346–1360.
CrossRef - Mohamad Hanapi N. H., Sayid Abdullah S., Khairuddin Z., Mahmod N. H., Monajemi H., Ismail A., Juahir H. COD removal and color degradation of textile dye effluents by locally isolated microbes. International Journal of Environmental Analytical Chemistry 2022;102(19):7835–7850.
CrossRef - Sreedharan V., Saha P., Rao K.V.B. Dye degradation potential of Acinetobacter baumannii strain VITVB against commercial azo dyes. Bioremediation Journal 2021; 25(4): 347–368.
CrossRef - Florêncio T. D., de Godoi L. A., Rocha V. C., Oliveira J. M., Motteran F., Gavazza S., Vicentine K/F., Damianovic M. H. Anaerobic structured?bed reactor for azo dye decolorization in the presence of sulfate ions. Journal of Chemical Technology & Biotechnology 2021; 96(6): 1700-1708.
CrossRef - Lalnunhlimi S., Krishnaswamy V. Decolorization of azo dyes (Direct Blue 151 and Direct Red 31) by moderately alkaliphilic bacterial consortium. Brazilian journal of microbiology 2016; 47: 39-46.
CrossRef - Dixit S., Garg S. Enzymatic degradation of sulfonated azo dye using purified azoreductase from facultative Klebsiella pneumonia. Folia Microbiologica 2021; 66: 79–85.
CrossRef - Kusumlata, Ambade B., Kumar A., Gautam S. Sustainable Solutions: Reviewing the Future of Textile Dye Contaminant Removal with Emerging Biological Treatments. Limnological Review 2024; 24(2): 126-149.
CrossRef - Guo G., Liu C., Hao J., Tian F., Ding K., Zhang C., Guan Z. Development and characterization of a halo-thermophilic bacterial consortium for decolorization of azo dye. Chemosphere 2021; 272: 129916.
CrossRef - Chen G., An X., Li H., Lai F., Yuan E., Xia X., Zhang Q. Detoxification of azo dye Direct Black G by thermophilic Anoxybacillus sp. PDR2 and its application potential in bioremediation. Ecotoxicology and Environmental Safety 2021; 214:112084.
CrossRef - Carolin C. F., Kumar P. S., Joshiba G. J. Sustainable approach to decolorize methyl orange dye from aqueous solution using novel bacterial strain and its metabolites characterization. Clean Technologies and Environmental Policy 2021; 23: 173-181.
CrossRef - Tan L., He M., Song L., Fu X., Shi S. Aerobic decolorization, degradation and detoxification of azo dyes by a newly isolated salt-tolerant yeast Scheffersomyces spartinae TLHS-SF1. Bioresource Technology 2016; 203: 287-294.
CrossRef - Wang R., Yang Q., Shi Y., Zhang X., Li X., Chen Z., Zhang D. Degradation of brilliant crocein using the halotolerant bacterial consortium DAS. Biochemical Engineering Journal 2024;1 (206):109308.
CrossRef - Reddy S., Osborne J. W. Biodegradation and biosorption of Reactive Red 120 dye by immobilized Pseudomonas guariconensis: Kinetic and toxicity study. Water environment research 2020; 92(8): 1230-1241.
CrossRef - Singh R. P., Singh P. K., Singh R. L. Bacterial decolorization of textile azo dye acid orange by Staphylococcus hominis RMLRT03. Toxicology international 2014; 21(2): 160.
CrossRef - Athreya S., Venkatesh Y. D. Application of Taguchi method for optimization of process parameters in improving the surface roughness of lathe facing operation. International Refereed Journal of Engineering and Science 2012; 1(3): 13-19.
- Cheng Y., Lin H., Chen Z., Megharaj M., Naidu R. Biodegradation of crystal violet using Burkholderia vietnamiensis C09V immobilized on PVA–sodium alginate–kaolin gel beads. Ecotoxicology and environmental safety 2012; 83: 108-114.
CrossRef - Sharma S.C.D., Sun Q., Li J., Wang Y., Suanon F., Yang J., Yu C. P. Decolorization of azo dye methyl red by suspended and co-immobilized bacterial cells with mediators anthraquinone-2,6-disulphonate and Fe3O4 nanoparticles. International Biodeterioration & Biodegradation 2016; 112: 88-97.
CrossRef - Daneshvar N., Ayazloo M., Khataee A. R., Pourhassan M. Biological decolorization of dye solution containing Malachite Green by microalgae Cosmarium sp. Bioresource Technology 2007; 98(6): 1176-1182.
CrossRef - Thiruppathi K., Rangasamy K., Ramasamy M., Muthu D. Evaluation of textile dye degrading potential of ligninolytic bacterial consortia. Environmental Challenges 2021; 4: 100078.
CrossRef - Kaur J., Mudgal G., Negi A., Tamang J., Singh S., Singh G. B., Kesari K. K. Reactive black-5, Congo red and methyl orange: chemical degradation of azo-dyes by agrobacterium. Water 2023; 15(9): 1664.
CrossRef - Si J., Peng F., Cui B. Purification, biochemical characterization and dye decolorization capacity of an alkali-resistant and metal-tolerant laccase from Trametes pubescens. Bioresource Technology 2013; 128: 49-57.
CrossRef - Murugesan K., Kim Y. M., Jeon J. R., Chang Y. S. Effect of metal ions on reactive dye decolorization by laccase from Ganoderma lucidum. Journal of Hazardous Materials 2009; 168(1): 523-529.
CrossRef - Jadhav S. B., Phugare S. S., Patil P. S., Jadhav J. P. Biochemical degradation pathway of textile dye Remazol red and subsequent toxicological evaluation by cytotoxicity, genotoxicity, and oxidative stress studies. International Biodeterioration & Biodegradation 2011; 65(6): 733-743.
CrossRef - Shrestha P., Joshi B., Joshi J., Malla R., Sreerama L. Isolation and physicochemical characterization of laccase from Ganoderma lucidum-CDBT1 isolated from its native habitat in Nepal. BioMed Research International 2016; (1):3238909.
CrossRef - Mehandia S., Sharma S. C., Arya S. K. Isolation and characterization of an alkali and thermostable laccase from a novel Alcaligenes faecalis and its application in decolorization of synthetic dyes. Biotechnology Reports 2020; 25: e00413.
CrossRef - Kalyani D. C., Patil P. S., Jadhav J. P., Govindwar S. P. Biodegradation of reactive textile dye Red BLI by an isolated bacterium Pseudomonas sp. SUK1. Bioresource Technology 2008; 99(11): 4635-4641.
CrossRef - Agrawal S., Tipre D., Dave SR. Biotreatment of azo dye containing textile industry effluent by a developed bacterial consortium immobilized on brick pieces in an indigenously designed packed bed biofilm reactor. World Journal of Microbiology and Biotechnology 2023; 39(3):83.
CrossRef - Liu Z., Wang J., Zhang S., Hou Y., Wang J., Gao M., Li Z. Formation characteristics of algal-bacteria granular sludge under low-light environment: From sludge characteristics, extracellular polymeric substances to the microbial community. Bioresource Technology 2023; 376: 128851.
CrossRef - Gordon S. A., Weber R. P. Colorimetric estimation of indoleacetic acid. Plant physiology. 1951; 26(1):192.
CrossRef - Hussain S., Maqbool Z., Shahid M., Shahzad T., Muzammil S., Zubair M., Mahmood F. Simultaneous removal of reactive dyes and hexavalent chromium by a metal-tolerant Pseudomonas sp. WS-D/183 harboring plant growth-promoting traits. International journal of agriculture & biology 2020; 241-252.
CrossRef - Agbodjato N. A., Noumavo P. A., Baba-Moussa F., Salami H. A., Sina H., Sèzan A., Baba-Moussa L. Characterization of potential plant growth promoting rhizobacteria isolated from Maize (Zea mays L.) in central and Northern Benin (West Africa). Applied and Environmental Soil Science 2015;(1): 901656
CrossRef - Agrawal S., Tipre D., Patel B., Dave S. Optimization of triazo Acid Black 210 dye degradation by Providencia sp. SRS82 and elucidation of degradation pathway. Process Biochemistry 2014; 49(1):110–119.
CrossRef - Garg S. K., Tripathi M., Singh S. K., Tiwari J. K. Biodecolorization of textile dye effluent by Pseudomonas putida SKG-1 (MTCC 10510) under the conditions optimized for monoazo dye orange II color removal in the simulated minimal salt medium. International biodeterioration & biodegradation 2012; 74: 24-35.
CrossRef - Pourbabaee A. A., Ramezani S., Javaheri Daneshmand H. Biodegradation of malachite green by Klebsiella Terrigenaptcc 1650: the critical parameters were optimized using Taguchi optimization method. J. Bioremed. Biodeg. 2013; 4: 175.
- Rehaman S., Aravindan G., Karthick G. Spectral studies of Azo Dye degradation using selected Biofertilizer of Pseudomonas fluorescens. Int. J. Life Sci. Pharma Res. 2021; 11(1): L73-79.
- Maniyam M. N., Ibrahim A. L., Cass A. E. Decolorization and biodegradation of azo dye methyl red by Rhodococcus strain UCC 0016. Environmental Technology 2018;71-85.
CrossRef - Abd El-Rahim W.M., Moawad H., Azeiz A. Z., Sadowsky M.J. Biodegradation of azo dyes by bacterial or fungal consortium and identification of the biodegradation products. The Egyptian Journal of Aquatic Research 2021; 47(3):269–76.
CrossRef - Karnwal A. Textile azo dye decolorization and detoxification using bacteria isolated from textile effluents. BioTechnologia. Journal of Biotechnology Computational Biology and Bionanotechnology 2019; 100(4).
CrossRef - Goswami M., Chaturvedi P., Sonwani R. K., Gupta A. D., Singhania R. R., Giri B. S., Singh R. S. Application of Arjuna (Terminalia arjuna) seed biochar in hybrid treatment system for the bioremediation of Congo red dye. Bioresource Technology 2020; 307: 123203.
CrossRef - Moyo S., Makhanya B. P., Zwane P. E. Use of bacterial isolates in the treatment of textile dye wastewater: A review. Heliyon 2022; 8(6).
CrossRef - Guadie A., Tizazu S., Melese M., Guo W., Ngo H. H., Xia S. Biodecolorization of textile azo dye using Bacillus sp. strain CH12 isolated from the alkaline lake. Biotechnology Reports 2017; 15: 92–100.
CrossRef - Parmar N. D., Shukla S. R. Biodegradation of anthraquinone-based dye using an isolated strain Staphylococcus hominis subsp. hominis DSM 20328. Environmental Progress & Sustainable Energy 2018; 37(1): 203-214.
CrossRef - Agarwal T., Singh R. Bioremedial potentials of a moderately halophilic soil bacterium. Journal of Pharmaceutical and Biomedical Sciences 2012; 19(19).


