Assessment of Uranium Pollution in Ground Water and Human Health in Balod District, Chhattisgarh
Sheshkumari Sahu
*
 and Manoj Kumar Ghosh
1
Department of Chemistry,
Bharti Viswavidyalaya,
Durg,
Chhattisgarh
India
Copy the following to cite this article:
Sahu S, Ghosh M. K. Assessment of Uranium Pollution in Ground Water and Human Health in Balod District, Chhattisgarh. Curr World Environ 2024;19(2).
Copy the following to cite this URL:
Sahu S, Ghosh M. K. Assessment of Uranium Pollution in Ground Water and Human Health in Balod District, Chhattisgarh. Curr World Environ 2024;19(2).
Citation Manager Publish History

Introduction
A naturally occurring uranium contains a radioactive heavy metal that can be available in various geological formations. Its potential impacts on the environment and human health make it a reason for concern when it finds its way into groundwater. The World Health Organization gave a tolerable limit for uranium of 30 ?g/l in drinking water2. The naturally occurring radioactive metal uranium has a molar mass of 238.03 g/mol and an atomic number 92. It emits alpha particles. Uranium is a very important element in the field of science and technology due to its both radiological and chemical characteristics1,4. Because it exists in different quantities in water, rock, and air, it is an inevitable part of our environment3 Contamination of uranium in groundwater is caused by both natural and man-made sources, such as leaching from natural deposits, emissions from, burning coal and fuels, nuclear power stations, releases in mill tailings, and the use of fertilizers containing phosphate7,15. Chronic exposure to elevated uranium levels in drinking water can cause harm to the kidneys9. It is well known that uranium toxicity develops in the kidneys, where it can eventually lead to a variety of kidney-related health problems8.Uranium is considered a potential carcinogen. Long-term uranium exposure can raise the chance of developing several cancers, such as lung and liver tumours, as well as bone cancer, especially when the uranium is radioactive5. Apart from cancer and kidney damage, uranium exposure has also been linked to non-cancer health effects such as developmental and neurological disorders, reproductive troubles, and cardiovascular issues10. It is a highly toxic element. It causes serious disability due to radiation exposure, cancer risk, and renal damage from drinking water, so to protect against radiation damage and other various health problems due to uranium, it is monitored by the United States Environmental Protection Agency (USEPA) and different Health Organizations. For uranium, the maximum Concentration Level was fixed by the EPA according to the Safe Drinking Water Act (SDWA)11. According to the Agency for Toxic Substances and Disease Registry, radiological chemical risk is due to the contamination of uranium present in the underground water. when 0.1–6% of uranium is consumed by adults and absorbed in the blood6. The concentration of various drinking water resources should be monitored for the purpose of decreasing the radioactive chemical health risk posed by uranium in groundwater. For the purpose of determining the health risk caused by consuming this water, the uranium contamination level in groundwater samples collected from the Balod district in Chhattisgarh, India, will be measured by laser-induced fluorimetry.
Materials and Methods
Study Area
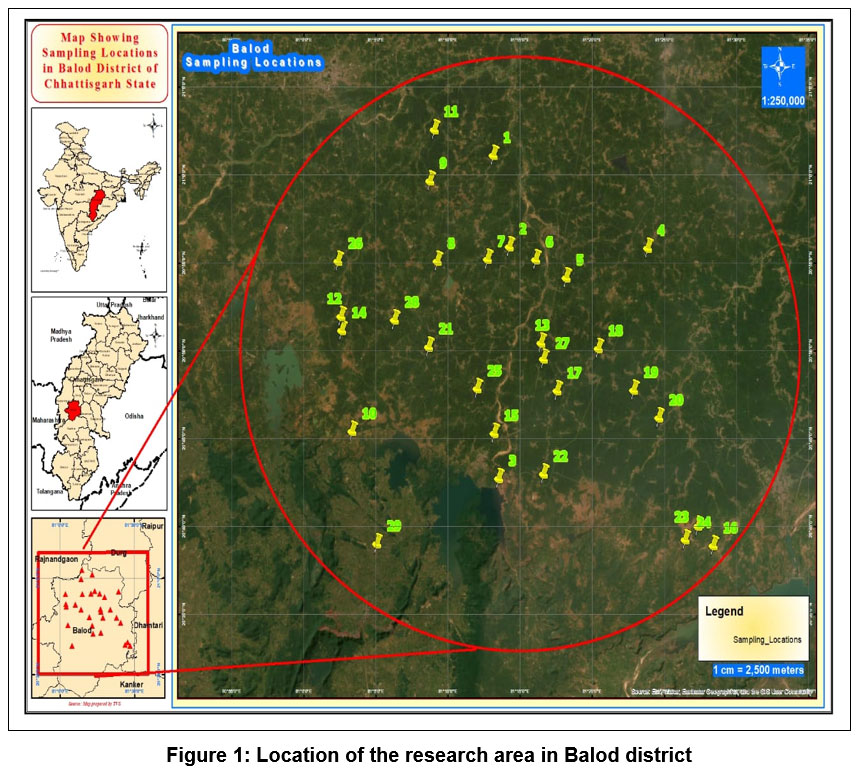 | Figure 1: Location of the research area in Balod district
|
Balod district is Located in the center of Chhattisgarh, Balod has unique features and rich mineral resources. It is situated between longitudes 80°48' and 81°30 east and latitudes 20°23' and 21°03' north. Balod is surrounded by five districts: in the north, Durg, which is famous for its industrial development center; in the south, Kanker, which is famous for its natural beauty, in the west, Rajnandgaon, which is known as the Sansakardhani; in the southwest, Mohla- Mnpur- Ambagarh -Chonki; and in the east, Dhamtari, which is known for medicinal properties. Area of Balod 3527 km2.
Sample Collection and Preservation
Twenty-nine water samples were collected from September 2022 to June 2023 from open wells and closed wells at different locations in the research area. At the time of sampling, collect the sample using a clean plastic bottle that has been pre-washed with distilled water. To reduce the amount of uranium lost by absorption in the bottles, 0.2 milliliters of nitric acid were added to all the samples that were brought inside the lab. The date, location, and time of the sampling were indicated on the labels attached to the samples. An LED fluorimeter was used to analyze the amount of uranium contained in water samples.
Determination of uranium in sample of water
Laser-induced Fluorimetry
The laser-induced fluorimetric technique is used to determine the quantity of uranium present in samples of water.The analysis of uranium is done by the LF-2a LED fluorimeter, which is made by Quantalase Enterprises Private Limited. Indore. The Quantalase LED Fluorimeter is a direct method for detecting and measuring uranium content in samples of water. Stimulate the fluorescence of uranium (VI) compound in the water sample when using a pulsed UV LED from the device. A photomultiplier tube (PMT) with high sensitivity can detect the green fluorescence that uranium complexes emit after excitation. The fluorescence yield indicates the quantity of the uranium present in the sample, which is directly proportional to both the excitation source intensity and the uranium concentration present in the sample water.
Analysis of Uranium
We can use the 0.45 Whatmann micron filter paper that was employed to remove suspended particles from the samples. When calibrating the instrument using standard uranium solutions, the matrix effect was eliminated by analyzing the water samples using the standard procedure. In the sample, sodium pyrophosphate (SPP), an inorganic reagent, is added to change all of the uranium compounds into a single form with a similar fluorescence yield due to the fluorescence yield varies throughout the complexes. Concentration may be detected with this technique down to 0.5 ug/l.
Reagent and Chemicals
Buffer Reagent
To maintain the pH range of 6.5–7.5, a five percent sodium pyrophosphate(SPP) solution was made and dropwise added orthophosphoric acid.
Sample preparation
Now we can add 2 milliliters of nitric acid and 6 milliliters of HCl to the 25 milliliters water sample. The sample should be heated below boiling. Once the sample has reached room temperature, pour it into a 50 ml volumetric flask and use ultrapure water to fill it to the top. Use ultrapure water to rinse the beaker's inside wall. Centrifuge or filter the sample. After filtering the sample, put 10% nitric acid into a 100 ml volume.
Health Risk Assessment
Radiological risk or carcinogenic risk assessment
Estimation of Excess life time cancer risk
Equations1 and 2 were approved by the USEPA ,to determine the Excess lifetime cancer risk(ECR)
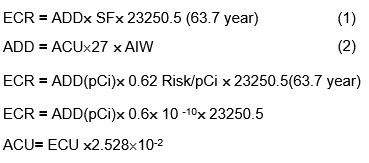
Where: ECR = excess cancer risk, ADD is average daily dose (pCi), ECU is the exposure concentration of Uranium (µg/l), SF is slope factor= 0.62 Risk/pCi10 ACU is the activity concentration of uranium(Bq/l) 1 µg/l uranium =2.528´10-2Bq/l and 1 Bq = 27 pCi and AIW is average ingestion of water =4.05l/day18.
Non-carcinogenic risk or chemical risk Assessment
Estimation of Hazard Quotient
To determine the chemical threat due to the ingesting the contaminated uranium water. The term of Hazard Quotient is used.
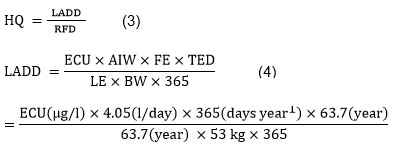
Equations 3 and 4 are used for estimation of the Hazard Quotient.
Where: LADD= life time average daily dose (ug kg-1 day-1) and RFD is reference does=0.6 (µg kg-1day-1)14 AIW is Average ingestion of water = 4.05(l/day), FE exposure frequency = 365 (days year-1), ECU is the exposure concentration of Uranium (µg/l), TED is the total exposure duration = 63.7(year), LE is the life expectancy = 63.7 (year) and BW is the body weight = 53 kg (for an Indian standard man).
Result and Discussion
Here, twenty-nine groundwater samples of Balod district, Chhattisgarh, were applied to the laser flourimetric technique analysis, including the uranium concentration, corresponding cancer risk (radiological risk), lifetime average daily dose, cancer risk (chemical risk), and Hazard Quotient (HQ), which are tabulated in tables 1, 2, 3, and 4.
Evolution of uranium concentration
In the months of September 2022 to June 2023, in groundwater, the uranium concentration has been detected to be 0.10 – 40.3 µg/L in September 2022 , 0.35 – 52.6 µg/L in December 2022, 0.48 – 65.8 µg/L in March 2023, and 0.45 - 66.7 µg/L in June 2023. Uranium concentration varies from a lower value of 0.10 to 66.7 µg/L in Chandanbirhi village to a higher value in Siwani village. The uranium concentration in 97% the sample of water is below the WHO permeable limit. Uranium concentration in months of March and June is slightly higher as compared to December and September due to both geogenic and human-induced sources15.
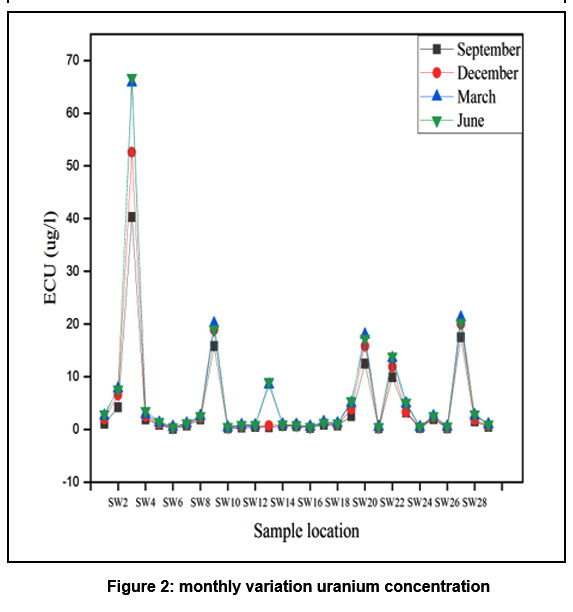 | Figure 2: monthly variation uranium concentration
|
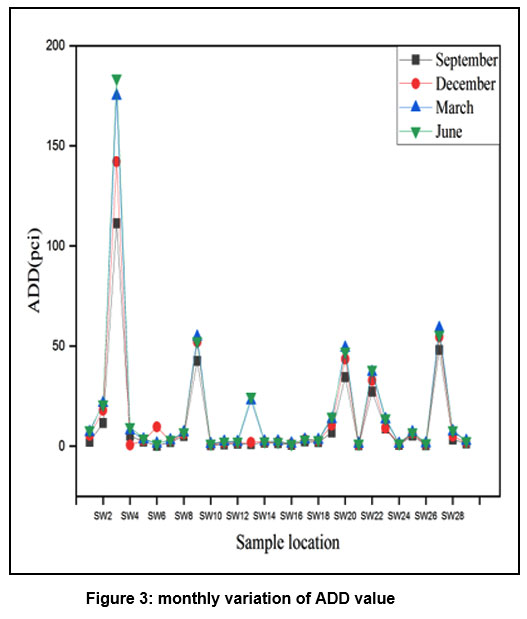 | Figure 3: monthly variation of ADD value
|
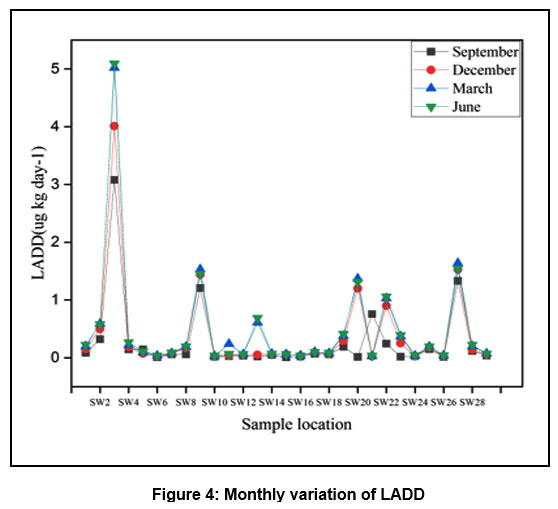 | Figure 4: Monthly variation of LADD.
|
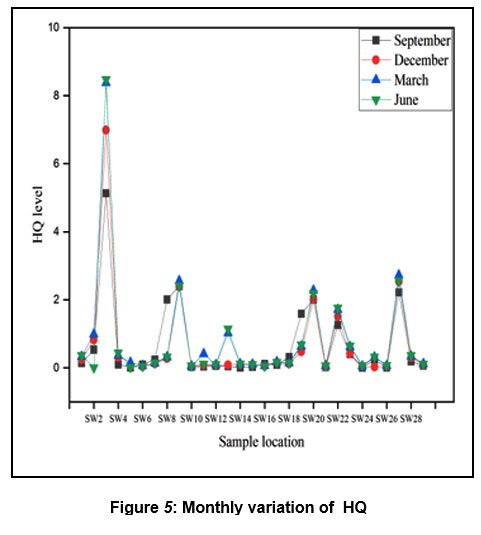 | Figure 5: Monthly variation of HQ.
|
Table 1: concentration of uranium and carcinogenic, non-carcinogenic risk in month of Sept. 2022
S n |
Location |
ECU (ug/l) |
ACU (Bq/l) |
ADD (pci) |
ECR | LADD (ug/kg-1 day-1) |
HQ |
| SW1 | Gorkhpur | 1.1 | 0.02 | 2.187 | 3.1´10-6 | 0.084 | 0.140 |
| SW2 | Khapari | 4.2 | 0.106 | 11.59 | 1.67´10-5 | 0.32 | 0.534 |
| SW3 | Siwani | 40.3 | 1.018 | 111.3 | 1.60´10-4 | 3.079 | 5.132 |
| SW4 | Jarwaya | 1.9 | 0.048 | 5.24 | 2.7´10-6 | 0.145 | 0.10 |
| SW5 | Madiyapar | 0.84 | 0.021 | 2.29 | 3.3´10-6 | 0.145 | 0.012 |
| SW6 | Chandanbirhi | 0.10 | 0.002 | 0.218 | 3.14´10-7 | 0.0064 | 0.095 |
| SW7 | Parastarai | 0.75 | 0.018 | 1.968 | 2.8´10-6 | 0.057 | 0.239 |
| SW8 | Bhaurkhabhat | 1.88 | 0.047 | 5.13 | 7.39´10-6 | 0.057 | 0.095 |
| SW9 | Bharda | 15.8 | 0.39 | 42.6 | 6.14´10-5 | 1.207 | 2.40 |
| SW10 | Bhalukona | 0.21 | 0.005 | 0.54 | 7.7´10-7 | 0.016 | 0.026 |
| SW11 | Bamhani | 0.35 | 0.008 | 0.874 | 1.25´10-6 | 0.026 | 0.044 |
| SW12 | Kapasi | 0.45 | 0.001 | 1.202 | 1.73´10-6 | 0.035 | 0.058 |
| SW13 | Phulzar | 0.39 | 0.009 | 0.98 | 1.4´10-6 | 0.02 | 0.049 |
| SW14 | Sorali | 0.65 0.58 | 0.016 0.014 | 1.74 | 2.50´10-6 2.2´10-6 | 0.049 0.006 | 0.01 0.03 |
| SW15 | Medki | 1.53 | |||||
| SW16 | Balodgaon | 0.25 | 0.006 | 0.656 | 9.1´10-7 | 0.019 | 0.11 |
| SW17 | Bori | 0.89 | 0.022 | 2.40 | 3.45´10-6 | 0.068 | 0.09 |
| SW18 | Matiya | 0.75 | 0.018 | 1.968 | 2.83´10-6 | 0.057 | 0.318 |
| SW19 | Satmara | 2.5 | 0.063 | 6.88 | 1.00´10-5 | 0.191 | 1.59 |
| SW20 | Bhothali | 12.5 | 0.316 | 34.5 | 4.97´10-5 | 0.015 | 2.01 |
| SW21 | Dubechera | 0.2 | 0.005 | 0.546 | 7.87´10-7 | 0.756 | 0.02 |
| SW22 | Sonhatera | 9.9 | 0.250 | 27.3 | 3.93´10-6 | 0.244 | 1.26 |
| SW23 | Bhejamaidani | 3.2 | 0.080 | 8.74 | 1.25´10-5 | 0.018 | 0.40 |
| SW24 | Nawgaon | 0.24 | 0.006 | 0.65 | 9.36´10-7 | 0.028 | 0.003 |
| SW25 | Sankara | 1.96 | 0.049 | 5.35 | 7.7´10-6 | 0.148 | 0.24 |
| SW26 | Marri | 0.2 | 0.005 | 0.54 | 7.87´10-7 | 0.015 | 0.009 |
| SW27 | Monagari | 17.5 | 0.44 | 48.1 | 6.93´10-5 | 1.33 | 2.22 |
| SW28 | Bhimkanhar | 1.5 | 0.03 | 3.28 | 4.7´10-6 | 0.114 | 0.19 |
| SW29 | Ghurvatola | 0.52 | 0.013 | 1.42 | 2.04´10-6 | 0.039 | 0.066 |
Table 2: concentration of uranium and carcinogenic, non-carcinogenic risk in month of Dec. 2022.
S n |
Location |
ECU (ug/l) |
ACU (Bq/l) |
ADD (pci) |
ECR | LADD (µg kg-1 day-1) |
HQ |
| SW1 | Gorkhpur | 1.95 | 0.049 | 5.35 | 7.7´10-6 | 0.149 | 0.24 |
| SW2 | Khapari | 6.5 | 0.164 | 17.9 | 2.58´10-5 | 0.496 | 0.82 |
| SW3 | Siwani | 52.6 | 1.32 | 142.1 | 2.0´10-4 | 4.01 | 6.99 |
| SW4 | Jarwaya | 2.4 | 0.006 | 0.65 | 9.4´10-6 | 0.183 | 0.30 |
| SW5 | Madiyapar | 1.0 | 0.025 | 2.73 | 3.9´10-6 | 0.071 | 0.127 |
| SW6 | Chandanbirhi | 0.35 | 0.088 | 9.62 | 1.38´10-6 | 0.02 | 0.04 |
SW7 SW8 | Parastarai Bhaurkhabhat | 0.98 | 0.024 0.055 | 2.62 6.01 | 3.7´10-6 8.6´10-6 | 0.07 0.168 | 0.122 0.28 |
| 2.2 | |||||||
| SW9 | Bharda | 18.9 | 0.477 | 52.1 | 7.5´10-4 | 1.44 | 2.40 |
| SW10 | Bhalukona | 0.32 | 0.008 | 0.87 | 1.25´10-6 | 0.024 | 0.04 |
| SW11 | Bamhani | 0.60 | 0.015 | 1.65 | 2.3´10-6 | 0.045 | 0.076 |
| SW12 | Kapasi | 0.64 | 0.016 | 1.76 | 2.5´10-6 | 0.048 | 0.081 |
SW13 SW14 | Phulzar Sorali | 0.68 0.82 | 0.017 0.02 | 1.869 2.187 | 2.6´10-6 2.3´10-6 | 0.051 0.062 | 0.086 0.10 |
SW15 SW16 | Medki Balodgaon | 0.78 0.42 | 0.019 0.01 | 2.154 1.093 | 3.0´10-6 1.57´10-6 | 0.059 0.032 | 0.094 0.053 |
| SW17 | Bori | 1.2 | 0.03 | 3.28 | 3.7´10-6 | 0.091 | 0.152 |
| SW18 | Matiya | 0.95 | 0.024 | 2.624 | 1.49´10-6 | 0.072 | 0.120 |
| SW19 | Satmara | 3.8 | 0.096 | 10.4 | 6.28´10-5 | 0.29 | 0.48 |
| SW20 | Bhothali | 15.8 | 0.399 | 43.6 | 1.0´10-5 | 1.20 | 2.01 |
| SW21 | Dubechera | 0.31 | 0.007 | 0.765 | 4.7´10-7 | 0.023 | 0.039 |
| SW22 | Sonhatera | 11.9 | 0.30 | 32.8 | 1.3´10-5 | 0.90 | 1.51 |
| SW23 | Bhejamaidani | 3.3 | 0.083 | 9.07 | 1.4´10-5 | 0.25 | 0.420 |
| SW24 | Nawgaon | 0.37 | 0.009 | 1.01 | 9.1´10-6 | 0.028 | 0.04 |
| SW25 | Sankara | 2.3 | 0.058 | 6.35 | 1.38´10-5 | 0.175 | 0.292 |
| SW26 | Marri | 0.35 | 0.008 | 0.96 | 7.87´10-6 | 0.026 | 0.04 |
| SW27 | Monagari | 20.0 | 0.50 | 54.6 | 7.8´10-4 | 1.528 | 2.54 |
| SW28 | Bhimkanhar | 1.8 | 0.045 | 4.92 | 7.0´10-5 | 0.137 | 0.229 |
| SW29 | Ghurvatola | 0.73 | 0.018 | 1.96 | 2.8´10-6 | 0.055 | 0.09 |
Table 3: concentration of uranium and carcinogenic, non-carcinogenic risk in month of march 2023.
S n |
Location |
ECU (ug/l) |
ACU (Bq/l) |
ADD (pci) |
ECR | LADD( µg kg-1 day-1) |
HQ |
| SW1 | Gorkhpur | 2.6 | 0.065 | 7.10 | 1.0´10-5 | 0.198 | 0.33 |
| SW2 | Khapari | 7.8 | 0.197 | 21.54 | 3.1´10-5 | 0.59 | 0.99 |
| SW3 | Siwani | 65.8 | 1.66 | 174.96 | 2.5´10-4 | 5.02 | 8.38 |
| SW4 | Jarwaya | 2.9 | 0.073 | 7.98 | 1.15´10-5 | 0.22 | 0.36 |
| SW5 | Madiyapar | 1.25 | 0.031 | 3.38 | 4.8´10-6 | 0.09 | 0.159 |
| SW6 | Chandanbirhi | 0.48 | 0.012 | 1.31 | 1.88´10-6 | 0.036 | 0.06 |
| SW7 | Parastarai | 1.10 | 0.027 | 2.95 | 4.2´10-6 | 0.08 | 0.14 |
| SW8 | Bhaurkhabhat | 2.52 | 0.063 | 6.88 | 9.9´10-6 | 0.19 | 0.32 |
| SW9 | Bharda | 20.12 | 0.50 | 54.67 | 7.88´10-4 | 1.53 | 2.56 |
| SW10 | Bhalukona | 0.40 | 0.01 | 1.09 | 1.57´10-6 | 0.03 | 0.05 |
| SW11 | Bamhani | 0.80 | 0.02 | 2.18 | 3.14´10-6 | 0.24 | 0.41 |
| SW12 | Kapasi | 0.78 | 0.019 | 2.07 | 2.98´10-6 | 0.059 | 0.09 |
| SW13 | Phulzar | 8.50 | 0.21 | 22.9 | 3.3´10-5 | 0.61 | 1.02 |
| SW14 | Sorali | 0.90 | 0.022 | 2.40 | 3.45´10-6 | 0.068 | 0.11 |
| SW15 | Medki | 0.85 | 0.021 | 2.29 | 3.3´10-6 | 0.06 | 0.10 |
| SW16 | Balodgaon | 0.50 | 0.012 | 1.31 | 1.88´10-6 | 0.038 | 0.06 |
| SW17 | Bori | 1.40 | 0.03 | 3.28 | 4.72´10-6 | 0.10 | 0.178 |
| SW18 | Matiya | 1.15 | 0.029 | 3.17 | 4.56´10-6 | 0.08 | 0.146 |
| SW19 | Satmara | 4.98 | 0.125 | 13.6 | 1.96´10-5 | 0.38 | 0.63 |
| SW20 | Bhothali | 17.98 | 0.45 | 49.2 | 7.09´10-5 | 1.37 | 2.28 |
| SW21 | Dubechera | 0.47 | 0.011 | 1.20 | 1.72´10-6 | 0.03 | 0.059 |
| SW22 | Sonhatera | 13.50 | 0.34 | 37.17 | 5.35´10-5 | 1.03 | 1.71 |
| SW23 | Bhejamaidani | 4.9 | 0.123 | 13.45 | 1.93´10-5 | 0.37 | 0.62 |
| SW24 | Nawgaon | 0.45 | 0.011 | 1.235 | 1.78´10-6 | 0.034 | 0.05 |
SW25 SW26 | Sankara Marri | 2.50 0.52 | 0.063 0.013 | 6.88 1.421 | 9.17´10-6 2.04´10-6 | 0.191 0.039 | 0.31 0.066 |
| SW27 | Monagari | 21.2 | 0.54 | 59.0 | 8.5´10-4 | 1.64 | 2.73 |
| SW28 | Bhimkanhar | 2.7 | 0.068 | 7.43 | 1.07´10-5 | 0.20 | 0.34 |
| SW29 | Ghurvatola | 0.96 | 0.024 | 2.64 | 3.8´10-6 | 0.073 | 0.12 |
Table 4: concentration of uranium and carcinogenic, non-carcinogenic risk in month of June 2023.
S n |
Location |
ECU (ug/l) |
ACU (Bq/l) |
ADD (pci) |
ECR | LADD (µg kg-1 day-1) |
HQ |
| SW1 | Gorkhpur | 2.9 | 0.073 | 7.98 | 1.15´10-5 | 0.221 | 0.369 |
| SW2 | Khapari | 7.6 | 0.192 | 20.99 | 3.02´10-5 | 0.580 | 0.01 |
| SW3 | Siwani | 66.7 | 1.68 | 183.7 | 2.64´10-4 | 5.09 | 8.48 |
| SW4 | Jarwaya | 3.5 | 0.088 | 9.62 | 1.38´10-5 | 0.267 | 0.445 |
| SW5 | Madiyapar | 1.43 | 0.036 | 3.93 | 4.88´10-6 | 0.109 | 0.0182 |
| SW6 | Chandanbirhi | 0.45 | 0.0113 | 1.235 | 1.77´10-6 | 0.034 | 0.05 |
| SW7 | Parastarai | 1.19 | 0.030 | 3.28 | 4.72´10-6 | 0.09 | 0.151 |
| SW8 | Bhaurkhabhat | 2.56 | 0.0647 | 6.99 | 1.0´10-5 | 0.195 | 0.326 |
| SW9 | Bharda | 19.0 | 0.48 | 52.48 | 7.56´10-4 | 1.45 | 2.41 |
| SW10 | Bhalukona | 0.48 | 0.012 | 1.296 | 1.86´10-6 | 0.036 | 0.061 |
| SW11 | Bamhani | 0.88 | 0.022 | 2.40 | 3.4´10-6 | 0.067 | 0.11 |
| SW12 | Kapasi | 0.84 | 0.021 | 2.296 | 3.3´10-6 | 0.064 | 0.10 |
| SW13 | Phulzar | 9.0 | 0.227 | 24.8 | 3.57´10-5 | 0.687 | 1.145 |
| SW14 | Sorali | 0.94 | 0.023 | 2.51 | 3.61´10-6 | 0.071 | 0.119 |
| SW15 | Medki | 0.79 | 0.0199 | 2.17 | 3.12´10-6 | 0.060 | 0.100 |
| SW16 | Balodgaon | 0.46 | 0.0116 | 1.25 | 1.80´10-6 | 0.035 | 0.058 |
| SW17 | Bori | 1.26 | 0.031 | 3.38 | 4.87´10-6 | 0.096 | 0.16 |
| SW18 | Matiya | 1.13 | 0.0285 | 3.078 | 4.43´10-6 | 0.086 | 0.143 |
| SW19 | Satmara | 5.4 | 0.136 | 14.8 | 2.13´10-5 | 0.412 | 0.68 |
| SW20 | Bhothali | 17.20 | 0.434 | 47.3 | 6.81´10-5 | 1.314 | 2.195 |
| SW21 | Dubechera | 0.49 | 0.012 | 1.296 | 1.86´10-6 | 0.037 | 0.062 |
| SW22 | Sonhatera | 13.85 | 0.350 | 38.25 | 5.51´10-5 | 1.058 | 1.763 |
| SW23 | Bhejamaidani | 5.1 | 0.128 | 13.97 | 2.01´10-5 | 0.389 | 0.649 |
| SW24 | Nawgaon | 0.54 | 0.0136 | 1.486 | 2.14´10-6 | 0.041 | 0.068 |
| SW25 | Sankara | 2.54 | 0.064 | 6.99 | 1.00´10-5 | 0.194 | 0.323 |
| SW26 | Marri | 0.58 | 0.014 | 1.53 | 2.20´10-6 | 0.044 | 0.073 |
| SW27 | Monagari | 20.23 | 0.51 | 55.7 | 8.02´10-4 | 1.54 | 2.56 |
| SW28 | Bhimkanhar | 2.9 | 0.073 | 7.98 | 1.15´10-5 | 0.221 | 0.369 |
| SW29 | Ghurvatola | 0.94 | 0.0237 | 2.58 | 3.7´10-6 | 0.071 | 0.11 |
Evaluation of Radiological risk
ECR (excess cancer risk) varies from 3.14´10-7 to1.60´10-4 in September 2022, 1.38´10-6 to 2.0´10-4 in December 2022, 1.88´10-6 to 2.5´10-4 in March 2023 and 1.77´10-6 to 2.64´10-4 in June 2023 The acceptable range of excess lifetime cancer risk (ELCR) is 1´10-4 as established by USEPA. Compared to the allowable thresholds, the reported cancer risk (CR) levels for most of the water samples are low, except for Siwani village. If uranium isingested, its alpha emissions have a direct radiation effect that can lead to genetic mutations, irregularities in the formation of the foetus and growing of kids, and cancer16.
Evaluation of non carcinogenic risk
The LADD ranges from 0.0064 to 3.079 in the month of September 2022, 0.02 to 4.01 in December 2022 , 0.06 to 5.02 in March 2023 and 0.034 to 5.09 µg kg-1 day-1 in June 2023. 82% of the water sample LADD value is below 1 µg kg-1 day-1 which is in under the WHO guidelines. HQ Level of 76 % water sample is below the one which is accepted by WHO. The LADD value of 18% and HQ value of 24% of the water sample exceed the permissible limit, which indicates a high risk of chemical poison.
Comprehensive study
in this study, we use laser-induced fluorimetry to identify the uranium contamination in groundwater. From September 2022 to June 2023, sample collection was done from different places of Balod district, Chhattisgarh. Balod is a mineral-rich district, and most of the area is used for agricultural work and industrial purposes. So the uranium concentration in this area of groundwater rises from September 2022 to June2023. Except for one sample, the level of uranium in all samples is low the permissible level. Geogenic main sources of uranium in groundwater are breaking and dissolving mineral-rich rocks by streams, and human induced sources are, phosphate fertilizer used for agricultural work, mining of gas, phosphate and oil industries, waste from war and atomic power plants, and decline of the groundwater level. Uranium has radioactive properties, external exposure to uranium is not as greater risk as to other radioactive material as inhalation or intake at a higher amount of uranium. radiological effect or cancer risk are low in this area, one village has a cancer risk is close to the cancer risk threshold limit. The radiation effect of uranium cause many diseases, including skin cancer, lung cancer, liver cancer, kidney cancer, reproductive disabilities, irregularities of sex hormones, and decreased the fertility of males. non-carcinogenic risk poses in this area due to the chemical characteristics of uranium. One out of the each four samples, indicating chemical risk from ingesting uranium-contaminated water. The chemical poisoning of uranium on humans causes, its affected, kidney damage, cardiovascular issues, and heart failure, and damage to the central nervous system, such as amnesia, anxiety, neurobehavioral abnormalities, and irregularities in sleep wake cycles. The purpose of the study was to make people aware and tell them about the carcinogenic and non-carcinogenic risk to people from consuming contaminated uranium water. Groundwater of Balod district, Chhattisgarh, is needed remediation and monitoring.
Comparing the amount of uranium identify in previous studies.
Table 5: Levels of uranium identified in drinking water in various Chhattisgarh districts.
District | Uranium Concentration (µg/l) |
References |
Korba
Baster
|
0.031 - 140.1
0.50 - 26.4 |
38
33 |
Durg
| 0.638 - 45.7 | 34 |
Bijapur
| 0.21 - 10.4 | 35 |
Balod
| 0.563 - 78.93 | 1,4 |
Raipur
| 0.2 - 13 | 37 |
Bemetara
| 1.15 - 83.5 | 13 |
Rajnandgaon
| 0.5 - 99.9 | 36 |
Table 6: Levels of uranium found in drinking water in various Indian states.
| Indian state (cities) | Uranium Concentration (µg/l)
| References |
| Assam (Nalbari) | 0.3-10.3 | 15 |
| Southwest Punjab | 0.5 - 579 | 9 |
| West Haryana | 0.3 - 256.4 | 24 |
| Andhra-Pradesh (visakhapatanam) | 0.6 - 12.3 | 7 |
| Karnataka (Chamarajanagar) | 0.03 - 4.63 | 27 |
| Punjab(Bhatind) | 9.72 -186.6 | 20 |
| Eastern Utter Pradesh | 0.3 - 63.33 | 21 |
| Current study | 0.10 - 66.7 |
Conclusion
Water is important for survival. So it is essential to identify the amount of uranium in water. The current study's range of uranium concentrations in groundwater was significantly lower than the WHO's acceptable threshold value. concentration of uranium above the acceptable level only in the Siwani village. Uranium concentration increased from September 2022 to December 2022 and from December 2022 to March and June 2023 due to the breakdown of uranium from soil sediments during the rain, by dissolution, fertilization with phosphate and nitrate from agriculture may be the source of uranium in the groundwater. The value of ECR, LADD, and HQ increases from the month of September 2022 to December 2022 due to the increasing concentration of uranium in groundwater. The ECR value is slightly high in SIwani village and the ECR for Bharda and Monagari is very close to the acceptable range of 1´10-4. When compared to the radiological risk permitted level of 10-3, the results indicate cancer risk (CR) is low. The Hazard Quotient in Siwani Village was expected to be 5.13 in the month of September 2022, 6.9 in December 2022, 8.38 in March 2023 and 8.48 in June 2023, indicating that this region needs properly monitoring and remedial action. The study found that the area's uranium's chemical toxicity may be the cause of non-carcinogenic health problems, but eventually, there is no carcinogenic (radiological) risk to people.
Acknowledgements
Authors are thankful to Department of Chemistry, Bharti Vishvavidyalya, Durg for providing lab facilitiesOne author is also thankful to one consultant labs for providing some instrument facilities.
Funding Sources
There is no funding support of any kind for this work.
Conflict of Interest
Authors have no competing of interest.
Authors Contribution
Sheshkumari sahu : Experimentation, collection of samples Writing–draft and corresponding author, ; Manoj kumar Ghosh: Supervision, Writing–review editing .
Data Availability statement: Experimental data.
Ethics Approval statement: In this study no involves an experiment on human and animals.
References
- Diwan V, Sar S. K, Singh S, Sahu M, Jindal M. K, Arora A, Biswas S. Study of uranium contamination & its health effect in groundwater of balod district of chhattishgarh state, India. Intrnational Journal of Scientific Research in Science, Engineering and Technology. 2018; 4:125-131.
- World Health Organization(WHO). Guidelines for Drinking Water Quality 4th eddition. WHO Geneva, Switzerland. 2011; 241-252.
- Hon Z, Osterreiche J, Navratil L. Depleted uranium and its effectson humans. Sustainability. 2015; 7:4063-4077.
CrossRef - Sar S, Diwan V, Biswas S, Singh S, Sahu M, Jindal M. K, Arora A. Study of uranium in groundwater of balod district of Chhattishgarh state, India and assessment of health risk. Human Ecology Risk Assessment An International Journal. 2017; 24:691-698.
CrossRef - International Commission on Radiological Protection (ICRP). Age-Dependant Doses to Members of the Public from Intake of Radionuclides: Part 5. Compilation of Ingestion and Inhalation Coefficients Ann ICRP 26.Oxford. ICRP Publication 72 Pergamon Press.1996.
CrossRef - ATSDR. Toxciological profile. U.S. Department of Health and Human Services, Agency for Toxic Substances and Disease Registry. 2013.
- Bhangare R. C, Tiwari M, Ajmal P. Y, Sahu S. K, Pandit G. G. Laser flourimetric analysis of uraniumin water from Vishakhapatnam and estimation of health risk. Radiation Protection and Environment. 2013; 36(3):128-132.
CrossRef - Kurtti P, Auvinen A, Salonen L, Saha H, Pekkanen J, Makelaien I, Vaisanen S. B, Penttila I. M, Komulainen H. Renal effects of uraniumin drinking water. Environ Health Perspect. 2002; 110:337-342.
CrossRef - Bajwa B. S, Kumar S, Singh S, Tripathi R. M, Sahoo S. K. Uranium and other heavy toxic elements distribution in the drinking water samples of SW-Punjab, India. Journal of Radiation Research and Applied Science. 2015; 10:13–19.
CrossRef - Hakonson-Hayes A. C, Fresquez P. R, Whicker F. W. Assessing potentialrisks from exposure to natural uranium in well water. Journal of Environmental Radioactivity. 2002; 59:29-40.
CrossRef - Environmental Protection Agency (EPA). National primary drinkingwater regulations Radionuclides; National primary drinking water regulations. 2000; 65:76708-53.
- Ye-shin K, Hoa-sung P, Jin-yong K, Sun-ku P, Byong-wook C, Ig-hwan S, Dong-Chun S. Health risk assessment for uranium in Korean groundwater. Journal of Environmental Radioactivity. 2004; 77(1):77–85.
CrossRef - Sahu M, Sar S.K, Dewangn R, Baghel T. Health risk evalution of uranium in groundwater of Bemetara district of chhattishgarh state, India. Spring. 2020; 22(8):7619-7638. doi: 10.1007/s10668-019-00539-6
CrossRef - Dang H. S, Jaiswal D. D, Parameswaran M, Krishnamony S. Physical, anatomical physiological and metabolicdata for reference Indian Man a-proposal, Bhabha Atomic Research Centre, Mumbai. International Atomic Energy Agenevy.1994; p.75.
- Saikia R, Chetia D, Bhattacharyaya K. G. Estimation of uranium in groundwater and assessment of age-dependent radiation does in Nalbari district of Assam, India. Springer Natural science. 2021; 3(1):1-21
CrossRef - Amakom C.M, Jibiri N. N. Chemical and radiological risk assessment of uranium in borehole and well watersin the Odeda Area, Ogun State, Nigeria. International Journal of the Physical Science. 2010; 5:1009-1014.
- Thun M. J, Baker D. B, Steenland K, Smith A. B, Halperin W, Scand T. B. J. W. Renal toxicity in uranium mill worker. Journal Work Environ Health. 1985; 11:83-90.
CrossRef - HDR. Human development report Mumbai, India: NationalResource Centre for UrbanPoverty and All India Instituteof Local self Government. 2009; p.285.
CrossRef - Rossiter H. M. A, Owusu P. A, Awuah E, MacDonald A. M, Schafer A. I. Chemical drinking water quality in Ghana: water costs andscope for advancedtreatment. Sci Total Environ. 2010; 408(11):2378–2386. doi: 10.1016/j.scitotenv.2010.01.053
- VirK H. S. Measurement of Concentration of NaturalUranium in Ground Waters of Bathinda District (S. Punjab) for the Assessment of Annual Effective Dose Global Journals of Human Social Science. 2016; 16(5):1-7.
- Kumar M. P, Prerna S, Mishra K. A, Prasad K. Uranium in Ground water of EasternUttar Pradesh, India: A preliminary study. International Research Journal of Environmental Scienc. 2015; 4(6):70-74.
- Arzuaga X, Rieth S .H, Bathija A, Cooper G. S. Renal effects of exposure to natural and depleted uranium: a review of the epidemiologic and experimental data. J Toxicol Environ Health B Crit Rev. 2010; 13:527–545.
CrossRef - Lee M. H, ChoiG. S, Cho Y.H, Lee C.W, Shin H. S. Concentrations and activity ratios of uranium isotopes in the groundwater of the Okchun Belt in Korea. J Environ Radioact. 2001; 57:105–116. doi: 10.1016/s0265-931x(01)00014-5.
CrossRef - Duggal V, Sharma S, Saini K, Bajwa B. S. Assessment of carcinogenic and non-carcinogenic risk from exposure to uranium in groundwater from Western Haryana, India.Journal Geological Society of India. 2017; 89:663–668.
CrossRef - Gao N, Huang Z, Liu H, Hou J, Liu X. Advance on the toxycity of uranium to different organism. Chemosphere. 2019; 237. doi: 10.1016/j.chemosphere.2019.124548.
CrossRef - Kumar A, Rout S, Narayanan U, Mishra M. K, Tripathi R. M, Singh J, Kumar S, Kushwaha H. S. Geochemical modelling of uranium speciation in the subsurface aquatic environment of Punjab State in India. Journal of Geochemical and Mining Research. 2011; 3(5):137-146.
- Nagaraju K. M, Chandrashekara M. S, Pruthvi, K. S, Paramesh L. Estimation of radiation dose due to uranium in Chamarajanagar district Karnataka State, India. American International journal of Research in Science, Technology Engineering and Mathematics. 2014; 7(2):144-147.
- Rani A, Mehra R, Duggal V, Balaram V. Analysis of uraniumconcentration in drinking water samples using ICPM. Health Physics. 2013; 104(3):251-255.
CrossRef - Byju S. B, Sunil A, Reeba M. J, Christa E. P, Vaidyan V. K, Prasad R, Jojo P. Uranium in drinking water from the south coast districts of Kerala, India. Int J Radiat Res. 2012; 10(1):31-36.
- Dhun S. S, Khaliya P, Solanki P, Laura J. S. Uranium sources, uptake, translocation in the soil-plant system and its toxycity in plant and humans: a critcal review. Oriantal Journal of Chemistry. 2023; 39(2):303-319.
CrossRef - Chandrakar P, Acharya C. Inorganic polyphosphate accumalation protects a marine, filamentous, cynobacterium, anabaena torulosa agenst uranium toxycity. J Environ Radioact. 2023; 263. doi: 10.1016/j.jenvrad.2023.107185
CrossRef - Bjorklund G, Semenova Y, Pivina L, Dadar M, Rahman M. M, Aaseth S, Chirumboli S. Uranium in drinking water: a public health threat. Arch Toxicol . 2020; 94(5):1551-1560. doi: 10.1007/s00204-020-02676-8
CrossRef - Singh M, Sahu p, Tapadia K, Jhariya D. Assesment of the groundwater quality by using multivariate approch and non carcinogenic risk of uranium in the inhabitants of the Bastar district, chhattishgarh, central India. water supply. 2022; 22(4):3863-3878.
CrossRef - Sar S. K, Sahu M, Singh S, Diwan V, Jindal M, Arora A. Assessment of uranium in groundwater from Durg district of Chhattisgarh state and its correlation with other quality parameters. Journal of Radioanalytical and Nuclear Chemistry. 2017; 314: 2339-2348.
CrossRef - Singh M, Tapadia K, Jhariya D, Sahu P. Evaluation of uranium containing groundwater quality and non-carcinogenic risk assessment in inhabitant of Bijapur district of Chhattisgarh, central India. Journal of Radioanalytical and Nuclear Chemistry. 2021; 327:939-947.
CrossRef - Diwan V, Sar S. K, Biswas S, Dewangan R, Baghel T. Uranium in groundwater of Rajnandgaon District of central India. Radioanalytical and Nuclear Chemistry. 2019; 321:293-302.
CrossRef - Pandey P, Panday M, Panday P.K. Evaluation of uranium of Raipur District of Chhattisgarh: GIS assistedhydrogeochemical study of underground water.Journal of the Indian Chemical Society. 2022; 99.
CrossRef - Kashyap K. K, Ghosh M. K. Uranium concentration and health risk assessment in groundwater sample taken different location of Korba District, Chhattisgarh, India. Eco.Enu. and cons. 2021; 171-178.


