Assessing Urbanization Dynamics Through Land Use/Land Cover Change Detection in Zunheboto Sadar, Nagaland, India.
Khekuto Kiho1
*
 , Asha Manjari K.G1
and Paolenmang Haokip2
, Asha Manjari K.G1
and Paolenmang Haokip2
1
Department of Studies in Earth Science,
University of Mysore,
Manasagangotri, Mysuru,,
Karnataka
India
2
Department of Geology,
School of Physical Sciences,
Sikkim University,
Gangtok, Sikkim,,
India
http://dx.doi.org/10.12944/CWE.19.2.32
Copy the following to cite this article:
Kiho K, Manjari K. G. A, Haokip P. Assessing Urbanization Dynamics Through Land Use/Land Cover Change Detection in Zunheboto Sadar, Nagaland, India. Curr World Environ 2024;19(2). DOI:http://dx.doi.org/10.12944/CWE.19.2.32
Copy the following to cite this URL:
Kiho K, Manjari K. G. A, Haokip P. Assessing Urbanization Dynamics Through Land Use/Land Cover Change Detection in Zunheboto Sadar, Nagaland, India. Curr World Environ 2024;19(2).
Download article (pdf)
Citation Manager
Publish History

Introduction
The alteration of LULC is regarded as a crucial environmental concern with repercussions on a global scale. Both globally and the India community face dynamic and complex LULC changes. India's rapid agricultural and urban expansion, improved water management, and conservation efforts are mirrored globally but vary in scale and specifics due to regional differences. The use of satellite imagery and advanced mapping technologies is crucial for monitoring these changes and supporting sustainable land use planning.1 The LULC status of Nagaland reflects a dynamic interplay between traditional practices, development, and conservation. Forests cover approximately 75% of Nagaland's total geographical area. In the mountainous areas of Nagaland, Jhum cultivation is a prevalent and traditional agricultural method in the state of Nagaland.2 The reduction in Jhum cycles contributes to persistent poverty due to low productivity and the elevated costs associated with frequent forest clearing, this negatively impacts the ecosystem as well.3 Studies based on empirical evidence from various disciplines reveal that alterations in LULC plays a pivotal role in various applications like agriculture, hydrology, environmental science, geology, ecology, and forestry.4 Remotely sensed datasets from satellite sources for various analyses has significantly grown since the introduction of Landsat data in 1972. In recent times, Landsat imagery data archive has become publicly accessible at no cost. This development enhances the feasibility of obtaining and utilizing multitemporal images to monitor changes in LULC.5
This change detection is now essential in monitoring and managing the urban development and natural resources, mainly because it makes quantitative study of the spatial distribution easier.6 There are various methods available to identify and document differences commonly associated with LULC change detection and the process of change detection is inherently linked to the timing of observation, the duration of the period, and the methods and means employed for observation. 7
The study area is undergoing rapid urban expansion and is the most densely populated region within the Zunheboto district of Nagaland. Therefore, this study aims to examine both the urban growth and the status of the forest cover in the year 2023 with respect to the year 2014 to raise awareness of these changes among the public.
Study Area
The research site, namely Zunheboto Sadar shown in figure 1, is located within the Zunheboto district of Nagaland, India. It covers total area of 123.34 km2 or 12334 hectares. This region falls within the Toposheet number 83 J/8, 83 J/12, 83 K/5, and 83 K/9 sections. The coordinates of the study area range from approximately 25°56'42.93'' to 26°6'15.44'' North latitude and 94°27'54.85'' to 94°37'20.61'' East longitude. The terrain of the study area is characterized by distinguished by mountainous elements oriented in the NNE-SSW direction, constituting a portion of the Naga Hills. The study area is roughly 123 km², with an altitude varying from 642 m to 1989 m above msl. Because of its altitude, the area enjoys a moderate humid subtropical climate with cool winters and hot, very rainy summers. The district receives roughly 2000 mm of rain on average, with July and August seeing the most rain and September through October seeing sporadic showers. On the other hand, November to April has a dry season. The entire count of homes within the study area as per census 2011 was 6171 with population of 33,225 person.
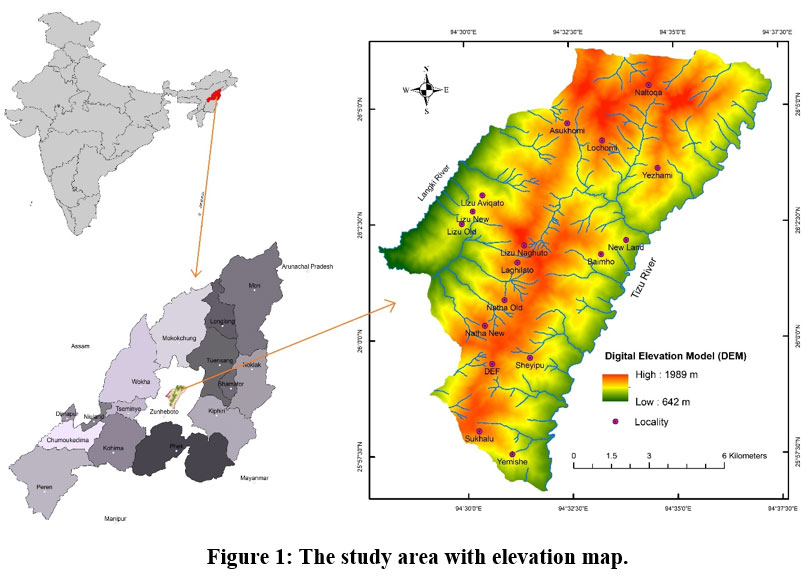 | Figure 1: The study area with elevation map.
|
Materials and Methods
Satellite Imageries, ArcGIS 10.8, Google Earth pro and ERDAS imagine 14 software were utilised to meet the objective. To investigate LULC modifications in Zunheboto Sadar, multispectral satellite images LANDSAT 8 OLI images of 2014 and 2023 of the region were acquired from the United States Geological Survey (USGS). LANDSAT 8 OLI data obtained on 17th April 2014 and on 10th April 2023 were utilized to create the LULC map of the respective years with an objective to see the changes in different classes within the study area for the span of nine years. The successful deployment of the Landsat Data Continuity Mission took place on 11th Feb, 2013 and it was formally rebranded as Landsat 8 on 30th May 2013. This latest addition to the Landsat series provides scientists with an improved perspective, featuring improved spatial resolution compared to the majority of ocean-sensing instruments with increased sensitivity to colour and brightness when compared to earlier LANDSAT imagery.8 The properties and applications of Landsat 8 bands can be seen in https://www.usgs.gov/landsat-missions/landsat-8
Table 1: Specification of Landsat 8 OLI/TIRS data used.
Satellite | Sensor ID | The Path | The Row | Layers | The acquisition date | cell size (m) |
Landsat 8 OLI/TIRS | LC08_L1TP_135042_20230410 | 135 | 42 | 11 | 10-04-2023 | 30 |
Landsat 8 OLI/TIRS | LC08_L1TP_135042_20140417 | 135 | 42 | 11 | 30 |
Initially, the image processed satellite data were projected onto UTM zone 46 N with the WGS-84 datum. Following that, subset of the study area was extracted by defining Area of Interest (AOI). The satellite data was then processed with ERDAS Imagine software version 14.0.0.1, which enabled layer stacking and generation of False Colour Composites (FCC) for both the LANDSAT 8 satellite datasets. Supervised and unsupervised classification are the two primary methods for categorizing remotely sensed image data. Supervised classification is particularly vital for extracting quantitative insights. In this method, analysts use a set of known pixels to construct variables for each class being considered. This process, known as training, involves instructing the classifier to label all image pixels based on these parameters. The commonly used supervised classification method, Maximum Likelihood Classifier (MLC), is predicated on the premise that each spectral class follows a multivariate normal distribution. MLC leverages both mean vectors and multivariate spreads to effectively identify elongated classes. Nonetheless, the accuracy of MLC is dependent on the precise estimation of parameters of each spectral class's covariance matrix and mean vector (m). Therefore, ensuring accurate parameter estimation is crucial for the effectiveness of this classification approach. 9,10,11
Consequently, the LANDSAT 8 images were subjected to supervised classification employing the maximum likelihood algorithm. The classification process involved choosing pixels that represent the desired classes and a total of 8 classes were identified based on specific Digital Number (DN) values corresponding to different LULC elements in both satellite images. These classes include Jhum cultivation, Moderately Dense Forest, Open Forest, Settlements, Shrub, Terrace Cultivation, Very Dense Forest, and Water Bodies. The forest classification was made adhering to the guidelines provided by the Forest Survey of India.12
In order to boost classification precision and reduce misclassifications, a post-classification refinement technique was implemented. This approach was geared towards streamlining and enhancing effectiveness, particularly in urban areas with a complex array of features like buildings, grass, roads, soil, trees, and water bodies.13 A field survey was undertaken to validate the classified map generated from LANDSAT 8, focusing on ground verification in uncertain regions. GPS technology and local guides were utilized in various sections of the study area, encompassing all LULC classes. The map was then validated. However, certain areas were inaccessible due to the challenging mountainous topography, rough terrain, steep slopes, and expansive coverage.
Classifications
Very Dense Forest: The regions with tree coverage, reveal a canopy density of 70% or higher.
Moderately Dense Forest: Areas containing tree cover, with a canopy density falling within the range of 40% to 70% or surpassing this threshold.
Open Forest: All locations with tree cover, have a canopy density of 10% to 40%.
Scrub: Forested areas with little tree growth, predominantly undersized trees, with a canopy density of less than 10%.
Terrace cultivation: Wet terrace farming is typically practiced in Nagaland's mountainous regions where there is access to spring water or river water nearby. In the study area, paddy cultivation using wet terrace farming is observed along the banks of the Tizu and Langki river. This agricultural practice is employed to prevent soil erosion, manage water runoff, and optimize land use in areas with uneven topography.
Jhum Cultivation
Jhum cultivation, also recognized as slash-and-burn agriculture or shifting cultivation, encompasses the practice of clearing land by cutting and burning vegetation. After this procedure, the cleared land is utilized for cultivation until a decline in soil fertility occurs. Once the fertility diminishes, farmers move on to a new plot, leaving the previously used land fallow to undergo natural regeneration over time.14 In the study area jhum cultivation practiced without any fertilizers and the irrigation depends wholly on rainfall.
Water Bodies
The Tizu river, which originates from the northeast and flows towards the south, serves as the principal river delineating the eastern boundary of the research region. Concurrently, the Langki river is situated in the western segment of the study zone. Wet terrace cultivation for rice paddies is frequently observed along the shores of these rivers. In the hilly terrain of the study area, the absence of lakes was notable, with only a limited number of ponds present. Both the rivers and ponds were categorized collectively as water bodies.
Image Processing
Pre-processing satellite imagery is essential for demonstrating a clearer correlation between obtained data and biophysical phenomena. Because of the operating features of acquisition systems and platform motions, remotely sensed data obtained from aerial or satellite platforms frequently manifests geometric distortions. Preprocessing techniques are employed to mitigate biases induced by various sources of "noise" and instrument "artifacts" inherent in the data. Among the pivotal stages of data preprocessing aimed at radiometric correction emerge, multitemporal image geometric correction and change detection as paramount. Raw imagery typically exhibits geometric distortions attributable to platform dynamics, sensor properties, overall field of view, atmospheric conditions, and terrain variations. Geometric correction procedures are instrumental in mitigating or eliminating these distortions, thereby ensuring accurate spatial registration of the imagery within a geographic information system context.15 Attaining radiometric uniformity among diverse remotely sensed datasets poses a challenge due to disparities in sensor attributes, atmospheric circumstances, solar azimuth, sensor viewing geometry, and phenological attributes.16 Both the LANDSAT satellite imagery was brought into ERDAS Imagine software version 14.0.0.1 for geometric and radiometric correction after the process of layer stacking.
Accuracy Assessment
Accuracy assessment, as illustrated in Tables 4 and 5 via Confusion Matrices or Error Matrices, serves to compute metrics of classification precision. These measurements include overall accuracy, omission error and commission errors, alongside Cohen's kappa statistic.
The Kappa Coefficient is a statistical measure established in assessing precision of a categorization. It primarily analyzes the classification's performance in comparison to random value assignment. A Kappa value of 0 signifies that the categorization is as accurate as random chance, whereas a number around 1 show that the grouping notably outperforms randomness.17 The formula for calculation of Kappa is shown in equation (1) and the Rating criteria of Kappa statistics is shown in Table No. 3.

A total of 200 pixels was extracted from the LULC categorized map for 2023 with minimum 15 pixels for each class for accuracy assessment. Ground truth verification was conducted between June and December 2023. Similarly for the classified map 2014, although the validation was carried out using Google Earth imagery for the timeline 2014.
Results and Discussion:
LULC map has been classified into 8 classes for both the years namely, Jhum cultivation, Moderately Dense Forest, Open Forest, Settlements, Shrub, Terrace Cultivation, Very Dense Forest, and Water Bodies. Zunheboto Sadar being the most populous area under the Zunheboto district, there existed a requirement to examine changes in LULC.


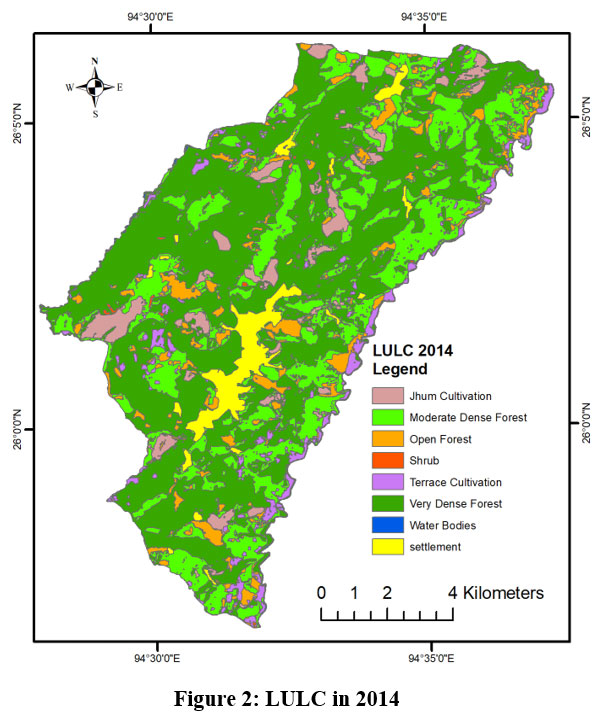 | Figure 2: LULC in 2014.
|
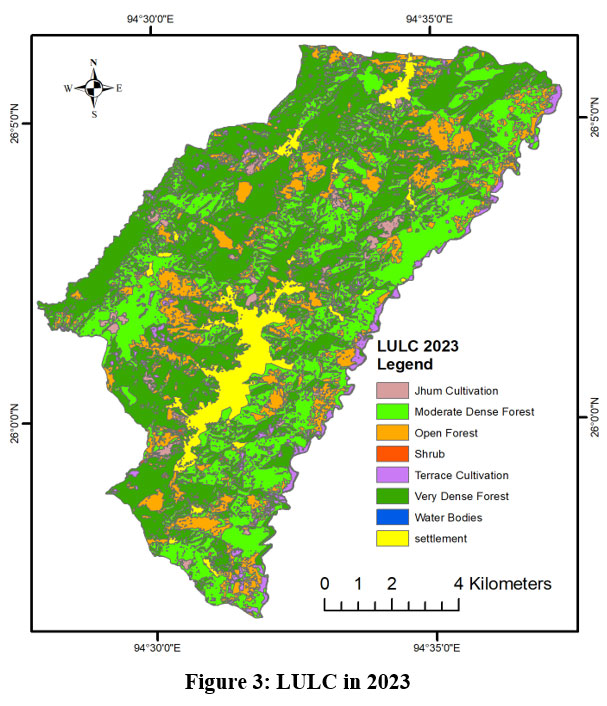 | Figure 3: LULC in 2023
|
Table 2: LULC patterns over the period of 2014–2023
Sl. No | Name | Area in Hectare 2014 | % Cover 2014 | Area in Hectare 2023 | % Cover 2023 |
1 | Jhum Cultivation | 667.83 | 5.41 | 211.29 | 1.71 |
2 | Moderately Dense Forest | 3155.69 | 25.58 | 3830.83 | 31.06 |
3 | Open Forest | 788.15 | 6.39 | 1664.98 | 13.50 |
4 | Settlement | 523.27 | 4.24 | 724.24 | 5.87 |
5 | Shrub | 42.67 | 0.35 | 20.33 | 0.16 |
6 | Terrace Cultivation | 419.97 | 3.40 | 282.11 | 2.29 |
7 | Very Dense Forest | 6678.05 | 54.14 | 5545.73 | 44.96 |
8 | Water Bodies | 59.14 | 0.48 | 55.28 | 0.45 |
Total | 12334.78 | 100 | 12334.78 | 100 |
Table 3: Criteria for evaluating Kappa statistics.
Sl No. | Kappa statistics | Strength of agreement |
1 | <0.00 | Poor |
2 | 0.00 - 0.20 | Slight |
3 | 0.21 - 0.40 | Fair |
4 | 0.41 - 0.60 | Moderate |
5 | 0.61 - 0.80 | Substantial |
6 | 0.81 - 1.00 | Almost perfect |
The Very Dense Forest area has been decreased from 6678.05 ha to 5545.72 ha i.e by 16.96%. The moderately dense forest has been increased from 3155.69 ha to 3830.82 ha. Open forest has been increased to 1664.97 ha from 788.15 ha. Terrace cultivation has been decreased from 419.97 ha to 282.11 ha. Jhum Cultivation has been decreased from 667.82 ha to 211.29 ha i.e by 68.36 %. Settlement has been increased from 523.27 ha to 724.24 ha by 38.41 %. Water bodies has been decreased from 59.14 ha to 55.28 ha i.e by 6.53 %. The shrub has been decreased to 20.33 ha from 42.67 ha i.e by 52.36 %.
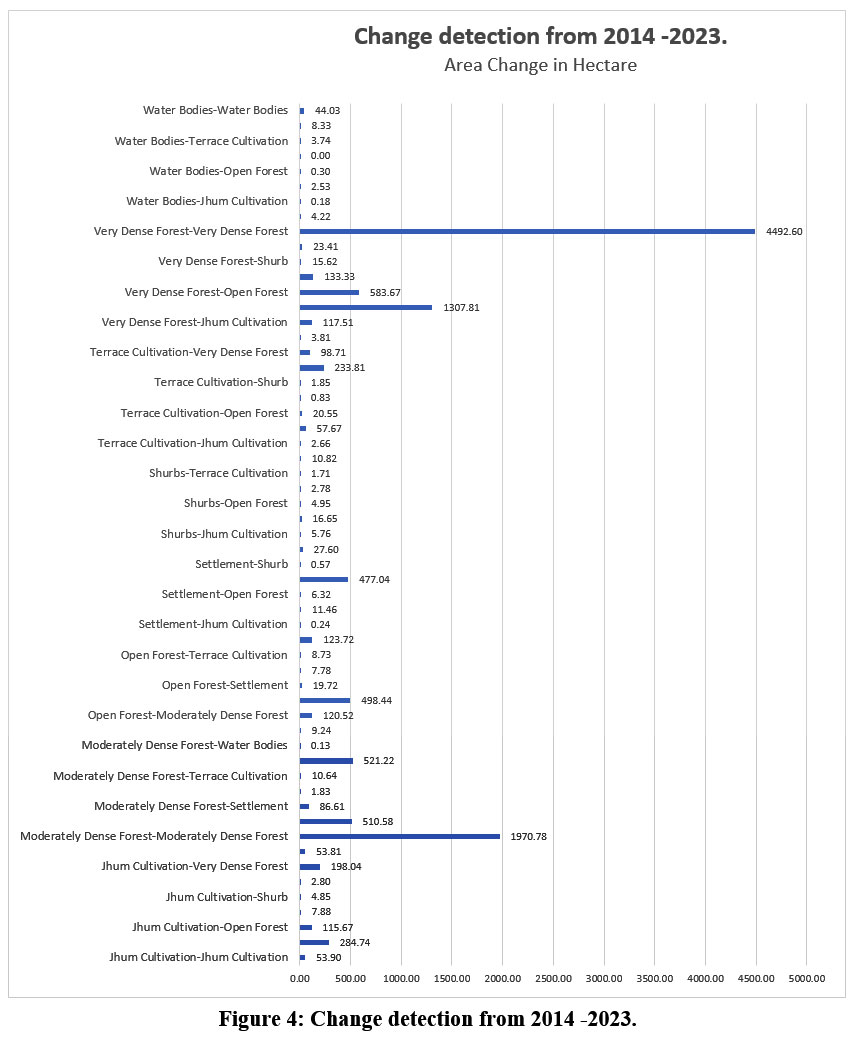 | Figure 4: Change detection from 2014 -2023.
|
The decline in Jhum and terrace cultivation from 2014 to 2023 in the area can be attributed due to the following reasons
Jhum cultivation is labor-intensive and time-consuming nature, which demands a collective effort from families and sometimes the entire community, especially given the region's hilly terrain and soil fertility and crop yield gets reduced over time.
With the implementation of National Food Security Act (NFSA), 2013 ensuring the availability of subsidised grains of food, such as wheat and rice at very low prices, many households in Northeast India may have reduced their reliance on self-grown crops.
The increase in settlements in the area can be linked to migration from rural to urban areas, as the district headquarters is the study area, which houses all the government offices, and has well-established educational institutions. Zunheboto experiences a pleasant summer, while in winter, temperatures drop below 15°C. During the colder months, residents typically burn firewood to keep warm. The rapid expansion of settlements has led to extensive use of timber for construction, contributing to deforestation. These rural to urban migration and the cold climate can be some of the reason in the decline of very dense forest from 2014 to 2023. The water bodies in the study area are mainly contributed by the rivers of Tizu and Langki flowing NE direction in right and left the side of the study area respectively. The shrub can be closely link with the jhum cultivation as it decreased substantially along with Jhum in 2023. The change in water bodies from 2014 to 2023 can be attributed to the drying up or shrinkage of ponds.
Accuracy assessment for both the classified map in figure 2 and figure 3 was done using the common Kappa accuracy assessment technique. 200 pixels were generated in both the maps for performing their accuracy test. The error matrix, Accuracy of producers and users’ accuracy for all classes detailing the LULC in 2023 and 2014 is presented in Table 4 and Table 5 respectively. In 2023, the Kappa Coefficient is 0.84, and in 2014, it is 0.75 indicating "almost perfect" classification for 2023 and Substantial classification for the year 2014 according to Table No. 3.
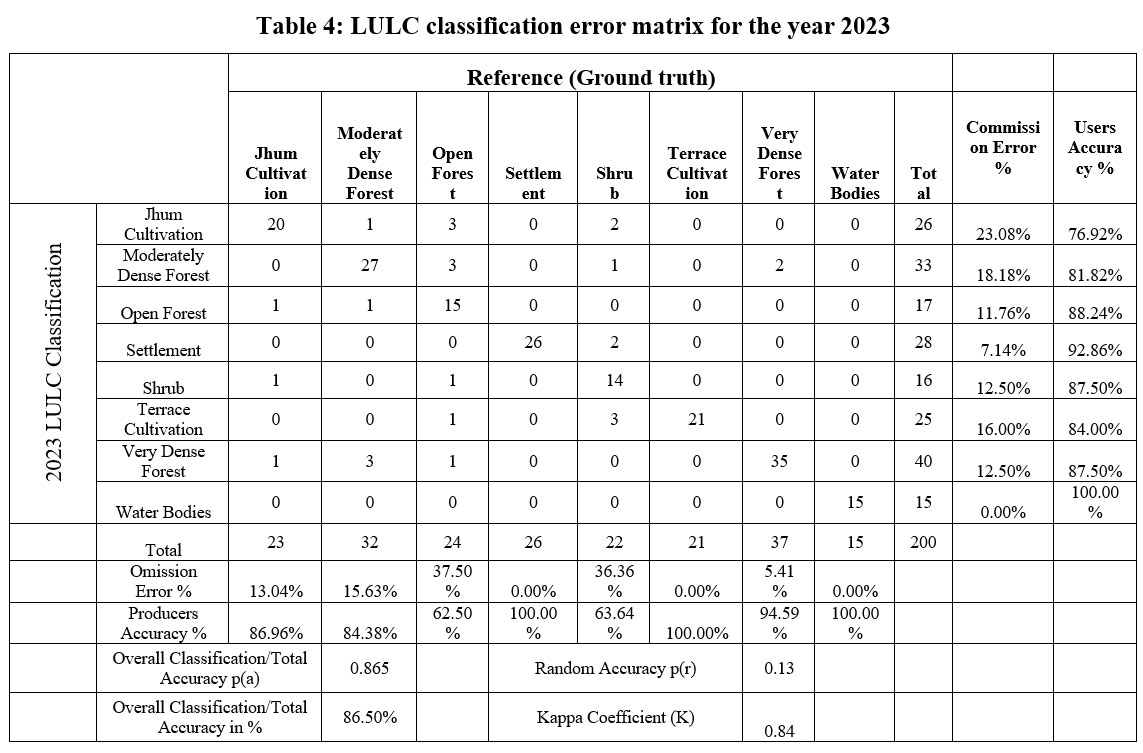 | Table 4: LULC classification error matrix for the year 2023
|
 | Table 5: LULC classification error matrix for the year 2014
|
According to the change detection statistics depicted in Figure 4, it is observed that 4492.60 hectares of the Very Dense Forest class remained unchanged from 2014 to 2023. Additionally, 1307.81 hectares and 583.67 hectares of Very Dense Forest have transitioned into Moderately Dense Forest and Open Forest, respectively. Moreover, 510.58 hectares of Moderately Dense Forest have undergone conversion to Open Forest. An expanse of 284.71 hectares, formerly designated for Jhum cultivation, has transitioned into Moderately Dense Forest, implying the cessation of Jhum cultivation in that area for an extended duration.
CONCLUSION AND RECOMMENDATION:
With increase in population aided by rural to urban migration, settlement area is rapidly expanding. The accuracy assessment carried out by using Kappa statistics shows overall classification accuracy or total accuracy of 86.50% and 78.50% in year 2023 and 2014 respectively. There is remarkable decrease in the Jhum cultivation practice by 68 %, which may due to reduced soil fertility and crop yield over time and implementation of National Food Security Act (NFSA), 2013. Deforestation is a matter of concern in the area, with notable increase of 111% in Open Forest, primarily attributed to the conversion from Moderately Dense Forest and Very Dense Forest and be link to the increase in settlements.
Planners, decision-makers, and various conservation and management groups are anticipated to use this map displaying LULC to effectively plan and conserve land in the area. Particularly significant is its ability to illustrate the occurrence of landslides, human land use, categorized as anthropogenic activity, exerts a notable influence on elevating the probability of landslides. To restore forests degraded by Jhum cultivation, it is recommended to plant more trees in regions where Jhum cultivation is no longer practiced.
Acknowledgment
The author would like to express their gratitude to the University of Mysore for granting the PhD research opportunity. Special thanks go to the chairman of the Department of Studies in Earth Science for facilitating the research process and providing access to necessary resources.
Funding Sources
There is no funding or financial support for this research work.
Conflict of Interest
There is no conflict of intrest in this paper.
Data Availability Statement
The author has all the data and ready to share.
Ethics Approval Statement
No experiments were performed on human and animals.
Authors Contribution
Khekuto Kiho: The first author. Preformed Land use and Land cover classification for both the satellite images of the year 2013 and 2023. Field visit, and made the change detection matrix and writing the paper.
Asha Manjari K.G: Brought the idea. Downloaded the Satellite Imagery and did the image processing and preformed the accuracy assessment.
Paolenmang Haokip: Preparing location maps, Arrangement of text and plagiarism correction
References
- Guan D, Li H, Inohae T, Su W, Nagaie T, Hokao K. Modeling urban land use change by the integration of cellular automaton and Markov model. Ecological modelling. 2011;222(20-22):3761-3772.
CrossRef - Kithan LN. Indigenous system of Paddy cultivation in Terrace and Jhum fields among the Nagas of Nagaland. International Journal of Scientific and Research Publications. 2014;4(3):1-4.
- Jamir C. Population, poverty and environmental degradation in Nagaland. European Journal of Social Impact and Circular Economy. 2021;2(2):40-58.
- Weng Q. A remote sensing-GIS evaluation of urban expansion and its impact on surface temperature in the Zhujiang Delta, China. International journal of remote sensing. 2001;22(10):999-2014.
CrossRef - Huang C, Goward SN, Masek JG, Thomas N, Zhu Z, Vogelmann JE. An automated approach for reconstructing recent forest disturbance history using dense Landsat time series stacks. Remote Sensing of Environment. 2010;114(1):183-198.
CrossRef - Singh A. Digital change detection techniques using remotely-sensed data 1989. Int. J. Remote Sensing. 1990;10(6):989-100.
CrossRef - Jansen LJ, Di Gregorio A. Parametric land cover and land-use classifications as tools for environmental change detection. Agriculture, ecosystems & environment. 2002 :91(1-3):89-100.
CrossRef - Acharya TD, Yang I. Exploring landsat 8. International Journal of IT, Engineering and Applied Sciences Research (IJIEASR). 2015;4(4):4-10.
- Menzel WP, Purdom JF. Introducing GOES-I: The first of a new generation of geostationary operational environmental satellites. Bulletin of the American Meteorological Society. 1994; 75(5):757-782.
CrossRef - Richards JA, Remote sensing digital image analysis: an introduction Vol. 5. Sixth Edition. Berlin/Heidelberg, Germany: springer, 2022.
- Scorer RS. Cloud reflectance variations in channel-3. International Journal of Remote Sensing. 1989;10(4-5):675-686.
CrossRef - India state of forest report. Dehradun; Forest Survey of India. 2021. https://fsi.nic.in/scheme-of-classification.
- Lu D, Weng Q. Urban classification using full spectral information of Landsat ETM+ imagery in Marion County, Indiana. Photogrammetric Engineering & Remote Sensing. 2005;71(11):275-1284.
CrossRef - Ramakrishnan PS. Shifting cultivation and sustainable development: an interdisciplinary study from North-eastern India. Volume 10. New York: Oxford University Press, 1992.
- Toutin T. Geometric processing of remote sensing images: models, algorithms and methods. International journal of remote sensing. 2004;25(10):893-1924.
CrossRef - Chen X, Vierling L, Deering D. A simple and effective radiometric correction method to improve landscape change detection across sensors and across time. Remote Sensing of Environment. 2005;98(1):63-79.
CrossRef - Landis, J.R. and Koch, G.G. A One-Way Components of Variance Model for Categorical Data. Biometrics.1977;33(4): 671-679.
CrossRef


