Analysis of Pre-monsoon and Post-monsoon Seasonal Rainfall Trends by Mann-Kendall and Sen’s Slope Estimator Test in Himachal Pradesh, India.
Aman Kumar
*
 and Pawan Kumar Attri
1
Department of Interdisciplinary Studies,
School of Environmental Sciences,
Himachal Pradesh University,
Summer Hill. Shimla,
Himachal Pradesh
India
http://dx.doi.org/10.12944/CWE.19.2.37
Copy the following to cite this article:
Kumar A, Attri P, K. Analysis of Pre-monsoon and Post-monsoon Seasonal Rainfall Trends by Mann-Kendall and Sen’s Slope Estimator Test in Himachal Pradesh, India. Curr World Environ 2024;19(2). DOI:http://dx.doi.org/10.12944/CWE.19.2.37
Copy the following to cite this URL:
Kumar A, Attri P, K. Analysis of Pre-monsoon and Post-monsoon Seasonal Rainfall Trends by Mann-Kendall and Sen’s Slope Estimator Test in Himachal Pradesh, India. Curr World Environ 2024;19(2).
Download article (pdf)
Citation Manager
Publish History

Introduction
The analysis of precipitation trends has been a major focus in the past century due to scientific interest in global climate change. The data suggests a little overall increase on a worldwide scale, although there are significant regions that are experiencing a decrease in trends.1 Accurately predicting these patterns may have a major influence on a nation's economic growth since precipitation levels significantly impact crop choices and ecological changes.
Effective water resource management is essential for several aspects of development, including food production and flood control. This is particularly important owing to the global surface warming, which has been seen to increase at a pace of 0.74 ± 0.18 °C during 1906-2005.2 Using long-term data, a number of researchers have made significant contributions to the field of climate change research.3-5 An analysis of time series data reveals a discernible pattern of either declining or rising temperatures and rainfall. This tendency is attributed to human activities, particularly agricultural and irrigation practices, which have a direct impact on land usage and contribute to climate change.6
The analysis of severe rainfall patterns in India between 1901 and 2000 indicated a notable increase in most indices along the western coast and northwestern regions of the peninsula.7 The frequency of heat stress, drought, and flooding disasters is projected to increase over the century, with a disproportionate impact on the water, agricultural, and food security sectors.8 Bhutiyani et al., (2008) conducted research that analysed discharge data and found an increase in high-magnitude flood occurrences in the northwest Himalayas over the last thirty years.9 India's summer monsoon precipitation has experienced a 6% decline from 1951 to 2015, namely in the Western Ghat area and in the Indian Gangetic Plains area. The increase in human-caused aerosol forcing in the Northern Hemisphere has counteracted the anticipated rise in precipitation because of greenhouse gas warming, in the observed resulting decrease in summer monsoon precipitation.10 In their study, Sadhukhan et al., (2000) examined the rainfall patterns during the before monsoon season (March to May; MAM) from 1901-1992 in West Bengal and its surrounding areas. However, they did not see any significant long-term trends in the data.11 El Nino (La Nina) years saw less rain than usual in southern peninsular India after the monsoons.12
The Himalayan system possesses a distinct climate that exerts a substantial influence on both the Indian subcontinent and the Tibetan plateau. The mountain range serves as an obstacle, impeding the movement of frigid, arid winds from the Arctic region into the southern direction, so maintaining a relatively higher temperature on the subcontinent compared to other continents. This barrier further serves to obstruct the monsoon winds, therefore preventing excessive rainfall in the Himalayan foothill area. 13 It also hinders the western disturbances from reaching Iran, leading to snowfall in Kashmir and Himachal Pradesh, as well as rainfall in Punjab. Nevertheless, the study conducted by Pant et al., (1999) demonstrated a noticeable rise in post-monsoon rainfall in the western Himalayan area, which is in direct opposition to a decline in winter precipitation.14
The Himalaya, renowned for its rich biodiversity and its crucial role in providing global ecosystem services, experiences more pronounced climate change effects compared to other places, including other biodiversity hotspots. Based on a study conducted by the India Meteorological Department, the mountainous Indian states of Uttarakhand and Himachal Pradesh have had a 61 mm and 79 mm drop, respectively, in their monsoon rainfall, over the course of the past century.15 This decrease in rainfall suggests the presence of climate change, even in the absence of climate monitoring stations. Mountains are ecosystems that are very vulnerable to both natural and human-induced disturbances.16-19 A substantial decline in winter precipitation in the north-western area over the period of December to February from 1975 to 2006.20 Guhathakurta and Rajeevan (2008) observed a substantial decline in winter rainfall (January-February) in the Jammu, Kashmir, and Ladakh area between 1901 and 2003.21
The impacts of global warming in Himachal Pradesh are evident via phenomena such as less snowfall, receding glaciers, and the expansion of the temperate fruit belt to higher altitudes. These variables adversely affect the apple crop output, shorten the duration of the rabi season, and disrupt the usual rainfall patterns. The highlands receive substantial snowfall throughout the year, with the exception of the southwest monsoon season. The range of snowfall in winter is between 2 and 130 cm, while the number of days with snowfall is from 2 to 23.22 Climate change is believed to impact the Himalayan region, leading to changes in both annual and summer monsoon precipitation. A comprehensive study has been conducted by researchers to examine the long-term distribution of rainfall in the Himalayan area.14,23-28 Several studies have documented favourable changes in precipitation patterns in certain areas, such as Sharma et al., (2000) in Nepal's Kosi basin and Kumar et al., (2005) in India's Himachal Pradesh state.25,28
The present adverse climate shifts require the recognition and understanding of viable adaption techniques to capture the public's attention. Examining the data series over an extended period of time is employed to forecast the impact of climatic variations. As the awareness of the potential negative effects of global climate change increases. This study investigates the trend in precipitation in order to assess the geographical distribution of rainfall patterns before and after the monsoon season in Himachal Pradesh.
Materials and methods
Study Area
Himachal Pradesh, the northernmost state of India, shares a minor border with Uttar Pradesh and is situated adjacent to Punjab, Haryana, Uttarakhand, Jammu & Kashmir, and Ladakh. Furthermore, it shares an international boundary with the Tibet Region of China. The state is located within the latitudinal range of 30°22'N to 33°12'N and the longitudinal range of 75°47'E to 79°04'E. It occupies an area of 55,673 square kilometres. Himachal Pradesh is an Indian state that is distinguished by its diverse climate and mountain ranges. The eastern and northern regions are traversed by the formidable Himalayan range, while the northeastern Zanskar range extends. The central regions of Himachal Pradesh are characterised by the Dhauladhar and Pir Panjal mountains, while the southern and western regions are characterised by the Shivalik range. The climate in the southern regions is subtropical, hot, and humid, while in the northern and eastern mountainous regions, it is frigid, alpine, and glacial. The state experiences three distinct seasons: summer, winter, and a damp season. The summer season runs from mid-April to the end of June, with temperatures that vacillate between 28 and 32°C (82 and 90°F). 22
Table 1: Location of the study area
S.N. | Area of Study | District | Direction | Latitude | Longitude | Sea level height(m) |
1 | Dharamshala | Kangra | North-west Himachal | 32.219°N | 76.323°E | 1457m |
2 | Una | Una | West Himachal | 31.468°N | 76.270°E | 369m |
3 | Sundernagar | Mandi | Central Himachal | 31.529°N | 76.888°E | 900m |
4 | Solan | Solan | South Himachal | 30.908°N | 77.099°E | 1550m |
5 | Nahan | Sirmaur | South Himachal | 30.559°N | 77.295°E | 932m |
6 | Shimla | Shimla | South-east Himachal | 31.104°N | 77.173°E | 2276m |
7 | Manali | Kullu | Central Himachal | 32.243°N | 77.189°E | 2050m |
8 | Kalpa | Kinnaur | East Himachal | 31.537°N | 78.275°E | 2960m |
9 | Keylang | Lahaul and Spiti | North Himachal | 32.571°N | 77.032°E | 3080m |
10 | Bharmour | Chamba | North Himachal | 32.442°N | 76.532°E | 2100m |
11 | Ghumarwin | Bilaspur | West Himachal | 31.449°N | 76.704°E | 700m |
12 | Hamirpur | Hamirpur | West Himachal | 31.690°N | 76.517°E | 786m |
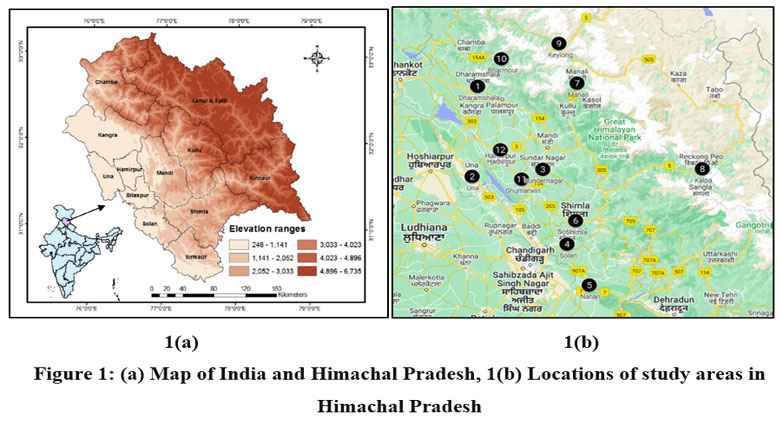 | Figure 1: (a) Map of India and Himachal Pradesh, 1(b) Locations of study areas in Himachal Pradesh
|
Data base and sources
Trend analysis necessitates a substantial amount of time-series data to demonstrate alterations in climatic patterns, as well as trends in rainfall and temperature. The monthly rainfall data from 1991-2020 was taken from 12 rain stations in Himachal Pradesh, India. Each District is covered by one station. Most of these stations are headquarters of the district. The data was received from the Indian Meteorological Department (IMD) in New Delhi and the Shimla Centre.
According to the IMD Shimla research centre, the seasonal study was carried out by dividing each year into four distinct periods: the winter season, which lasted from December to March; the before the monsoon season, which lasted from April to May; the period from June to September during which monsoons occur; and the post-monsoon season, which lasted from October to November.
Mann-Kendall test
This Test assesses whether a time series rises or falls monotonically. There is no requirement for the data to have a normal distribution or to be linear. Autocorrelation must be absent. This test, developed by Mann (1945), is a non-parametric method used for trend detection. The test statistic distribution for non-linear trends and turning points was presented by Kendall (1975).29,30
Hypothesis of null for this test assumes the lack of a trend, while the alternative hypothesis predicts a two-sided or one-sided trend. To assess time series x1,..., xn, Here's the statistic that the MK Test utilises:
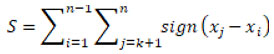
It should be noted that if the value of S is more than 0, subsequent observations in the time series are often bigger than earlier ones, and if S is less than 0, the opposite is true.
The variance of S is determined by
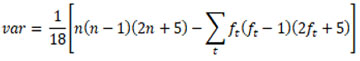
Let t be a variable that spans the set of tied rankings. The frequency, shown as ft, and rank t represents the number of occurrences.
The subsequent statistic is implemented in MK Tests:
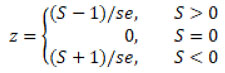
Let se represent the square root of var. For time series containing more than 10 items, the null hypothesis states that there is no monotonic trend, the variable z follows a typical normal distribution, denoted as z - N (0, 1).
Sen’s Slope estimator test
Sen (1968) devised a nonparametric method for determining the slope of a trend in a dataset consisting of n pairs of observations. A least-squares estimate is the conventional approach for calculating the slope of a regression line that properly reflects (x, y) data points. This method is very susceptible to outliers and does not work when the data pieces do not follow a linear relationship.31
Sen's slope, a more precise nonparametric slope measure, is now presented for the collection of pairs (i, xi) with time series xi. As mentioned, Sen's slope
An interval estimates for the slope of Sen's estimator, with a confidence level of 1-a, may be computed as (lower, higher).
If i is smaller than j, then there is a total of N possible combinations of time series components (xi, xj). The Mann-Kendall test's standard error is denoted as se. In addition, mh stands for the hth minimum value in the set {(xj-xi)/(j-i): i < j}, zcrit is the crucial value for the regular distribution at a 1-a/2 significance level.
Simple Linear Regression Analysis
Y = mX + c represents the "simple linear regression" method, where Y is rainfall, X is the period in years, m are slope coefficients, and c are intercept least square estimates. A positive slope implies a rising tendency, whereas a negative slope suggests a falling trend.
Results and Discussion
Pre-monsoon Rainfall
Significant regional differences in pre-monsoon precipitation patterns in Himachal Pradesh have been shown by estimator Sen's slope test and the Mann-Kendall (MK) test. Table number 2 shows no significant trends, except for Keylong, where the Mann-Kendall test detected negative trends. Table number 2 shows the result of Sen’s Slope test revealed increasing pre-monsoon season trends at Dharamshala (0.3mm), Una (0.98mm), Sundernagar (0.255mm), Solan (1.228mm), Nahan (0.9mm), Shimla (0.38mm), Manali (1.471mm), and Ghumarwin (0.483mm). Among these, Manali had the highest increasing trend at Sen's Slope (1.471mm). On the other hand, Kalpa (-0.471mm), Keylong (-4.154mm), Bharmour (-0.344mm), and Hamirpur (-0.25mm) showed decreasing annual trends. Keylong had the strongest downward trend at Sen's Slope (-4.154mm). Figure 2 presents the examination of temporal data during the pre-monsoon season. Twelve areas' average rainfall data from 1991 to 2020 were examined using estimator Sen's slope test and basic linear trend analysis.
Table 2: Trend Analysis for Pre-monsoon Season from1991-2020.
AREA | OBSERV-ATION | MINIMUM RAINFALL (mm) | MAXIMUM RAINFALL (mm) | MEAN RAINFALL | STD. DEVIATION | MANN-KENDALL STATISTIC(S) | KENDALL’S TAU | VAR(S) | P-VALUE (TWO TAILED TEST) | ALPHA | SEN SLOPE | TEST INTERPRETATION |
Dharamshala | 30 | 25.8 | 342.8 | 145.2 | 75.2 | 15 | 0.034 | 3141.6 | 0.803 | 0.05 | 0.30 | ACCEPT H0 |
Una | 30 | 9.6 | 153.0 | 51.9 | 34.6 | 107 | 0.246 | 3141.6 | 0.059 | 0.05 | 0.980 | ACCEPT H0 |
Sundernagar | 30 | 38.5 | 249.0 | 128.2 | 57.4 | 5 | 0.011 | 3141.6 | 0.943 | 0.05 | 0.255 | ACCEPT H0 |
Solan | 30 | 16.4 | 182.8 | 81.3 | 44.5 | 61 | 0.140 | 3141.6 | 0.284 | 0.05 | 1.228 | ACCEPT H0 |
Nahan | 30 | 5.4 | 128.3 | 62.0 | 34.9 | 50 | 0.115 | 3141.6 | 0.382 | 0.05 | 0.900 | ACCEPT H0 |
Shimla | 30 | 38.1 | 313.6 | 138.8 | 63.1 | 17 | 0.039 | 3141.6 | 0.775 | 0.05 | 0.380 | ACCEPT H0 |
Manali | 30 | 34.1 | 365.5 | 151.3 | 87.8 | 45 | 0.103 | 3141.6 | 0.432 | 0.05 | 1.471 | ACCEPT H0 |
Kalpa | 30 | 27.3 | 259.5 | 118.4 | 54.9 | -23 | -0.053 | 3141.6 | 0.695 | 0.05 | -0.471 | ACCEPT H0 |
Keylang | 30 | 8.0 | 297.0 | 108.8 | 73.1 | -160 | -0.369 | 3141.6 | 0.005 | 0.05 | -4.154 | REJECT H0 |
Bharmour | 30 | 32.3 | 433.0 | 142.7 | 76.3 | -11 | -0.025 | 3141.6 | 0.858 | 0.05 | -0.344 | ACCEPT H0 |
Ghumarwin | 30 | 0.0 | 188.6 | 68.9 | 54.3 | 15 | 0.035 | 3141.6 | 0.803 | 0.05 | 0.483 | ACCEPT H0 |
Hamirpur | 30 | 0.0 | 208.0 | 76.6 | 53.5 | -13 | -0.030 | 3141.6 | 0.830 | 0.05 | -0.250 | ACCEPT H0 |
Between 1991 and 2020, the highest recorded rainfall at twelve stations was as follows: Dharamshala received 342.8mm in 2016, Una received 153mm in 2001, Sundernagar received 249mm in 1997, Solan received 182.8mm in 1999, Nahan received 128.3mm in 2020, Shimla received 313.6mm in 1997, Manali received 365.5mm in 1994, Kalpa received 259.5mm in 2010, Keylang received 297mm in 1991, Bharmour received 433mm in 1994, Ghumarwin received 188.6mm in 1998, and Hamirpur received 208mm in 1997. On the other hand, the lowest recorded rainfall at these stations was as follows: Dharamshala received 25.8mm in 2005, Una received 9.6mm in 1995, Sundernagar received 38.5mm in 2013, Solan received 16.4mm in 2005, Nahan received 5.4mm in 2013, Shimla received 38.1mm in 2013, Manali received 34.1mm in 2007, Kalpa received 27.3mm in 2000, Keylang received 8mm in 2019, Bharmour received 32.3mm in 2008, Ghumarwin did not receive any rainfall in 2008 and 2014, and Hamirpur did not receive any rainfall in 2007.
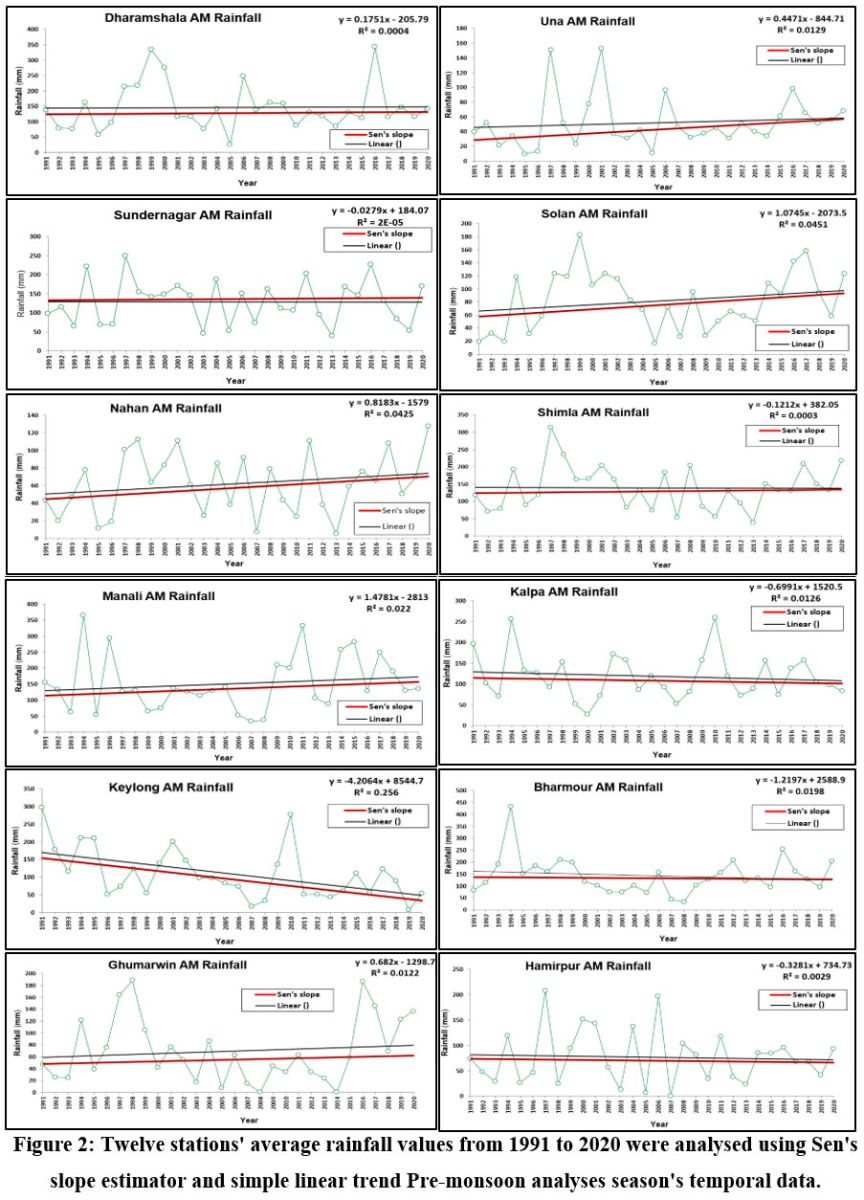 | Figure 2: Twelve stations' average rainfall values from 1991 to 2020 were analysed using Sen's slope estimator and simple linear trend Pre-monsoon analyses season's temporal data.
|
Post-monsoon Rainfall
After the monsoon rainfall season, estimator Sen's slope and the Mann-Kendall test were used to identify significant regional variations in trends in Himachal Pradesh. Table number 3 results showed that there were no significant trends, except in Manali where positive trends were seen as determined by the Mann-Kendall test. Following after the monsoon, outcomes of the Sen's Slope test indicated a notable upward trend at Una (0.289mm), Sundernagar (0.192mm), Solan (0.37mm), Nahan (0.758mm), Shimla (0.206mm), Manali (1.771mm), Kalpa (0.282mm), Bharmour (0.391mm), Ghumarwin (0.0mm), and Hamirpur (0.017mm). Among these, Manali had the highest increasing trend with a value of 1.771mm. On the other hand, Dharamshala showed decreasing post-monsoon trends with a Sen's Slope value of -0.042mm. Figure 3 presents an examination of temporal data during the post-monsoon season. Twelve areas' average rainfall data from 1991 to 2020 were examined using estimator Sen's slope and linear basic trend analysis.
Table 3: Trend Analysis for Post-monsoon Season from 1991-2020.
AREA | OBSERV-ATION | MINIMUM RAINFALL (mm) | MAXIMUM RAINFALL (mm) | MEAN RAINFALL | STD. DEVIATION | MANN-KENDALL STATISTIC(S) | KENDALL’S TAU | VAR(S) | P-VALUE (TWO TAILED TEST) | ALPHA | SEN SLOPE | TEST INTERPRETATION |
Una | 30 | 0.0 | 162.8 | 27.3 | 35.6 | 58 | 0.137 | 3097.3 | 0.306 | 0.05 | 0.289 | ACCEPT H0 |
Sundernagar | 30 | 0.1 | 134.4 | 29.4 | 35.9 | 22 | 0.051 | 3140.6 | 0.708 | 0.05 | 0.192 | ACCEPT H0 |
Solan | 30 | 0.0 | 106.6 | 21.8 | 26.5 | 67 | 0.156 | 3125.0 | 0.238 | 0.05 | 0.370 | ACCEPT H0 |
Nahan | 30 | 0.0 | 266.3 | 43.1 | 62.8 | 79 | 0.184 | 3125.0 | 0.163 | 0.05 | 0.758 | ACCEPT H0 |
Shimla | 30 | 1.9 | 236.1 | 41.6 | 55.1 | 26 | 0.060 | 3140.6 | 0.656 | 0.05 | 0.206 | ACCEPT H0 |
Manali | 30 | 0.0 | 208.6 | 58.5 | 58.6 | 115 | 0.265 | 3139.6 | 0.042 | 0.05 | 1.771 | REJECT H0 |
Kalpa | 30 | 0.0 | 303.0 | 39.1 | 65.8 | 53 | 0.122 | 3141.6 | 0.354 | 0.05 | 0.282 | ACCEPT H0 |
Keylang | 30 | 0.0 | 75.0 | 24.2 | 22.3 | 1 | 0.002 | 3135.0 | 1.000 | 0.05 | 0.000 | ACCEPT H0 |
Bharmour | 30 | 0.0 | 220.4 | 38.6 | 48.1 | 46 | 0.106 | 3140.6 | 0.422 | 0.05 | 0.391 | ACCEPT H0 |
Ghumarwin | 30 | 0.0 | 243.1 | 30.4 | 48.2 | 27 | 0.064 | 3076.3 | 0.639 | 0.05 | 0.000 | ACCEPT H0 |
Hamirpur | 30 | 0.0 | 148.4 | 25.4 | 36.5 | 57 | 0.140 | 2975.6 | 0.305 | 0.05 | 0.017 | ACCEPT H0 |
Between 1991 and 2020, the highest rainfall recorded in the post-monsoon season at twelve stations were as follows: Dharamshala received 295.6mm in 1998, Una received 162.8mm in 2004, Sundernagar received 134.4mm in 1997, Solan received 106.6mm in 2004, Nahan received 266.3mm in 2008, Shimla received 236.1mm in 1997, Manali received 208.6mm in 2009, Kalpa received 303mm in 2000, Keylang received 75mm in 1993, Bharmour received 220.4mm in 1997, Ghumarwin received 243.1mm in 1996, and Hamirpur received 148.4mm in 2004. On the other hand, the lowest rainfall recorded at these stations were as follows: Sundernagar received 0.1mm in 2011, Shimla received 1.9mm in 2000, Dharamshala did not receive any rainfall in 2007 and 2017, Una did not receive any rainfall in 1991, 1994, 1999, 2000, 2001, 2005, and 2016, Solan did not receive any rainfall in 1992, 2001, 2005, 2011, and 2016, Nahan did not receive any rainfall in 2003, 2004, 2000, 2005, and 2017, Manali did not receive any rainfall in 1991 and 2005, Kalpa did not receive any rainfall in 1991, Keylang did not receive any rainfall in 2005, Bharmour did not receive any rainfall in 1991 and 2005, Ghumarwin did not receive any rainfall in 1993, 1995, 1999, 2005, 2007, 2011, 2016, and 2020, and Hamirpur did not receive any rainfall in 1991, 1993, 1994, 1995, 1999, 2000, 2005, 2007, 2011, 2014, and 2017.
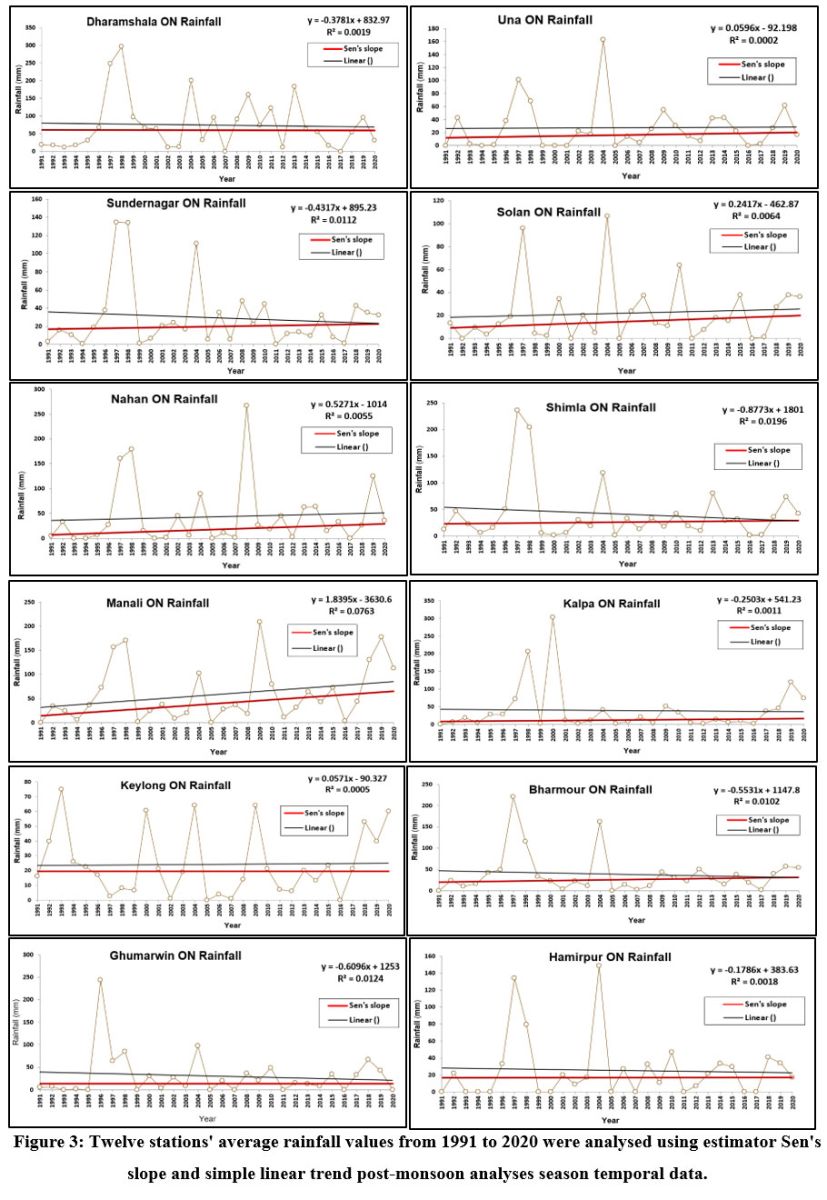 | Figure 3: Twelve stations' average rainfall values from 1991 to 2020 were analysed using estimator Sen's slope and simple linear trend post-monsoon analyses season temporal data.
|
In the initial stages of this study's analysis, we computed the following: mean, standard deviation, Kandell's tau, p-value (two-tailed test), Mann-Kendall statistic (S), Sen slope, Var(S), Alpha and we examined the data in the precipitation time series for every station before and after the monsoon. The findings are displayed in tables 2 and 3, correspondingly. Tables 2 and 3 present the statistical properties for the 30-year duration being studied, which covers the years 1991 to 2020. The study analyses the seasonal precipitation data collected from twelve locations in Himachal Pradesh to evaluate the patterns and fluctuations of rainfall between seasons. The patterns were evaluated statistically using the Mann-Kendall test. The experiment was carried out with a confidence level of 95%. Statistically insignificant changes below 95% were considered negligible.
Premonsoon rains occur in the northwest regions of India and central Pakistan because semi-permanent heat lows emerge in those regions throughout the summer.32 Surface air temperatures have been rising since 1971, especially in the months of March to May, suggesting that convective heating is intensifying across the area between 24.8°N and 37.8°N and 68.8°E and 89.8°E. The Indian peninsula, western India, the Indo-Gangetic Plain, and northwest Rajasthan are all part of this area.33 The findings of the study align with these observed trends. Kothawale et al., 2010, have also reported similar data, indicating a growing tendency towards scorching days and nights over the entirety of India.34 Furthermore, a notable shift in surface winds occurs throughout May. From the Indian Ocean, these winds transport unstable, warm, and humid air to the Indian Peninsula. This change is influenced by the contrast in temperature between the land and sea. Importantly, it sets the stage for the subsequent months of large-scale monsoon circulation throughout the whole subcontinent.32 Recent research has shown that there is a growing number of aerosols in the pre-monsoon months, which is affecting the rainfall during the Indian Summer Monsoon.35-37 The aerosol particle load rises throughout the pre-monsoon season, according to research by Lau et al. (2006); May is the peak month for this increase over the Indo Gangetic Plains, Northwest India, and the entirety of the country.36
According to this study Pre-monsoon precipitation in the northern high Himalayan areas has decreased, while there has been a slightly increase in rainfall in the all-study areas expect Kalpa, Keylong, Bharmour and Hamirpur. In case of post-monsoon season Dharmshala station show decreasing trends and other all station shown increasing trends. There are more shifting patterns (Sen's Slope) during the before monsoon season, as seen in Figure 2, compared to the after-monsoon season, which is depicted in Figure 3. An optimal pre-monsoon season leads to a rise in agricultural output, hence stabilising grain prices, which is advantageous for farmers engaged in fruit production. Adequate precipitation during the pre-monsoon period enables farmers to promptly begin their preparations for the upcoming monsoon season. In Himachal Pradesh, the post-monsoon seasonal rainfall plays a crucial role in providing a low temperature for winter snowfall, which is essential for horticulture and agriculture.
Conclusion
This article analysed the periods before and after the monsoon season at twelve different sites in Himachal Pradesh during a thirty-year period from 1991 to 2020. A continuous rise in rainfall amounts is shown by both the Mann-Kendall and estimator Sen's Slope tests, which are applied across all areas. At a variety of sites, both positive and negative trends were detected simultaneously. The biggest negative trend may be seen in Keylang before the monsoon season begins, Manali experiences the most increase in favourable trends after the monsoon season. Both the trend analysis and regression analysis yield similar results for the majority of the research area. Variability of positive and negative trends at different stations indicates the need for more in-depth research on the region's climate change; in order to effectively manage water resources and plan agricultural activities, it is essential to comprehend the temporal patterns of rainfall trends, which this study examined.
Acknowledgements
We appreciate the support provided by Indian Meteorological Department (IMD) in New Delhi, Shimla Centre.
Funding Sources
The author(s) received no financial support for the research, authorship, and/or publication of this article.
Conflict of Interest
The author(s) declares no conflict of interest.
Author contributions
Aman Kumar: writing original draft and formal analysis; Pawan Kumar Attri: writing original draft and formal analysis.
Data Availability
The manuscript incorporates all datasets produced or examined throughout this research study from the Indian Meteorological Department (IMD) in New Delhi and the Shimla Centre.
Ethics Approval Statement
There is no experiment on humans or animals.
References
- Houghton J.T, Meira F, L.G, Callander B.A, Harris N, Kattenberg A, Maskell K. (eds). Climate change. Cambridge University Press: New York. IPCC ;1996. The IPCC Second Assessment Report.
- Parry M.L, Canziani O.F, Palutikof J.P, Linden P.J. van der, Hanson C.E, (eds.). Climate Change 2007: Impacts, Adaptation and Vulnerability. Cambridge University Press, Cambridge, UK: IPCC; 2007: Contribution of Working Group II to the Fourth Assessment Report of the Intergovernmental Panel on Climate Change/976pp.
- Dessens J, Bucher A. Changes in minimum and maximum temperatures at the Pic du Midi relation with humidity and cloudiness, 1882–1984. Atmospheric Research. 1995; 37:147–162.
CrossRef - Serra C, Burgueno A, Lana X. Analysis of maximum and minimum daily temperatures recorded at Fabra observatory (Barcelona, NE Spain) in the period 1917–1998. International Journal of Climatology. 2001; 21: 617–636. https://doi.org/10.1002/joc.633
CrossRef - Marengo J.A. Interdecadal variability and trends of rainfall across the Amazon basin. Theoretical and Applied Climatology. 2004; 78:79–96.
CrossRef - Kalnay E, Cai M. Impact of urbanization and land-use change on climate. Nature. 2003;423: 528–531. https://doi.org/10.1038/nature01675
CrossRef - Ravindranath N.H, Joshi N.V, Sukumar R. Impact of climate change on forests in India. Curr. Sci. 2006; 90 (3): 354–361. https://www.researchgate.net/publication/2183030
- Field C.B, Barros V, Stocker T.F, Qin D, Dokken D.J, Ebi K.L, Mastrandrea M.D, Mach K.J, Plattner G.K, Allen S.K, Tignor M, Midgley P.M. (eds.). Managing the Risks of Extreme Events and Disasters to Advance Climate Change Adaptation. Cambridge University Press, Cambridge, UK: IPCC; 2012: A Special Report of Working Groups I and II of the Intergovernmental Panel on Climate Change /582 pp.
- Bhutiyani M. R, Kale V. S, Pawar, N. J. Changing stream flow pattern in the rivers of north-western Himalaya: Implications of global warming in the 20th century. Curr. Sci. India. 2008; 95: 703-708.
- Krishnan R, Sanjay J, Gnanaseelan C, Mujumdar M, Kulkarni A, Chakraborty S. Assessment of Climate Change over the Indian Region. A Report of the Ministry of Earth Sciences (MoES), Government of India; 2021. https://doi.org/10.1007/978-981-15-4327-2
CrossRef - Sadhukhan I, Lohar D, Pal D.K. Premonsoon season rainfall variability over Gangetic West Bengal and its neighbourhood, India. Int. J. Climatology. 2000; 20(12): 1485-1493.
CrossRef - Khole M, De U.S. A study on north-east monsoon rainfall over India. Mausam. 2003;54(2): 419-426. https://doi.org/10.54302/mausam.v54i2.1527
CrossRef - Sabin T.P, Krishnan R, Vellore R, Priya P, Borgaonkar H. P, Singh B. B, Sagar A. Climate Change Over the Himalayas. Krishnan R, Sanjay J, Gnanaseelan C, Mujumdar M, Kulkarni A, Chakraborty S. Assessment of Climate Change over the Indian Region. Singapore: Springer Nature Singapore Pte Ltd;2020: 207-222. https://doi.org/10.1007/978-981-15-4327-2
CrossRef - Pant G.B, Rupa Kumar K, Borgaonkar H.P. Climate and its long-term variability over the western Himalaya during the past two centuries. New Age International (P) Ltd., Publishers: New Delhi. The Himalayan Environment;1999. 171–184.
- Guhathakurta P, Rajeevan M. Trends in the rainfall pattern over India. India Meteorological Department. Research Report No., 2/2006. pp 23.
- Negi V. S, Maikhuri R. K, Maletha A, Phondani P. C. Ethnobotanical knowledge and population density of threatened medicinal plants of Nanda Devi Biosphere Reserve, Western Himalaya, India. Iranian Journal of Science and Technology, Transactions a: Science. 2019;43(1): 63–73. https://doi.org/10.1007/s40995-018-0545-5
CrossRef - Romeo R, Grita F, Parisi F, Russo L. Vulnerability of mountain peoples to food insecurity: updated data and analysis of drivers. Food & Agriculture Organistaion;2020. https://www.fao.org/3/cb2409en/CB2409EN.pdf
- Shrestha U. B, Gautam S, Bawa K. S. Widespread climate change in the Himalayas and associated changes in local ecosystems. PloS One. 2012;7(5).https://doi.org/10.1371/journal.pone.0036741
CrossRef - Shrestha S, Yao T, Kattel D. B, Devkota L. P. Precipitation characteristics of two complex mountain river basins on the southern slopes of the central Himalayas. Theoretical and Applied Climatology. 2019;138(1–2): 1159–1178. https://doi.org/10.1007/s00704-019-02897-7
CrossRef - Dimri A.P, Dash S.K. Wintertime climatic trends in the western Himalayas. Climatic Change. 2011;111(3-4):775-800. https://doi.org/10.1007/s10584-011-0201-y
CrossRef - Guhathakurta P, Rajeevan M. Trends in the rainfall pattern over India. International Journal of Climatology.2008; 28(11):1453 – 1469.
CrossRef - Office of the Addl. Director General of Meteorology (Research). Climate of Himachal Pradesh. Climatological Summaries of States Series - No.15. New Delhi: Controller of Publications, Government of India, Department of Publication, Civil Lines; 2010.
- Pant G, Borgaonkar H. Climate of the hill regions of Uttar Pradesh. Himal Res Dev. 1984; 3:13–20.
- Shrestha A. B, Wake C. P, Dibb J.E, Mayewski P.A. Precipitation fluctuations in the Nepal Himalaya and its vicinity and relationship with some large-scale climatological parameters. Int.J.Climatol. 2006; 20: 317 – 327.
CrossRef - Sharma K, Moore B, Vorosmarty C. Anthropogenic, climatic and hydrologic trends in the Kosi Basin, Himalaya. Clim Chang. 2000; 47:141–165.
CrossRef - Singh R, Sen-Roy S. Climate variability and hydrological extremes in a Himalayan catchment. In: ERB and Northern European FRIEND Project 5 Conference; 2002; Slovakia.
- Fowler H.J, Archer D.R. Conflicting signals of climatic change in the upper Indus Basin. Journal of Climate. 2006;19: 4276–4293. https://doi.org/10.1175/JCLI3860.1
CrossRef - Kumar V, Singh P, Jain S. K. Rainfall trends over Himachal Pradesh, Western Himalaya, India. Conference on Development of Hydro Power Projects - A Prospective Challenge: 20-22 April; 2005; Shimla.
- Mann H.B. Non-parametric test against trend. Econometrica. 1945; 13: 245–259. http://dx.doi.org/10.2307/1907187
CrossRef - Kendall M.G. Rank Correlation Methods 4th edition. London, U.K. Charles Griffin; 1975.
- Sen P.K. Estimates of the regression coefficient based on Kendall’s tau. J Am Stat As. 1968; 63:1379–1389. doi:10.1080/01621459.1968.10480934
CrossRef - Chandrashekhar A. Basics of Atmospheric Sciences. PHI Learning Private Limited ;2010.
- Krishna Kumar K, Rupa Kumar K, Ashrit G.R, Deshpande R.N, Hansen W.J. Climate impacts on Indian agriculture. Int. J. Climatol. 2004; 24:1375–1393. http://dx.doi.org/10.1002/joc.1081
CrossRef - Kothawale D.R, Revadekar J.V, Rupakumar, K. Recent trends in pre-monsoon daily temperature extremes over India. J. Earth Syst. Sci. 2010;119 (1): 51–65. http://dx.doi.org/10.1007/s12040-010-0008-7
CrossRef - Gautam R, Hsu N.C, Lau K.M, Kafatos M. Enhanced pre-monsoon warming over the Himalayan-Gangetic region from 1979 to 2007. Ann. Geophys. 2009; 27: 3691–3703. http://dx.doi.org/10.1029/2009GL037641
CrossRef - Lau K.M, Kim M.K, Kim K.M. Asian Summer monsoon anomalies induced by aerosol direct forcing; the role of Tibetian Plateau. Climate Dyn. 2006;26: 864–885. http://dx.doi.org/10.1007/s00382-006-0114-z
CrossRef - Nigam S, Bollasina M. ‘‘Elevated heat pump’’ hypothesis for the aerosol–monsoon hydro climate link: ‘‘Grounded’’ in observations. J. Geophys. Res. 2010;115: D16201. https://doi.org/10.1029/2009JD013800
CrossRef


