Assessment of Trace Elements Levels in Sediment and Water in Some Artisanal and Small-Scale Mining (ASM) Localities in Ghana
Kofi Agyarko1 * , Emmanuel Dartey1 , Richard Amankwah Kuffour1 and Peter Abum Sarkodie1
1
College of Agriculture Education,
University of Education,
Winneba,
Mampong/Ash.
Ghana
DOI: http://dx.doi.org/10.12944/CWE.9.1.02
The concentrations of eight trace elements, Cadmium (Cd), lead (Pb), iron (Fe), zinc (Zn), manganese (Mn), copper (Cu), mercury (Hg) and arsenic(As) in sediment and water were assessed in four artisanal and small-scale mining(ASM) localities in the Amansie West District (6°28′N 1°53′W) of Ghana along two river courses from May 2011to July 2011. Triplicate water and sediment samples were randomly taken at five different points at each of the localities and the elements determined using Atomic Absorption Spectrophotometer (AAS ). Using the Geo-accumulation Index( Igeo) assessment, the sediments were found to be polluted to different degrees with Cu(Uncontaminated to moderately contaminated/Moderately contaminated), Hg (Uncontaminated to moderately contaminated/Moderately contaminated) and As(Moderately contaminated/Moderately to strongly contaminated). The Enrichment Factor (EF) indicated human influence - artisanal mining activities on the sediment concentration of Cd and Pb for all the localities and only some of the localities for the rest of the trace elements. The elements are major sediment pollutants ( EF > 2) in one or more of the localities. The Igeo and EF gave diverse status of the sediment qualities of the localities. Cd, Pb, Hg and As water concentrations in the four artisanal mining localities were all found to be above the WHO maximum acceptable of levels for drinking water. Inhabitants in the mining localities face the risk of getting various diseases by drinking the waters contaminated with the trace elements.
Copy the following to cite this article:
Agyarko K, Dartey E, Kuffour R. A, Sarkodie P. A. Assessment of Trace Elements Levels in Sediment and Water in Some Artisanal and Small-Scale Mining(ASM) Localities in Ghana. Curr World Environ 2014;9(1) DOI:http://dx.doi.org/10.12944/CWE.9.1.02
Copy the following to cite this URL:
Agyarko K, Dartey E, Kuffour R. A, Sarkodie P. A. Assessment of Trace Elements Levels in Sediment and Water in Some Artisanal and Small-Scale Mining(ASM) Localities in Ghana. Curr World Environ 2014;9(1). Available from: http://www.cwejournal.org/?p=5779<
Download article (pdf)
Citation Manager
Publish History
Select type of program for download
| Endnote EndNote format (Mac & Win) | |
| Reference Manager Ris format (Win only) | |
| Procite Ris format (Win only) | |
| Medlars Format | |
| RefWorks Format RefWorks format (Mac & Win) | |
| BibTex Format BibTex format (Mac & Win) |
Article Publishing History
| Received: | 2014-01-26 |
|---|---|
| Accepted: | 2014-03-22 |
Introduction
The contribution of mining to the economy of many countries is enormous. The mining industry contributes much to exports and acts as one of the major sources of employment for mankind. The mining industry is made up of both the large-scale mining and the artisanal and small-scale mining(ASM) sectors. ASM, which is referred to in the Ghanaian parlance as 'galamsey' contributed 23 percent of total gold production in 2010, with over a million Ghanaians directly dependent on it for their livelihood (Norgah, 2013). At the global level the International Labour Organization (ILO) has reported that around 13 million people work directly in small mines throughout the world, most of them in developing countries (IFC, 2012).
Aside the economic benefits of large-scale mining and artisanal and small-scale mining, the sectors are perhaps better known for their high environmental costs. Environmental issues such as deforestation, destruction of farming potentials, problems with land reclamation and water contamination resulting from mining have become headache to man.
The most important sources of trace elements in the environment are from mining operations. Grinding, concentration of ores and disposal of tailings, together with mine waste water are contamination sources of trace elements in the environment (Adriano, 1986). Rivers, streams, sediments have been found to be contaminated by trace elements as, As, Fe, Hg, Mn and Pb from artisanal mining activities, and their values have also been found to exceed standard safety levels (Ojo and Oketayo, 2006; Nartey et al., 2011).
Numerous studies have been undertaken into trace elements contamination derived from mining activities, in soils, plants, waters and sediments in various countries (Pestana et al., 1997).
Though some metals like Fe, Cu and Zn are essential micronutrients, they can be detrimental to man and other living organisms at higher concentrations (Kar et al., 2008; Nair et al., 2010).
The objective of this research work was to assess the effect of artisanal mining on pollution levels of some trace elements in sediment and water of four mining localities in Ghana.
Materials and Methods
Study Area
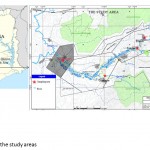
The study was carried out in four localities (Esaase, Tetrem, Gyeninso and Adobewora) in the Amansie West District (6°28′N 1°53′W) of Ghana along two river courses – rivers Bonte and Gyeni (Figure 1) having active artisanal mining operations. The sampling procedure was carried out from May 2011- July 2011.
|
|
Figure 1: Map of the study areas |
Sampling and Analyses
Five water and sediment samples were randomly taken at five different points at each of the localities. Pre-cleaned acid washed plastic containers were used to collect samples of water below the water surface, while at the same water sampling points the sediment samples were collected. Water and sediment samples from the source of the rivers which have no record of pollution and sprang through non mining area were taken and analyzed to serve as reference. Water and sediment samples were collected following the standard procedure described by DWAF (1992). Water samples were kept cooled en route to the laboratory and stored at 4 ËšC while sediment samples were kept frozen at -18 ËšC until analysed.
Sediment samples were allowed to defrost, then air-dried in a circulating oven at 30ËšC and thereafter sieved mechanically using a 2 mm sieve and homogenized. A 0.2 g weight of each sediment sample was weighed onto polyethylene film, wrapped and heat-sealed.
The digested samples of both water and sediment were analyzed for Cadmium (Cd), lead (Pb), iron (Fe), zinc (Zn), manganese (Mn), copper (Cu), mercury (Hg) and arsenic (As) using an Atomic Absorption Spectrophotometer at the Soil Research Institute at Kwadaso – Kumasi, Ghana. The instrument setting and operational conditions were carried out in accordance to Motsara and Roy (2008).
The accuracy of the analytical method was evaluated using the standard reference materials IAEA 433, IAEA 405, QTM080MS and QTM081MS.
Calculations and Statistical Package
The Geo-accumulation Index (Igeo) and Enrichment Factor (EF) were employed to assess the pollution of the trace elements in the sediments of the rivers.
The Igeo was determined by the following equation (Müller, 1969; Boszke et al., 2004):
Igeo = ln(Cn/1.5 × Bn)
Cn = Measured concentration of the trace element in the sediment.
Bn = Background value of the trace element and 1.5 = Background matrix correction factor
The geo-accumulation index consists of 7 grades or classes; Igeo value of < 0, practically unpolluted; > 0–1, unpolluted to moderately polluted; > 1– 2, moderately polluted; > 2–3, moderately and > 5 very strongly polluted (Müller, 1969).
The enrichment factor (EF) was calculated as the following in reference to Buat - Menard and Chesselet (1979):

Cn - content of the examined element in the examined environment,
Cref - content of the examined element in the reference environment,
Bn - content of the reference element in the examined environment,
Bref - content of the reference element in the reference environment.
It is assumed that the considered reference element should have little variation in occurrence and present in very small amount in the study area. However, a geochemically characteristic element occurring in high concentration may be used, but should have no synergistic or antagonistic effect towards the examined element. Sc, Mn, Al and Fe have been commonly used as reference elements (Loska et al., 1997). Based on the reaction of Fe with As, the current study used Mn as reference element. An EF of >1.5 was considered indicative of human influence and an EF of 1.5–3, 3–5, 5–10, and >10 was considered evidence of minor, moderate, severe, and very severe modification, respectively (Birch and Olmos, 2008).
Values of trace elements in the sediment and water samples from the localities were subjected to analysis of variance (ANOVA) and the Least Significant Difference Test (p≤0.05) for the separation of means using the GenStat (11th Edition) statistical software package. Correlation between trace element (metal) in water and water sediment was done with the same statistical software package.
Results and Discussion
Trace element concentration in water sediment
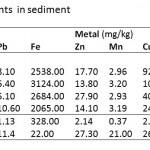
Table 1 shows sediment concentrations of eight trace elements (Cd, Pb, Fe, Zn, Mn, Cu, Hg and As) assessed in four localities (Esaase, Tetrem, Gyeninso and Adobewora) sited in artisanal mining areas along rivers Bonte and Gyeni in Ghana.
|
Table 1: Trace elements in sediment |
|
|
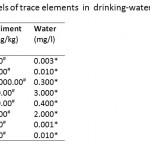
Table 2: Accepted levels of trace elements in |
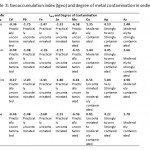
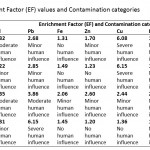
Cadmium (Cd) concentration in the sediments was found to be below the maximum acceptable level (0.60 mg kg-1) in river sediments (WHO, 2004) (Table 2) at Tetrem (0.35 mg kg-1) and Adobewora (0.57 mg kg-1) while at Gyeninso (0.76 mg kg-1) and Esaase (0.63 mg kg-1) the concentrations were above the maximum. Assessing the extent of Cd accumulation in the sediments using the Geoaccumulation Index (Igeo) indicated that the four areas of study were practically uncontaminated with Cd (Table 3). However, using the Enrichment Factor (EF), considered as an effective tool to evaluate the magnitude of metal contamination in soil (Franco-Uria et al., 2009) and EF classification by Birch and Olmos (2008), the contamination of Cd in the sediments at Esaase (EF=4.32) and Gyeninso (EF=3.35) might be said to come from moderate human influence, while at Tetrem (EF=2.22) and Adobewora (EF=2.31) the human influence might be classified as minor (Table 4). Zhang and Liu (2002) and, Birch and Olmos (2008) suggested that EF values above 1.5 have significant portion of the trace elements delivered from non-crustal materials or from human influence, which therefore supposes that the Cd contamination in the sediments from the localities was from the artisanal gold mining. Cd should be considered as a major sediment pollutant at all the localities as it has EF values of more than 2 (Han et al., 2006).
|
Table 3: Geoaccumulation index (Igeo) and |
|
Table 4: Enrichment Factor (EF) values |
The concentration of Lead (Pb) in the sediments (Esaase – 8.10 mg kg-1, Tetrem – 6.40 mg kg-1, Gyeninso – 6.10 mg kg-1 and Adobewora – 10.60 mg kg-1) (Table 1) was found to be less than the maximum acceptable level in river sediments (31 mg kg-1) (Table 2), the sediments were therefore classified by the Igeoas practically uncontaminated by Pb (Table 3). The EF values at Esaase (2.68), Tetrem (2.85), Gyeninso (3.86) and Adobewora (6.15) were above 1.5, and therefore a significant portion of the Pb concentration in the sediments might be delivered from non-crustal source - from the artisanal gold mining. The human influence at Adobewora was severe, moderate at Gyeninso and minor at Esaase and Tetrem (Table 4). Pb should be considered as a major sediment pollutant in the localities, as the EF values were more than 2.
The values of the concentrations of Fe (Esaase – 2538 mg kg-1, Tetrem - 3124 mg kg-1, Gyeninso - 2684 mg kg-1 and Adobewora - 2065 mg kg-1), Zn (Esaase – 17.70 mg kg-1, Tetrem – 13.80 mg kg-1, Gyeninso – 27.90 mg kg-1 and Adobewora – 14.10 mg kg-1) and Mn (Esaase – 2.96 mg kg-1, Tetrem – 3.20 mg kg-1, Gyeninso – 2.93 mg kg-1 and Adobewora – 3.19 mg kg-1) in the sediments of the rivers (Table 1) were lower than the WHO acceptable limits (Table 2). Using the Igeo (Table 3) the sediments were classified as practically uncontaminated by Fe, Zn and Mn. The EF values (Table 4) indicated minor human influence from the artisanal gold mining on Fe in the sediment at Gyeninso(EF=2.06) with the sediments at Esaase(EF=1.31), Tetrem(EF=1.49) and Adobewora(EF=1.45) having no human influence. The EF values at Esaase (1.70) and Gyeninso (2.60) for Zn showed minor human influence on the Zn concentration in the sediments with no human influence at Tetrem and Adobewura having EF values of 1.23 and 1.20 respectively. Based on the recommendation of Han et al.(2006), Fe and Zn concentrations in the sediment at Gyeninso having EF values of more than 2 should be considered as major sediment pollutants.
Cu concentration (Esaase – 92.52 mg kg-1, Tetrem – 101.15 mg kg-1, Gyeninso – 40.12 mg kg-1 and Adobewora – 24.28 mg kg-1) ) in the sediments (Table 1) were far higher than the WHO sediment quality standard (Table 2). Based on the Igeo (Table 3), the sediments were classified as contaminated with Cu (Uncontaminated to moderately contaminated/ Moderately contaminated). The EF values showed severe influence of the mining at Esaase (EF=6.08) and Tetrem (EF=6.15), minor influence of the mining at Gyeninso (EF=2.44) and no influence of the mining at Adobewora (EF=1.36) on the Cu sediment concentration (Table 4). In reference to Han et al.(2006), Cu should be viewed as a major pollutant at Esaase, Tetrem and Gyeninso.
Sediment concentration of Hg at Esaase(18.72 mg kg-1), Tetrem(25.56 mg kg-1), Gyeninso(46.60 mg kg-1) and Adobewora (20.50 mg kg-1) were all far higher than the WHO sediment quality standard (Table 2). The Igeo classification indicated contamination of the sediments of the four localities with Hg(Uncontaminated to moderately contaminated/ Moderately contaminated) (Table 3). While the EF values showed no influence of the mining activities on the Hg sediment concentrations at Esaase (EF=1.25) and Adobewora(EF=1.14), minor influence was observed at Tetrem(EF=1.58) and Gyeninso(EF=2.81) (Table 4). Hg was only observed to be a major pollutant at Gyeninso.
The sediment concentration of As at Esaase (107.50 mg kg-1), Tetrem (128.60 mg kg-1), Gyeninso(60.10 mg kg-1) and Adobewora (49.68 mg kg-1) (Table 1) were higher than the WHO sediment quality standards (Table 2). Based on the Igeoclassification (Table 3), the sediments were found to be contaminated with As (Moderately contaminated/ Moderately to strongly contaminated). The human influence on the As sediment concentration as measured by the EF indicated minor human influence at Esaase (EF=2.02) and Tetrem (EF=2.24), and no human influence at Gyeninso (EF=1.19) and Adobewora (EF=0.90) (Table 4). Arsenic(As) was observed to be a major pollutant at Esaase and Tetrem.
The frequent use of Hg by artisanal gold miners to extract the gold from the ore (Donkor et al., 2006), the occurrence of As as an impurity in gold ore (Eisler, 2004) and Cu’s association with gold mining waste (Ferreira Da Silva et al., 2004) might have led to the high contamination of the elements in the sediments.
Trace Element Concentration in Water
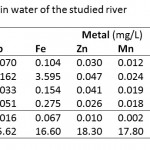
Table 5 indicates the concentrations of Cd, Pb, Fe, Zn, Mn, Cu, and Hg and As in water samples of the four artisanal mining localities.
|
|
Table 5: Trace elements in water of the studied river |
The water concentrations of Cd, Pb, Hg and As in the four artisanal mining areas were all found to be above the maximum acceptable of levels of 0.003. 0.01, 0.001 and 0.01 mg/l respectively for drinking water (Table 2).
Cd is a toxic metal with no metabolic benefits to human and aquatic biota. Its presence in any compartment of the aquatic ecosystem indicates contamination (Opaluwa et al., 2012). Very high Cd levels in drinking water may lead to vomiting and diarrhea, and sometimes death while taking lower levels over a long period will cause kidney damage and fragile bones (Cleveland, 2008).
Pb like Cd has no known purpose in our bodies and could cause permanent damage to the health of both children and adults (King County, 2013). Adults and children who drink water containing Pb in excess could experience kidney problems or high blood pressure and delays in their physical or mental development respectively (USEPA, 2012).
People who drink water containing Hg well in excess of the maximum contaminant level (MCL) for many years could experience kidney damage (USEPA, 2012).
According to USEPA (2013) drinking water containing As well in excess of the MCL for many years could lead to skin damage or problems of the circulatory system and the risk of getting cancer. It has been hypothesized that arsenic in drinking water indirectly contributes to Buruli ulcer (BU), a skin disease caused by Mycobacterium ulcerans (MU) infection in Ghana’s Amansie West district (Duker et al., 2005).
Residents in these areas face the risk of getting various diseases by drinking the waters contaminated with these trace elements. Extreme care is needed to be taken.
With the exception at Tetrem where the water concentration of Fe (3.595mg/l) was found to be more than the accepted maximum level in drinking water (0.30 mg/l), the rest were less than the accepted maximum level. Fe concentrations of 1–3 mg/l are known to be acceptable for people to drink (WHO, 1996), however, above 3 mg/l as in the case of Tetrem may have negative effect on man. Fe levels above 0.3 mg/l are known to cause staining of laundry (Vendrell and Atiles, 2003).
The water concentrations for Zn, Cu and Mn in the study areas were less than the accepted maximum levels in water (Table 2) and may pose no problem to man.
Correlation between trace element (metal) in water and water sediment
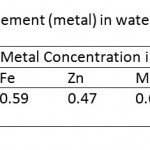
The concentrations of the trace elements in the sediments were found to be positively correlated with the concentrations in the water samples (Table 6). In similar situations trace elements concentrations in waters and sediments have been found to have significant positive relationship in the pollution of river ecosystems (Casas et al., 2003); sediments do act as carriers and sinks for trace elements (Singh et al., 2005; Mwamburi, 2003).
|
|
Table 6: Correlation between trace element (metal) |
Conclusion
The sediments were found not to be practically polluted with Cd, Pb, Fe, Zn and Mn but polluted to different degrees with Cu, Hg and As using the Igeo assessment. The EF indicated human influence on the sediment concentrations of Cd and Pb for all the localities and only some of the localities for the rest of the trace elements. The different pollution indexes gave diverse status of the sediment qualities of the localities as observed in similar studies by Praveena et al. (2007). Cd, Pb, Hg and As water concentrations in the four artisanal mining localities were all found to be above the WHO maximum acceptable of levels for drinking water. People in these localities face the risk of getting various diseases by drinking the waters contaminated with these trace elements.
Acknowledgement
The authors thank the Soil Research Institute (SRI), Kwadaso, Kumasi-Ghana for making their laboratory available for the analyses of sediment and water samples.
Rreferences
- Adriano D.C., Trace Elements in the Terrestrial Environment. Springer-Verlag, New York, 18–20 (1986).
- Birch G. F., Olmos M. A., Sediment-bound heavy metals as indicators of human influence and biological risk in coastal water bodies, ICES Journal of Marine Science. 65: 1407–1413 (2008).
- Boszke L., Sobczynski T., Kowalski A., Distribution of Mercury and Other Heavy Metals in Bottom Sediments of the Middle Odra river (Germany/Poland), Polish Journal of Environmental Studies. 13: 495-502 (2004).
- Buat-Menard P., Chesselet R., Variable influence of the atmospheric flux on the trace metal chemistry of oceanic suspended matter, Earth and Planetary Science Letters. 42: 398– 411 (1979).
- Casas J. M., Rosas H., Sole M., Lao C., Heavy metals and metalloids in sediments from Llobregat basin, Spain, Environmental Geology. 44: 325-332 (2003).
- Cleveland C. J., Health effects of cadmium. Encyclopedia of Earth, http://www.eoearth.org/view/article/153344. (2008). Retrieved in December 2013.
- Department of Water Affairs and Forestry (DWAF), Analytical Methods Manual TR151. Hydrological Research Institute, Pretoria (1992).
- Donkor A. K., Nartey V. K., Bozongo J. C., Adotey D. K., Artisanal mining of gold with mercury in Ghana, West Afr. J. Appl. Ecol. 9: 1-8 (2006).
- Duker A. A., Carranza E. J. M., Hale M., Spatial relationship between arsenic in drinking water and Mycobacterium ulcerans infection in the Amansie west district, Ghana, Mineralogical Magazine. 69: 707-717 (2005).
- Eisler R., Arsenic hazards to humans, plants and animals from gold mining, Rev. Environ. Contam. Toxicol. 180: 133-165 (2004).
- Ferreira da Silva E., Zhang C., Pinto L. S., Patinha C., Reis P., Hazard assessment on arsenic and lead in soils of Castromil gold mining area, Portugal, Applied Geochemistry. 19: 887-898 (2004).
- Franco-Uria A., Lopez-Mateo C., Roca E., Fernandez-Marcus M. L., Source identification of heavy metals in pasture land by multivariate analysis in NW Spain, J. Hazard. Mater. 165: 1008-1015 (2009).
- Han Y.M., Du P.X., Cao J.J., Posmentier E.S., Multivariate analysis of heavy metal contamination in urban dusts of Xi’an, Central China, Sci. Total Environ. 355: 176–186 (2006).
- International Finance Corporation (IFC), Artisanal and Small-scale Mining: Challenges and Opportunities, http://commdev.org. (2012). Retrieved in December 2013.
- Kar D., Sur P., Mandal S.K., Saha T., Kole R.K., Assessment of heavy metal pollution in surface water, Int. J. Environ. Sci. Tech. 5:119-124 (2008).
- King County, Public Health, Seattle & King County - Lead and its human effects,http://www.kingcounty.gov/healthservices/health/ehs/toxic/LeadGeneral.aspx. (2013). Retrieved in November 2013.
- Loska K., Cebula J., Pelczar J., Wiechula D., Kwapuli´nski J., Use of enrichment, and contamination factors together with geoaccumulation indices to evaluate the content of Cd, Cu, and Ni in the Rybnik Water Reservoir in Poland, Water, Air, and Soil Pollution. 93: 347–365 (1997).
- Motsara M.R., Roy R.N., Guide to laboratory establishment for plant nutrient analysis. FAO, Fertilizer and Plant Nutrition, Bulletin 19. Rome (2008).
- Muller G., Index of geoaccumulation in sediments of the Rhine River, Geology Journal. 2: 109–118 (1969).
- Mwamburi J., Variations in trace elements in bottom sediments of major rivers in Lake Victoria’s basin, Kenya, Lake and Reservoirs: Research and Management. 8: 5-13 (2003).
- Nair I.V., Singh K., Arumugam M., Gangadhar K., Clarson D., Trace metal quality of Meenachil River at Kottayam, Kerala (India) by principal component analysis, World Appl. Sci. J. 9:1100-1107 (2010).
- Nartey V. K., Klake R. K., Hayford E. K., Doamekpor L. K., Appoh R. K., Assessment of Mercury Pollution in Rivers and Streams around Artisanal Gold Mining Areas of the Birim North District of Ghana, Journal of Environmental Protection. 2: 1227-1239 (2011).
- Norgah G., Artisanal Mining (Galamsey) – An opportunity or a problem? http://www.modernghana.com/news/464091/1/artisanal-mining-galamsey-an-opportunity-or-a-prob.html. (2013). Retrieved in November 2013.
- Ojo J., Oketayo O., Trace elements in the food chain - Environmental impact of small-scale/artisanal gold mining in Ile-Ife 2: heavy metal contamination of water. Proceedings of an international symposium on trace elements in the food chain, Budapest, Hungary, 25-27 May, 201-205 (2006).
- Opaluwa O.D., Aremu M. O., Ogbo L. O., Magaji J. I., Odiba I. E., Ekpo E.R., Assessment of Heavy Metals in Water, Fish and Sediments from UKE Stream, Nasarawa State, Nigeria, Current World Environment. 7: 213-220 (2012).
- Persaud D., Jaagumagi R., Hayton A., Guidelines for the Protection and Management of Aquatic Sediment Quality in Ontario. http://www.itrcweb.org/contsedsbioavailability/References/guide_aquatic_sed93.pdf. (1993). Retrieved in September 2013.
- Pestana M.H.D., Formoso M. L. L., Teixeira E.C., Heavy metals in stream sediments from copper and gold mining areas in southern Brazil, J. Explor. Geochem. 58: 133–143 (1997).
- Praveena S. M., Radojevic M., Abdullah M. H., The Assessment of Mangrove Sediment Quality in Mengkabong Lagoon: An Index Analysis Approach, International Journal of Environmental & Science Education. 2: 60 – 68 (2007).
- Rickwood C., Carr G. M., Global Drinking Water Quality Index Development and Sensitivity Analysis Report. United Nations Environment Programme Global Environment Monitoring System (GEMS)/Water Programme.http://www.un.org/waterforlifedecade/pdf/global_drinking_water_quality_index.pdf. (2007). Retrieved in September 2013.
- Singh K. P., Mohan D., Singh V. K., Malik A., Studies on distribution and fractionation of heavy metals in Gomti river sediments – a tributary of the Ganges, Indian Journal of Hydrology. 312: 14-27 (2005).
- United State Environmental Protection Agency (USEPA), Basic Information about Lead in Drinking Water, http://water.epa.gov/drink/contaminants/basicinformation/lead.cfm. (2012). Retrieved in October 2013.
- United State Environmental Protection Agency (USEPA), Basic Information about Mercury (inorganic) in Drinking Water. http://water.epa.gov/drink/contaminants/basicinformation/mercury.cfm. (2012). Retrieved in October 2013.
- United State Environmental Protection Agency (USEPA), Basic Information about Arsenic in Drinking Water. http://water.epa.gov/drink/contaminants/basicinformation/arsenic.cfm. (2013). Retrieved in October 2013.
- Vendrell P. F., Atiles J. H., Your Household Water Quality: Iron and Manganese. Housing and Environment - The University of Georgia Cooperative Extension Service, http://aesl.ces.uga.edu/publications/watercirc/IronManganese.pdf. (2003). Retrieved in November 2013.
- World Health Organization (WHO), Guidelines for Drinking-Water Quality - Second Edition - Volume 2 – Health Criteria and Other Supporting Information. INTERNATIONAL PROGRAMME ON CHEMICAL SAFETY, http://www.who.int/water_sanitation_health/dwq/2edvol2p1.pdf. (1996). Retrieved in October 2013.
- Zhang J., Liu C.L., Riverine composition and estuarine geochemistry of particulate metals in China-weathering features, anthropogenic impact and chemical fluxes, Estuar. Coast. Shelf S. 54: 1051–1070 (2002).


