Effect of Industrial Effluents on Surface Water Quality - A Case Study of Patancheru, Andhra Pradesh, India
Mushtaq Hussain1 * and TVD Prasad Rao2
1
Department of Chemistry,
Deccan College of Engg and Tech,
India
2
P.G. College Osmania University,
Hyderabad
India
DOI: http://dx.doi.org/10.12944/CWE.8.3.14
Copy the following to cite this article:
Hussain M, Prasad Rao T. V. D. Effect of Industrial Effluents on Surface Water Quality - A Case Study of Patancheru, Andhra Pradesh, India. Curr World Environ 2013;8(3) DOI:http://dx.doi.org/10.12944/CWE.8.3.14
Copy the following to cite this URL:
Hussain M, Prasad Rao T. V. D. Effect of Industrial Effluents on Surface Water Quality - A Case Study of Patancheru, Andhra Pradesh, India. Curr World Environ 2013;8(3). Available from: http://www.cwejournal.org/?p=5339
Download article (pdf)
Citation Manager
Publish History
Select type of program for download
| Endnote EndNote format (Mac & Win) | |
| Reference Manager Ris format (Win only) | |
| Procite Ris format (Win only) | |
| Medlars Format | |
| RefWorks Format RefWorks format (Mac & Win) | |
| BibTex Format BibTex format (Mac & Win) |
Article Publishing History
| Received: | 2013-11-03 |
|---|---|
| Accepted: | 2013-12-12 |
Surface water is usually rain water that collects in surface water bodies, like oceans, lakes, or streams. Surface water can become contaminated in many ways, one of which is direct recharge can come from industries sources. A change in the water chemistry due to surface water contamination can negatively affect all levels of an ecosystem. It can impact the health of lower food chain organism and consequently the contaminated surface water can also affect the health of animals and humans when they drink or bathe in contaminated water or for aquatic organism when they ingest contaminated sediments. Degradation of water quality or depletion of water resources and loss of aquatic biodiversity are prominent features of the environmental landscape requiring urgent attention at global and national level.1 The effluents of the industries gave a great deal of influence on the pollution of the water bodies, these effluents can alter the physical, chemical and biological nature of the receiving water body.2 In the present study area there are about 400 (large and small) industries, and since 1977 these have been engaged in the manufacture, production, and processing of pharmaceuticals, paints and pigments, metal treatment and steel rolling, cotton and synthetic yarn, and engineering products. Most of them use various inorganic and organic chemicals as raw materials. These industries discharging their waste effluents directly into the streams.
The Study Area
The Patancheru and Bolaram Industrial Development Areas (IDA) (78°08′–78°23′ east longitude and 17°30′–17°42′ north latitude) of the Medak district are located about 35 km from Hyderabad, Andhra Pradesh (A.P.), India; the location is shown in Fig. 1. The study area form the part of the Nakkavagu watershed.
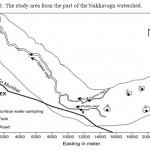 |
Figure 1: The study area form the part of the Nakkavagu watershed. Click here to View figure |
Surface water sampling
- Kazipally lake
- Gandigudem lake
- Asanikunta
- Kistareddy pet lake
- Palma vagu
- Pedda vagu
- Nakka vagu
The Pamulavagu, Peddavagu and Nakkavagu streams, while carrying industrial effluents also acts as diffuse sources of contamination along their courses to the confluence with the Manjira River. Apart from this, streams tanks both of medium and small size form the other surface water bodies of patancheru and bolaram industrial areas.
Methodology
Hydrochemical sampling procedure
The objective of sampling is to collect a portion of material small enough in volume to be transported conveniently and handled in the laboratory while still accurately representing the material being sampled (APHA, 1992).3 Samples, however, have to be handled in such a way that no significant change in composition occurs before the tests are made. A total number of 42 surface water samples were collected for physico-chemical analysis in two successive pre-and post-monsoon seasons of 2008, 2009, 2010. The water samples were collected and stored in 1 liter capacity clean plastic bottles. Before collection of samples, the bottles were properly washed. Prior to collecting the samples, the containers were rinsed by the water to be sampled. The major ion analyses were carried out at National Geophysical Research Institute, (NGRI) Hyderabad.
Analytical techniques for major ions
The water samples were analyzed as per the standard methods of APHA (1992). Values of pH were measured by a portable digital water analyses kit with electrodes. The instrument was calibrated with buffer solutions having pH values of 4 and 9. Total dissolved solids (TDS) were calculated by summing up the concentrations of all the major cations and anions. The values of electrical conductivity (EC) were measured by portable kit with electrodes. The concentrations of Ca++ , Mg++, Cl-, HCO3- and total hardness were determined by volumetric method. Ca++ and Mg++ were determined by EDTA titration. For HCO3-, HCl titration to a methyl orange point was used. Chloride was determined by titration with AgNO3 solution. Flame emission photometry has been used for the determination of Na+ and K+. In this method water sample is atomized and sprayed into a burner. The intensity of the light emitted by a particular spectral line is measured with the help of a photoelectric cell and a galvanometer. Sulphate was determined by gravimetric method.
Results and Discussion
The analytical data of successive pre-and post-monsoon seasons for surface water sample corresponding to June 2008 and November 2008, June 2009 and November 2009 June 2010 and November 2010 are given in table 1, 2, 3,4,5,6.
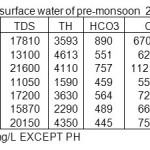 |
Table 1: Physico-chemical characterization of surface water of pre-monsoon 2008 IN mg/L Click here to View table |
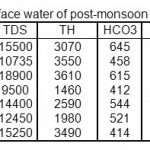 |
Table 2: Physico-chemical characterization of surface water of post-monsoon 2008 IN mg/L Click here to View table |
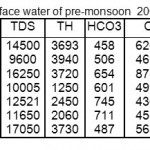 |
Table 3: Physico-chemical characterization of surface water of pre-monsoon 2009 IN mg/L Click here to View table |
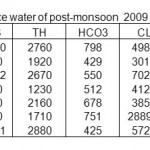 |
Table 4: Physico-chemical characterization of surface water of post-monsoon 2009 in mg/L Click here to View table |
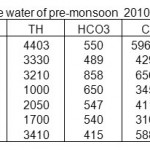 |
Table 5: Physico-chemical characterization of surface water of pre-monsoon 2010 in mg/L Click here to View table |
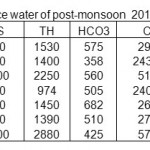 |
Table 6: Physico-chemical characterization of surface water of post-monsoon 2010 in mg/L Click here to View table |
Classification of surface water
The chemical classification of surface water has been studied using L-L diagram, given by Langelier and Ludwig (1942)4 for both, pre-monsoon and post-monsoon of 2008 seasons. Surface water samples have been plotted to discern any conspicuous changes in the overall chemical behavior of surface water during the two major seasons of the year. Both the plot belongs to pre and post-monsoons of 2008 indicate there are no major changes in the chemistry of surface water samples. Surface water of both the seasons belongs to sodium Cl+SO4 type.
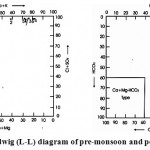 |
Langelier and Ludwig (L-L) diagram of pre-monsoon and post-monsoon 2008 Click here to View figure |
Physico-chemical attributes of surface water.
The properties of surface water of the area under study, in terms of fundamental parameters, such as, pH, total dissolved solids, Electric Conductivity, COD and BOD are given below.
Hydrogen Ion Concentration (pH)
The pH values were measured at well sites, are lies in the range of 7.25 to 8.41 and 7.35 to 8.0 during pre-monsoon 2008 and post-monsoon 2008, respectively .The surface water thus is mildly acidic to slightly alkaline in nature.
Electrical Conductivity
Seasonal variations showed higher value of EC in pre-monsoon 2008 and lower value in post-monsoon due to dilution with rain water. The values obtained were very much higher than the permissible limits. The conductivity was recorded in different seasons from minimum of 17 mS Cm-1 to a maximum of 33 mS Cm-1 in pre- monsoon 2008 season and from minimum of 14.9 mS Cm-1 to a maximum of 29.3 mS Cm-1 in post- monsoon 2008 season.
Total Dissolved Solids (TDS)
In water, total dissolved solids are composed mainly of carbonates, bicarbonates, chlorides, phosphates and nitrates of calcium, magnesium, sodium, potassium and manganese, organic matter, salt and other particles5. At high flows, the TDS values tend to be diluted by surface runoff and for most rivers there are an inverse correlation between discharge rate and TDS6. As expected, the maximum total dissolved solids were observed during the pre-monsoon season of 2008 (21600 mg/l) than the post-monsoon (18900 mg/l), this is due to dilution factor during the rainy season. Higher level of TDS during pre-monsoon season is more likely due to the influence of industrial activities such as effluent addition to the surface water. Waters with high total dissolved solids (TDS) are unpalatable and potentially unhealthy.
COD and BOD
COD pointing to a deterioration of the water quality caused by the discharge of industrial effluents7. The COD in the surface water ranges from 3100-27000 mg/l in pre-monsoon 2008 and from 1450-14500 mg/l in post monsoon 2008. High BOD level indicates decline in DO, because the oxygen that is available in the water is being consumed by the bacteria leading to the inability of fish and other aquatic organism to survive in the river8. The BOD in the surface water ranges from 2400-20200 mg/l in pre-monsoon 2008 and from 660-12500 mg/l in post monsoon 2008.
Temporal variation trends of major ions in surface water
Data of concentration of major ions of pre-and post-monsoon 2008, pre-and post-monsoon 2009, and pre-and post-monsoon 2010 are given in Table. The concentration values of all the samples are discussed in detail.
- In pre-monsoon seasons of 2008, 2009 and 2010, the concentration of Na ranges from 2856 to 6183.9 mg/l, 1932 to 4563 mg/l and 1600 to 3909 mg/l, respectively. In post-monsoon seasons of years 2008, 2009 and 2010 the observed ranges are 2311 to 5432 mg/l, 1472 to 4031 mg/l and 1198 to 3500 mg/l respectively.
- Potassium ranges from 204 to 575.3 mg/l, 115 to 304 mg/l and 79 to 750 mg/l in pre-monsoon samples whereas in post-monsoon seasons it ranges from 186 to 431 mg/l, 105 to 376 mg/l and 27 to 250 mg/l, respectively.
- Concentration of Ca ranges from 329.3 to 1300 mg/l, 304.9 to 1100 mg/l and 240 to 1600 mg/l in pre-monsoon samples and from 311.9 to 997 mg/l, 276.1 to 775 mg/l and 205.9 to 645 mg/l in post-monsoon samples.
- Magnesium values range from 188 to 458 mg/l, 120.1 to 405 mg/l and 97.6 to 463.6 mg/l in pre-monsoon periods and from 165.2 to 400 mg/l , 132.5 to 309 mg/l and 111.9 to 309 mg/l in post-monsoon.
- Bicarbonate ranges from 445 to 890 mg/l, 458 to 745 mg/l and 415 to 858 mg/l in pre-monsoon seasons of years 2008, 2009 and 2010, whereas in post-monsoon seasons of above years it ranges from 412 to 645 mg/l, 425 to 798 mg/l and 358 to 682 mg/l respectively.
- Chloride, in corresponding sampling periods, ranges from 5593 to 11214 mg/l, 4300 to 8734 mg/l, 3100 to 6560 mg/l and 4903 to 9900 mg/l, 2899 to 7021 mg/l, 2401 to 5720 mg/l respectively.
- The concentration of SO4 in corresponding seasons ranges from 679 to 4950 mg/l, 579 to 4250 mg/l, 722 to 3550 mg/l and 520 to 3679 mg/l, 432 to 3100 mg/l, 319 to 3100 mg/l, respectively.
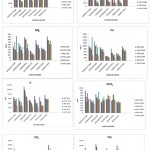 |
Variation of various parameters are graphically represented as Click here to View figure |
Conclusion
Surface water has the highest concentration of cations and anions. Surface water is affected by industrial effluents which have high concentration of Na, Ca, Mg, K, Cl, SO4 and HCO3.These parameters are in more than desirable limits which could be the result of direct dumping of effluents into the water bodies. The industrial effluents are let into the stream directly during rainy days thus leading to accumulation of elements in surface water, which together with rain water, flow down to Nakkavagu stream and join the major drainage system and these water in due course percolate down to join ground water reservoir. The effect of industrial pollution thus can be seen along Nakkavagu and its adjourning areas. The three years of study shows that the surface water pollution in Bolaram and patancheru industrial development areas has significantly reduced, due to fact that the emission of effluents are treated regularly for the last few years. The low reduction in surface water pollution may be due to rainfall dilution.
Acknowledgment
The author thanks Dr V. Balaram, Head Geo-chemistry Division, National Geo-physical Research Institute (NGRI) Hyderabad for his support
References
- M. Alkins-Koo, F.Lucas, L. Maharaj, S.Maharay, D. Phillip, Ecological indicators, 8 (2008) 709.
- Sangodoyin, A.Y.(1991). Ground water and surface water pollution by open refuse dump in Ibadan, Nigeria, Journal of discovery and Innovations 3(1): pp 24-31.
- APHA (1992): Standard methods for the examination of Water and Wastewater, 16th edition, APHA, Washington, D.C.
- Langeliar, W.F. and Ludwig, H.F. (1942) Graphic method for indicating the mineral character of natural water. Jour. Amer. Waterworks. Assoc., v.34 (3), pp.335-352.
- Mahananda, Mohanty, B.P. and Beheva, N.R. (2010): Physico-Chemical analysis of surface and ground water of Baragarh District, Orissa, India, IJRRAS 2(3).
- A.H. Charkhabhi and M. Sakizadeh (2006) “Assessment of spatial variation of water quality parameters in most polluted branch of the Anzali wetland, Northern Iran,” Polish J. of Environ. Study, 15 , 395-403
- Mamais, D; D.Jenkins & P. Pitt (1993): A rapid physico-chemical method for the determination of readily biodegradable soluble cod in municipal waste water. Water Research, 27(1) 195-197.
- H. Pathak and S.N. Limaye (2011): Study of seasonal variation in ground quality of sagar city (India) by Principal Component Analysis. E Journal Of Chemistry 8( 4) 2000-2009.


