Comparison of noise sensitivity and annoyance among the residents of Birjand old and new urban districts
Vahideh Abolhasannejad1 , Mohammad Reza Monazzam2 and Narjes Moasheri3
1
School of Public Health,
Social Determinant of Health Research Center,
Birjand University of Medical Sciences,
Birjand,
Iran
2
Department of occupational Hygiene School of Public Health and Center for Air Pollution Research (CAPR),
Institute for Environmental Research (IER),
Tehran University of Medical Sciences,
Tehran,
Iran
3
Birjand University of Medical Sciences,
Birjand,
Iran
DOI: http://dx.doi.org/10.12944/CWE.8.1.04
Copy the following to cite this article:
Abolhasannejad V, Monazzam M. R,Asghari M, Moasheri N. Comparison of noise sensitivity and annoyance among the residents of Birjand old and new urban districts. Curr World Environ 2013;8(1) DOI:http://dx.doi.org/10.12944/CWE.8.1.04
Copy the following to cite this URL:
Abolhasannejad V, Monazzam M. R,Asghari M, Moasheri N. Comparison of noise sensitivity and annoyance among the residents of Birjand old and new urban districts. Curr World Environ 2013;8(1). Available from: http://www.cwejournal.org/?p=3029
Download article (pdf)
Citation Manager
Publish History
Select type of program for download
| Endnote EndNote format (Mac & Win) | |
| Reference Manager Ris format (Win only) | |
| Procite Ris format (Win only) | |
| Medlars Format | |
| RefWorks Format RefWorks format (Mac & Win) | |
| BibTex Format BibTex format (Mac & Win) |
Article Publishing History
| Received: | 2012-12-02 |
|---|---|
| Accepted: | 2013-01-21 |
Noise is defined as an unpleasant sound that can affect people’s health and efficiency. Noise pollution not only produces effects such as damage to hearing system and disturbance in acoustic activities, reduce in concentration and efficiency, sleep disorder, physiological disorders, but also in long term creates annoyance that in the most common complication caused by noise among people. Noise sensitivity is a personality characteristic that can be regarded as a measure of individuals’ annoyance cause by the noise around them and it is a strong marker associated with noise annoyance.1-5
The formal and accepted definition of annoyance maybe as such: annoyance is an unpleasant feeling about a factor or condition that is believed to have adverse effects on man or community.6,7 Where ever these exists bothering or unpleasant noise around, it may cause anger and irritability. For this purpose, the noise doesn’t need to be loud but even a clock tic-tac in a waiting hall can influence on a sensational and ready ground and produce anger and aggression in individuals. In addition, studies have shown that noise influences on one’s mood and increases his or her aggressiveness and vulnerability. Although humans become accustomed to noise and acquire adaptation with it, however the fact is that noise is a boring factor and reduces one’s working capacity both in mental jobs needing precision and carefulness and in physical and simple jobs .
Moreover, noise affects on one’s mental status and disturbs his or her adaptation with working environment and even with family and society. Several studies in this fields have shown that the rate of noise annoyance among different individuals living in a similar condition have undergone relatively significant changes because of individual differences.8
Investigating in Muscut, Oman, showed that noise and its causative problems is not limited to industrial communities and has had a very sharp increase in developing countries. Environmental noise that interferes with individuals’ communicative behaviors, rigorous and intensive activities or sleeping, is considered an important environmental stressor. Effects of environmental noise will depend on acoustic factors and conditions such as noise loudness and the time of occurrence and exposure.
In fact, the annoyance caused by noise is a sensitive marker of the effects of harmful noise and is indicative of people’s quality of life under such conditions.9 Zannin Paulo and et al in a study conducted on the residents of one of Brazilian cities showed that the individuals’ main reaction to noise included 58% annoyance, 42% disorder in concentration, 20% sleep disorder and 20% headache.10 Sayed Abbas Ali, Egypt, in a study on dose-response relationship for the noise cause by road traffic showed that 71.9% of the studied subjects revealed high noise annoyance and 37.2% showed high noise sensitivity and a direct relationship was found between noise level of road traffic and the percent of respondents who reported high noise annoyance.11 Klaeboe and Amundsen studied noise exposure and noise annoyance in Norway. The results of their study showed that the rate of noise annoyance was greater inside buildings with low quality glass windows.12 When noise was considered a serious environmental pollution factor for the first time, a great number of social evaluations have been performed to measure the extent of this problem. The aim of the present study is to assess the noise sensitivity and annoyance among the residents of old and new districts of Birjand.
Materials and Methods
In this descriptive - analytical (cross – sectional) study with the aim to assess the rate of noise sensitivity and annoyance among the residents of Birjand's old and new districts in the summer, the studied population included the residents of 8 divisions including the residents close to stations of Taleghani st., Motahari st., Montazeri st., and Shohada st. in old district, and the stations of Jamaran st., Mahallati st., Avini st., and Ghaffari st. in new district (figure 1).
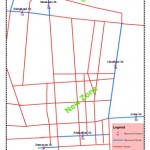 |
Figure 1: Distribution of the studied areas Click here to View figure |
Noise measurements were performed with the "CEL" Noise Level Analyzer. Equivalent noise levels (Leq) were measured in four daily periods (7:30h- 9:30h, 11:30h- 13:30h, 15:30h-17:30h, 19:30h-21:30h ) and in two periods in night (0.00h-2h, 4h-6h), according to the procedures recommended by BS 7445-1-2003 ÙˆBS 7445-3-1991 standard.11 A total of 364 individuals were selected by simple random sampling according to the mean prevalence of 60% noise sensitivity and annoyance from previous studies (n=pqz2/d2) (10,11). 400 questionnaires were presently distributed among the subjects out of whom 355 individuals were interviewed at eight selected districts. Due to heavier traffic and higher noise pollution level (higher than permissible) in the main streets, 181 questionnaires were completed in the main streets of new district and 174 one in the main streets of old district. (Table1)
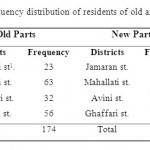 |
Table 1: Frequency distribution of residents of old and new part Click here to View table |
The inclusion criteria were: age more than 18, at least one year residence, and willingness to voluntarily participate in the project. Data collecting tool was a questionnaire consisting of three parts that was completed by the subjects. The first part contained demographic characteristics, the second related to Weinstein noise sensitivity scale (WNSS) with 21 questions about noise sensitivity,13 and the third part associated with noise annoyance rating scale (based on 15666 standard).14 Using this tool we measured the rate of noise sensitivity that is an attitudinal factor of the subjects’ irritation caused by noise.
In addition, we measured the noise annoyance caused by exposure to environmental noise. Moreover, the rate of noise response was measured by this tool which is a kind of social surrey. Cronbach’s alpha in the first and second half and the whole test in Ali Mohammadi and coworkers’ study on the reliability and validity of the Persian translation of Weinstein noise sensitivity scale was calculated 0.62 , 0.68 , 0.78 , respectively.
Regarding this result, Weinstein noise sensitivity test has relevant reliability and validity to be applied in field studies.15 Weinstein noise sensitivity scale contains 21 items. Each item has six options ranging from ‘agree strongly’ (0) to ‘disagree strongly’5 and the highest total score of the test was 105. (The higher score the higher sensitivity). The 21 item Weinstein noise sensitivity is categorized in to four subscales of “becoming sensitive to noise” (ten items), “disturbance in concentration” (6 item) “attitude to noise in where they live” (5 items), and “attitude to noise control” (6 items). (Some of the items are repeated within the subscales).
Noise annoyance is measured on a 7-point verbal scale (1: not / 7: very annoyed / disturbed) in response to the question: what is you’re feeling about the environmental noise of you residence? Which score best represents your feeling? (16) All calculations were done using SPSS (version 11.5). Chi-square test, t-tests and one-way ANOVA were used for the statistical assessments. A significance level of alpha =0.05 was used for all tests.
Results
The finding of the study showed that 47% of the subjects were fewer than 30, 40.8% Between 30 to 50 and 12.2% more than 50. In the present study it was observed that 69% were married, 9.9% were illiterate, 40.8% were high school graduates, and 49.3% had university education.32.7% of the subjects had government jobs, and 51% resided in the old district. In this study, the mean score of noise sensitivity was 63.5±16.1. The highest score in the subscale of “becoming sensitive to noise” was 30.6±9.5, and the subscale of “attitude to noise in where they live” revealed the lowest score of 13.8±4.6. (Table2). The results of environmental noise measurement in the studied stations showed that the highest Day–Night Noise Level (Ldn) belongs to Motahary st., (72.2 dB), whereas the highest total score of noise sensitivity is observed in this station (69.7±15.1) too. Also, the lowest score of sensitivity belongs to Shohada st. (59.4±13.7). (The lowest noise level compared to Motahary st.)(Table3). The one way analysis of variance showed significant difference in “attitude to noise control” (IV factor) between illiterate and university education levels (P=0.02). (Table 4) In the present study, 79.3% of the subjects in the old district and 77.3% in the new district desired to have peace and quiet in their residence and this desire revealed significant relationship with the urban district (P=0.05). Moreover, 81.8% of the unmarried and 72.7% of the married individuals stated the desire to have peace and quiet in their residence and this showed significant relationship with the marital status (P=0.04).T-test showed no significant difference between the total score of noise sensitivity between new (63.14±17.4) and the old districts (63.87±14.7) (P=0.6).The total score of noise sensitivity among men and women was calculated 63.6±15.6 and 63.1±17.5 respectively.
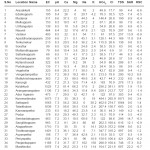 |
Table 2: Mean and standard deviation of noise sensitivity and its subscales score Click here to View table |
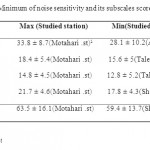 |
Table 3: Maximum & Minimum of noise sensitivity and its subscales score in the studied station Click here to View table |
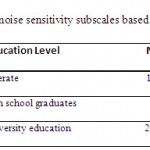 |
Table 4: Comparing the mean of noise sensitivity subscales based on level of education Click here to View table |
However t-test showed no significant difference in the total score of noise sensitivity between the two sex groups (P=0.3). The one-way analysis of variance showed no significant difference between the total score of noise sensitivity and its subscales with age groups, job, income, and household population. In this study, 56.3% of the subjects preferred peace and quiet in their residence to the beauty of house and residence and 43.7% enjoyed the beauty of the residues more than peace and quiet. In the study of the annoyance caused by noise, 28.5% of the subjects stated point 2 (partly satisfied) and 7.3% stated the highest rate of annoyance (point 7: absolutely dissatisfied). Noise annoyance rate in the old district (noise level =70.5 dB) was higher than that of the new district (noise level = 65.3 dB) (P=0.001). In addition, Chi-square test found significant relationship between noise annoyance and job (P=0.01).
However, this relationship was not significant with the variables of marital status, sex, age, education level, income and household population. The one-way analysis of variance showed significant difference between the rates of noise annoyance and the subscales of noise sensitivity (P<0.001). The highest mean score of noise sensitivity subscales, “attitude to noise in where they live” and “attitude to noise control” and the total score of noise sensitivity were calculated in those who had selected “a little satisfied” option in relation with the noise annoyance in the relevant stations.
The difference between the mean of total score of noise sensitivity and the score of “becoming sensitive to noise” subscale in those without noise annoyance compared to others with different rates of annoyance was observed to be significant (p<0.002), (p<0.001).Regarding the subscale of “disturbance in concentration” among the mentioned groups, we observed a significant difference too (p<0.001). The highest rate of “disturbance in concentration” relate to individuals with high rate of noise annoyance. The difference between the mean score of “attitude to noise in where they live” subscale among individuals without noise annoyance compared to those with annoyance rates of 2,3,5 and 6 was shown also significant(p<0.002). Also, The difference in the subscales of “attitude to noise control” in those with annoyance rates of 2, 3 and 6 was significant (p<0.009).
Discussion
According to the results of the present study, the mean total score of noise sensitivity was 63.5+16.1 that is lower than the mean score calculated in Belojevic and Jakovljevic study performed in two noisy and quiet urban districts in Yugoslavia.17 The mean scores of noise sensitivity subscales in our study is also lower than that of the above research that may be because of different environmental conditions existing in the studied districts (Lower difference between max and min noise level in our study rather than Belojevic and Jakovljevic study) as well as different cultural variables and personal characteristics of the populations residing in those districts. Raw and Griffiths in their study showed that people’s selfregulated noise sensitivity is the most important individual characteristic for predicting the rate of annoyance cussed by traffic noise.18 The results showed no significant difference between the total score of noise sensitivity between new and the old districts that may be because of lower difference between max and min noise level in old and new districts. Meanwhile, the results of Sukowski and coworkers’ study showed that children who live in quiet places are more affected by noise and its subsequent annoyance than those living in noisy and crowded districts.19 Concerning the results of our study, the highest noise level and the highest total score of sensitivity are found in Motahari st. station. This street, because of its business situation leads to shopping centers as well as long length and lack of main branches leading to it has been the cause of increased traffic density. In Shohada st, station, The lowest total score of noise sensitivity was measured seeming that is because the street is wider, has less traffic density, more green spaces that eventually leads to lower noise level than that of Motahari st. . The results of Raw and Griffith’s study revealed that noise sensitivity was associated with noise level.18 In the present study, a significant difference was observed between “attitude to noise control” and the subject’s education level (illiterates and those with university education) (P=0.02). This indicates that those with higher education level (due to more mental work) have greater desire to control the noise. Pathak et al., in their study in India, suggested that people with higher education level and income have greater awareness of the effects of noise on one’s health,20 however, other studies showed the difference between them non significant.13,21-24 In our study, significant difference was observed between desire to have peace and quiet in their residence and the type of urban district so that the number of those agreeing with peace and quiet in the old district was greater than that of in the new district indicating higher rate of noise annoyance in the old district. In the present study, more than 80% of the subjects were under 50 year and no significant difference was seen between the total score of noise sensitivity and its subscales, and age that is consistent with the results of Belojevic Zimmer s’ study13,17 while several others studies found significant relationship between total score of sensitivity and age21-24. The results of the study performed by Thomas et al. indicated the probability of the effect of aging on noise sensitivity particularly among woman.25 The present study showed no significant difference between the total score of sensitivity among both sex groups and similar results were found in other researchers’ studies.21-24,26 The results of our study revealed no significant difference between the subscales of noise sensitivity and the urban district, job, education level, income, and the member of household. Based on the findings of the study, the rate of noise annoyance in the old district was higher than that of the new district which is justifiable noting higher noise level in the old district become of the narrow width of the streets, heavier motorcycle traffic (due to low- income residents) that produces traffic burden and consequently noise pollution and residents’ dissatisfaction. In Sayed Abbas Ali’s study on road traffic noise also a direct relationship was observed between noise level and the percent of respondents who felt annoyed by noise.12 More ever, Klaeboe et al., in their study showed that noise annoyance is greater among those residing in buildings with low-quality glass windows (old district)12 The findings of the present study revealed significant relationship between the rate of noise annoyance and job. In the study performed by Taheri Nameghi also a significant relationship between noise annoyance and job was observed that is consistent with the results of the present study.27 In our study, no significant relationship was seen between noise annoyance and sex which is similar with the results of other studies on noise annoyance.28,29 In the study by Michaud et al. in Canada, The rate of noise annoyance was greater among woman and among those with high-income and better social status30. In addition, in a study by Ali Mohammadi et al., it is reported that the rate of noise annoyance was greater among men than women31; This finding is not consistent with that of our study. In this study no significant relationship was observed between noise annoyance rate and age indicating consistency with the results of Kjellberg and Ouis studies.32,33 However, in the study conducted by Ali Mohammadi et al., a significant relationship was seen and the suggested that the causes of greater annoyance among the middleaged (30 to 49 years of age) were their personal characteristics and more responsibility for their families.31 In the present study, the variables of marital status, education level, income, and the member of household showed no significant relationship with noise annoyance indicating similarity with the results of the study performed by Vincent.28 In this study, a significant difference was observed between noise sensitivity and noise annoyance mean score. Thus, the noise sensitivity score among individuals who were somehow affected by some degrees of noise annoyance was higher than that in those not affected. This means that noise annoyance can directly and indirectly cause increase in noise sensitivity rate among residents. Belojevic, Stansfeld and Moehler, in their study found the same results.17,34,35 Regarding that noise pollution problem is evident for all citizens particularly in big cities and plays a substantial role in noise sensitivity and annoyance rate among resident, it is suggested that in developing small cities, municipalities move noisy jobs to city margins, modify urbanization patterns, design highways and beltways in order to reduce the adverse effects of noise. In addition, further qualitative and quantitative studies on the relation of personality factor and noise sensitivity rate can be performed. ACKNO
Acknowledgement
The present study was conducted in the framework of plan No.368 with the financial support of research deputy of Birjand University of Medical Sciences. Authors wish to thank the officials and those dear ones who provided their best cooperation in our project.
References
- Fyhri A, Klæboe R(2009) Road traffic noise, sensitivity, annoyance and self-reported health—A structural equation model exercise. Environ Int, 35(1), 91-97, http://dx.doi.org/10.1016/j.envint.2008.08.006
- Paunović K, Jakovljević B, Belojević G(2009). Predictors of noise annoyance in noisy and quiet urban streets. Science of The Total Environment, 407, 3707-3711, http://dx.doi.org/10.1016/j.scitotenv.2009.02.033
- Miedema H, M.E. Vos H (1999). Demographic and attitudinal factors that modify annoyance from transportation noise. J. Acoust. Soc. Am, 105(6), 3336–3344, http://dx.doi.org/10.1121/1.424662
- Pedersen E, Waye K.P(2008). Wind turbines –low level noises interfering with restoration, Environmental Research Letters, 3, 1-5, http://dx.doi.org/10.1088/1748-9326/3/1/015002
- Lercher P, Botteldooren D, Widmann U, Uhrner U, Kammeringer E (2011).Cardiovascular effects of environmental noise: Research in Austria. Noise Health,13,234-50, http://dx.doi.org/10.4103/1463-1741.80160
- Lindvall T, Radford E.P(1973). Measurement of annoyance due to exposure to environmental factors. Environmental Research, 6, 1-36, http://dx.doi.org/10.1016/0013-9351(73)90014-5
- Schulte-Fortkamp B(2002). The meaning of annoyance in relation to the quality of acoustic environments. Noise Health. 4,13-8
- Rylander R, Bjorkman M(2002). Road traffic noise annoyance and winder orientation in dwellings. Journal of Sound and Vibration, 249(4), 828-831, http://dx.doi.org/10.1006/jsvi.2001.3745
- Miedema H. M.E(2007). Annoyance Caused by Environmental Noise: Elements for Evidence-Based Noise Policies. Journal of Social Issues, 63, 41–57. doi : 10.1111/j.1540-4560.2007.00495.x, http://dx.doi.org/10.1111/j.1540-4560.2007.00495.x
- Zannin Paulo H.T, Calixto Alfredo, Diniz Fabiano B, Ferreira Jose A.C(2002). A survey of urban noise annoyance in a large brazilian city: the importance of a subjective analysis in conjuction with an objective analysis, Environmental Impact Assessment Review,23(2).245-255.
- Sayed Abas Ali(2004). Investigation of the dose – response relationship for road traffic noise in Assiut, Egypt. Journal of Applied Acoustics, 65(11), 1113-1120, http://dx.doi.org/10.1016/j.apacoust.2004.06.007
- Klæboe R, Amundsen AH, Fyhri A, Solberg S(2004). Road traffic noise – the relationship between noise exposure and noise annoyance in Norway, Appl Acoust, 65(9), 893–912, http://dx.doi.org/10.1016/j.apacoust.2004.04.001
- Zimmer K, Ellermeier W(1999) Psychometric properties of four measures of noise sensitivity: A comparison, J.Environ. Psychol , 19, 295-302, http://dx.doi.org/10.1006/jevp.1999.0133
- Nelson P.M(1987). Transportation noise reference book. Butterworth press, London.
- Alimohammadi I, Nassiri P, Azkhosh M, Sabet M, Hosseini M(2006). Reliability and Validity of the Persian Translation of the Weinstein Noise Sensitivity Scale. Psychological Research, 9(1 & 2), 74-87.
- Brink M, Wirth KE, Schierz C, Thomann G, Bauer G(2008). Annoyance responses to stable and changing aircraft noise Exposure. J. Acoust. Soc. Am, 124(5), 2930-41, http://dx.doi.org/10.1121/1.2977680
- Belojevic G, Jakovljevic J(2001). Factors influencing subjective noise sensitivity in an urban population. Noise Health, 4(13),17-24.
- Raw GJ, Griffiths I.D(1988). Individual Differences to Road Traffic Noise. Journal of Sound and Vibration, 121, 463-471, http://dx.doi.org/10.1016/S0022-460X(88)80369-9
- Sukowsk H, Heydinger D, Lercher P, Meis M, Schick A(2000). Noise annoyance of children exposed to chronic traffic noise: results from the tyrol school study. Psychological Acoust, 571-580.
- Pathak V, Tripathi B.D, Mishra V.K(2008). Evaluation of traffic noise pollution and attitudes of exposed individuals in working place. Atmos Environ, 42(16), 3892-3898, http://dx.doi.org/10.1016/j.atmosenv.2007.12.070
- Moreira N.M, Bryan M.E(1972). Noise annoyance and susceptibility. Journal of Sound and Vibration, 21, 449-462, http://dx.doi.org/10.1016/0022-460X(72)90829-2
- Weinstein ND (1978). Individual di¡erences in reactions to noise: a longitudinal study in a college dormitory. Journal of Applied Psychology, 63(4), 458-466, http://dx.doi.org/10.1037/0021-9010.63.4.458
- Taylor SM(1984). A path model of aircraft noise annoyance. Journal of Sound and Vibration, 96(2), 243-260, http://dx.doi.org/10.1016/0022-460X(84)90582-0
- Stansfeld S.A(1992). Noise, noise sensitivity and psychiatric disorder: epidemiological and psychophysiological studies.Cambridge: Cambridge University Press.
- Thomas J.R, Jones D.M(1982). Individual differences in noise annoyance and the uncomfortable loudness level. Journal of Sound and Vibration, 82(2), 289-304, http://dx.doi.org/10.1016/0022-460X(82)90536-3
- Langdon F.J(1976). Noise nuisance caused by road traffic in residential locations: part II, Journal of Sound and Vibration, 49, 241-256.
- Taheri Nameghi M(1996). Noise and its subjective effects on communication operators. Tehran University of Medical Sciences, MSc thesis.
- Vincent B, Vallet M, Olivier D, Paque G(2000). Evaluation of variations of the annoyance due to aircraft noise. Inter Noise, 27-30.
- Ohrstrom E, Bjorkman M, Rylander R(1988). Noise Annoyance with Regard to Neurophysical Sensitivity, Subjective Noise Sensitivity and Personality Variables. Psychological Medicine, 18, 605-613, http://dx.doi.org/10.1017/S003329170000828X
- Michaud DS, Keith SE, Mcmurchy D(2005). Noise annoyance in Canada. Noise Health,7(27), 39-47, http://dx.doi.org/10.4103/1463-1741.31634
- Alimohammadi I, Nassiri P, Azkhosh M, Hoseini M(2010). Factors affecting road traffic noise annoyance among white-collar employees working in Tehran, Iran. J. Environ. Health. Sci. Eng, 7(1), 25-34.
- Kjellberg A, LandstrÎm U, Tesarz M, SÎderberg L, Akerlund E(1996). The effects of non-physical noise characteristics, ongoing task and noise sensitivity on annoyance and distraction due to noise at work. J. Environ Psychol, 16, 123-136, http://dx.doi.org/10.1006/jevp.1996.0010
- Ouis D(2001). Annoyance from Road Traffic Noise: A Review. J. Environ Psychol, 21,101-120, http://dx.doi.org/10.1006/jevp.2000.0187
- Stansfeld SA, Sharp DS, Gallacher J, Babisch W(1993). Road traffic noise, noise sensitivity and psychological disorder, Psychological Medicine, 23(4),977-985, http://dx.doi.org/10.1017/S0033291700026441
- Moehler U(1988). Community response to railway noise, a review of social surveys. Journal of Sound and Vibration, 120(2), 321-332, http://dx.doi.org/10.1016/0022-460X(88)90441-5


