Study of Fluorides in Different Water Sources around Bilaspur City (C’garh) and its Effect on Surrounding areas
Shuchi Gupta1 * , Utpal Jana2 and Dibyajyoti Saha3
DOI: http://dx.doi.org/10.12944/CWE.6.1.20
Water is essential for life on earth. A study was made on surface and ground water of different locations of six major villages around Bilaspur city, Chattishgarh. Samples were collected in the month of April, 2010 and concentrations of Fluorides were analyzed in the laboratory of PHE department, Bilaspur city. A comparative graph was plotted. Fluoride concentrations were found to be less than 1.5 mg/L, which is permissible limit, no harmful effect were found in this area.
Copy the following to cite this article:
Hait M, Gupta S, Jana U, Saha D. Study of Fluorides in Different Water Sources around Bilaspur City (C’garh) and its Effect on Surrounding areas. Curr World Environ 2011:6(1);141-144 DOI:http://dx.doi.org/10.12944/CWE.6.1.20
Copy the following to cite this URL:
Hait M, Gupta S, Jana U, Saha D. Study of Fluorides in Different Water Sources around Bilaspur City (C’garh) and its Effect on Surrounding areas. Curr World Environ 2011:6(1);141-144. Available from: http://www.cwejournal.org/?p=1303
Download article (pdf)
Citation Manager
Publish History
Select type of program for download
| Endnote EndNote format (Mac & Win) | |
| Reference Manager Ris format (Win only) | |
| Procite Ris format (Win only) | |
| Medlars Format | |
| RefWorks Format RefWorks format (Mac & Win) | |
| BibTex Format BibTex format (Mac & Win) |
Article Publishing History
| Received: | 2011-02-07 |
|---|---|
| Accepted: | 2011-03-14 |
Introduction
Water is the most abundant molecule on earth surface, constiuting about 70% of the planets surface. In nature it exists in solid, liquid and gaseous states. At room temperature, it is nearly colourless with a hint of blue, tasteless, and odourless liquid. Many substances dissolve in water and is commonly referred to as the universal solvent. Water usually makes up 55% to 78% of the human body.1,2 In natural water almost all of the hydrogen atoms are of the isotope protium, 1H. Water has characteristics like superconductivity, hydrogen bonding, surface tension, alkaline pH, transparency, dipolar properties, miscibility, adhesion, electrical properties etc.3,4 The pollution has been continually increasing since the existence of life due to population explosion and rapid growth of industries. The pollutant present in air in the industrial areas also ultimately contaminate water of rivers lakes springs etc. through rain. Domestic and industrial wastes are discharged on the earth surface polluted irrigation land and contaminates ground water.5,6
Fluoride is a natural occurring in all water sources and is also one of the most commonly used industrial chemicals. Both organic and inorganic compounds containing the element fluorine are sometimes called fluorides. Fluoride is found naturally in low concentration in drinking water and foods. Water with underground sources is more likely to have higher levels of fluoride, whereas the concentration in seawater averages 1.3 ppm.7 Fresh water supplies generally contain between 0.01–0.3 ppm, while the ocean contains between 1.2 and 1.5 ppm.8 In some communities, fluoride is added to public water supplies; a process known as fluoridation. Water fluoridation involves adjusting the natural level of fluoride to the levels recommended to prevent tooth decay.9,10 The U.S. specifies the optimal level of fluoride to range from 0.7 to 1.2 mg/ L, depending on the average maximum daily air temperature; the optimal level is lower in warmer climates, where people drink more water, and is higher in cooler climates. In 1994 a World Health Organization expert committee on fluoride use stated that 1.0 mg/L and in cold climates 0.5 mg/L may be an appropriate lower limit.11 Fluoride in naturally occurring water can be above at or below recommended levels. Rivers and lakes generally contain fluoride levels less than 0.5 mg/L, but ground water, particularly in volcanic or mountainous areas, can contain as much as 50 mg/L.12 Higher concentrations of fluorine are found in alkaline volcanic, hydrothermal, sedimentary, and other rocks derived from highly evolved magmas and hydrothermal solutions, and this fluorine dissolves into nearby water as fluoride.13
Experimental
The present report results of study of determine the concentration of fluoride in water from five major places in Bilaspur viz. (1) Seepat S1 (2) Khamtarai S2 (3) Sakri S3 (4) Mopka S4 (5) Sirgitti S5 and (6) Koni S6.These areas are situated in populated areas of the city and water from these areas is used for various human activities. Therefore, it becomes very important to assess periodically the quality of water from these water bodies to ascertain their pollution load.
Water sample was collected in one liter Polyethylene bottle previously soaked with nitric acid and then cleaned with detergent followed by rinsing with distilled water. All the chemicals used in the analysis were Loba/BHD grade. Distilled water is always used in the analysis.
The SPADNS method is used to estimate fluoride present in various water samples. 50 ml of water sample is taken in Nessler tube. 2 drops of sodium arsenate solution is added to treat residual chlorine and mixed well, 10 ml of the acid-Zirconyl-SPADNS reagent is added to the sample and contents thoroughly mixed. The spectrophotometer set to zero with the reference solution and then absorbance of the sample is measured. The mg of fluoride in water sample is equivalent to the observed optical density, which will be determined from the calibration graph. The results are expressed as mg fluoride per liter of the sample.14,15
Results and Discussion
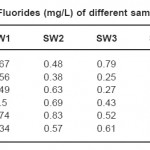
A total number of six samples were collected and tested for their fluoride concentration. Three samples represent surface water collected from river/nala and represented as S1-SW1 to S6-SW3, while the remaining samples were collected from tube wells S1-SW4 to S6-SW6. All the six samples were colourless, odourless and free from solid suspension. The results of absorbance are given in the following Table 1.
 |
Table 1: Concentration of Fluorides (mg/L) of different sampling spot of six villages Click here to View table |
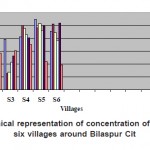
Results of analysis of water samples from six sampling spots of six villages around Bilaspur city are recorded in Table. I. In all the six sampling spots three sample were collected from the surface water and three samples from the tube well. Maximum permissible limit for fluoride as WHO is 1.5 mg/L. In all the six water samples of Village- SEEPAT (S1-SW1-6), fluoride was recorded in the range 0.67, 0.48, 0.79, 0.82, 1.1 and 0.91 mg/L.The fluoride concentration of six samples of village-KHAMTARAI (S2-SW1-6) was analyzed during the entire study period in the range of 0.56, 0.38, 0.25, 1.0, 0.97 and 1.02 mg/L. The maximum allowable limit of Fluoride in water according to Indian Standard (IS) is 0.6 to 1.2 mg/L. Maxm permissible limit for fluoride as CPHEEO manual (1991) is 1.0 mg/L. Water sample of village-MOPKA (S3-SW1-6) was recorded in the range of 0.49, 0.63, 0.27, 0.96, 1.03 and 0.89 mg/L. Fluoride concentration of village-SAKRI (S4-SW1-6) was observed in the range of 0.5, 0.69, 0.43, 0.86, 0.93 and 0.77 mg/ L.Fluoride concentration of village-SIRGITTI (S5-SW1-6) was observed in the range of 0.74, 0.83, 0.52, 0.81, 0.99 and 1.04 mg/L. Fluoride concentration of village-KONI (S6-SW1-6) was observed in the range of 0.34, 0.57, 0.61, 0.70, 0.44 and 0.39 mg/L.
 |
Figure 1: Graphical representation of concentration of Fluorides of six villages around Bilaspur City Click here to View figure |
Conclusion
The present study has been made to evaluate the fluoride concentration of water samples collected from the six villages around Bilaspur city, Chattishgarh. These samples were analyzed for the study of fluorides and their effect on surrounding areas. Fluoride in naturally occurring water can be above at or below the recommended levels. Both the deficiency and excess of fluoride in the water produces adverse effect on the human health.
Minimum acceptable value for fluoride as WHO (1985) is 1.5 mg/L. In present Study the fluoride concentration of water samples of all six villages were found under the permissible limit. Therefore, there were no harmful effect of fluoride were found on these villages.
Acknowledgements
The authors are grateful to Mr. Satish Tiwari, PHE department, Bilaspur City, Bilaspur, for providing necessary facilities to carry out the research work.
References
- Brown, Theodore L.; H. Eugene Le may, Jr. and Bruce E Burston; “ Chemistry: The Central Science”;10th ed.; Upper Saddle River, NJ: Pearson Education, Inc. (2006)
- Lide, D. R. (Ed.); “CRC Handbook of Chemistry and Physics”; 70th Edn. (1990).
- Dutta, P.K; “General and Inorganic Chemistry”, 9th ed; Sarat Book House, Kolkata; Vol.I; pp.380-388 (1990).
- Smith, Jared D; Proc. Natl. Acad. Sci 102(40): 14171–14174 (2005).
- Verma, R.M; “Analytical Chemistry Theory and Practice”; 3rd ed; CBS Publisher& Distributor; New Delhi; pp 461 (2000).
- Sharma B.K; “Environmental chemistry”; 11th revised ed; Krishna Prakashan Media(P) Ltd; pp. 80-81 (2007).
- Greenwood, Norman N and Earnshaw, A; “Chemistry of the Elements”; 2nd ed;Oxford: Butterworth-Heinemann, pp. 804 (1997).
- Fluoride in Drinking-water: WHO Guidelines for Drinking-water Quality; World Health Organization; pp. 2 (2004)
- Environmental Health Criteria 227: Fluorides. World Health Organization; pp. 38 (2002).
- Lamberg M, Hausen H and Vartiainen T; Community Dent Oral Epidemiol. pp: 291– 305 (1997).
- Lauer, W C ; “ Water Fluoridation Principles and Practices”. Manual of Water Supply Practices; 5th ed; American Water Works Association; M4 (2004).
- Nicholson J W and Czarnecka B; “Fluorine and Health”; Tressaud A, Haufe G (eds.); Elsevier; pp: 333–78. (2008).
- Fawell J, Bailey K, Chilton J, Dahi E, Fewtrell L and Magara Y “Environmental occurrence, geochemistry and exposure” World Health Organization. pp. 5–27; (2006).
- APHA “Standard Methods of examination of water and waste” American Public Health Association, Washington D.C (1989).
- NEERI “Manual of water and waste analysis” NEERI Publication (1988).


