Hydrochemical Profile for Assessing the Groundwater Quality of Paravanar River Sub-Basin, Cuddalore District, Tamil Nadu, India
K. Shankar1 * , S. Aravindan1 and S. Rajendran2
1
Department of Earth Sciences,
Annamalai University,
Annamalai Nagar,
Chidambaram,
India
2
Department of Earth Sciences,
Sultan Qaboos University,
Muscat,
Sultanate of Oman,
India
DOI: http://dx.doi.org/10.12944/CWE.6.1.05
The Present investigation addresses the groundwater quality aspects of Paravanar River Sub-Basin. Groundwater samples are collected from 35 locations during pre-monsoon for the year 2008 and analyzed for various physico- chemical parameters .Groundwater quality was evaluated with drinking water standards as prescribed by WHO (1984) standards. Gibbs diagram revealed that the overall hydrogeochemical environment of the study area is controlled by rock-water interaction. Three major hydrochemical facies (mixed CaMgCl, Ca–Cl and Na–Cl) were identified using a Piper trilinear diagram. Gibb’s diagram reveals that most the groundwater sample fall in the rock dominance field. The concentrations of cations and anions are within the maximum allowable limits for drinking purpose.
Copy the following to cite this article:
Shankar K, Aravindan S, Rajendran S. Hydrochemical Profile for Assessing the Groundwater Quality of Paravanar River Sub-Basin, Cuddalore District, Tamil Nadu , India . Curr World Environ 2011:6(1);45-52 DOI:http://dx.doi.org/10.12944/CWE.6.1.05
Copy the following to cite this URL:
Shankar K, Aravindan S, Rajendran S. Hydrochemical Profile for Assessing the Groundwater Quality of Paravanar River Sub-Basin, Cuddalore District, Tamil Nadu , India . Curr World Environ 2011:6(1);45-52. Available from: http://www.cwejournal.org/?p=1244
Download article (pdf)
Citation Manager
Publish History
Select type of program for download
| Endnote EndNote format (Mac & Win) | |
| Reference Manager Ris format (Win only) | |
| Procite Ris format (Win only) | |
| Medlars Format | |
| RefWorks Format RefWorks format (Mac & Win) | |
| BibTex Format BibTex format (Mac & Win) |
Article Publishing History
| Received: | 2011-04-10 |
|---|---|
| Accepted: | 2011-05-08 |
Introduction
Water is very vital for nature and can be a limiting resource to men and other living beings. Without a well-functioning water supply, it is difficult to imagine productive human activity be it agriculture or livestock. Extensive studies on water quality have been carried out by various workers (Majumdar and Gupta 2000; Dasgupta and Purohit 2001; Khurshid et al., 2002; Sujatha and Reddy 2003; Aravindan et al., 2004, 2010; Sreedevi 2004; Sunitha et al., 2005; Subba Rao 2006, Shankar et al., 2010, 2011). The objectives of the paper assess the groundwater quality and suitability of groundwater for irrigation and drinking were judged and major factors affecting water quality were assessed.
Study Area
The study area forms the Paravanar River sub basin, about 880km2 in area and lies between longitude 11°18' to11°45' and latitude 79°15' to 79°45' (Fig. 1). The northern and southern boundaries of the basin are defined by the Gadilam river basin in the north, Vellar basin in the south and Bay of Bengal in the east. A tropical climate prevails in the study area and the average annual rainfall is 1,162 mm. The study area includes three opencast lignite mines (Mines I, IA and II), associated with three thermal power plants that are operated by Neyveli Lignite Corporation Ltd. (NLC) & STCM – LFPP (STCMS – Lignite firing power plant) at Uttangal, Neyveli-5. The study area is underlined by geological formations, ranging in age from the Tertiary to recent alluvium sediments (Fig. 2). As geological structures control the occurrence and movement of groundwater, the geological map of the study area was checked with field investigations and with the help of geological map of the Cuddalore District, which was published by Geological Survey of India (2001). The major soil types found in this basin are Inceptisol, Entisol, Alfisol and Vertisol.
Material and Methods
Major Elements were analyzed from 35 groundwater samples collected during pre monsoon (2008) from bore wells of Paravanar River Sub-Basin (Fig. 3). The samples were collected after 10 min of pumping and stored in Poly Ethylene bottles at 10°C. Immediately after sampling, pH and electrical conductivity were measured in the field. Total dissolved solids (TDS) were calculated from Ec with cation factor of multiple 0.64 (Brown, Skougstand, & Fishman, 1970). Water samples collected in the field were analysed for chemical constituents such as sodium, potassium, calcium, magnesium, chloride, bicarbonate, sulphate, nitrate, fluoride and total dissolved solids (TDS), in the environ hydrology laboratory of Geology department, Annamalai University of using the standard methods as suggested by the American Public Health Association (APHA 1995). The analytical results were evaluated in detail and compared with water quality guidelines of WHO (1984).
Results and Discussion
Drinking Water Quality Standards
The analytical results of physical and chemical parameters of the groundwater of the present study are shown in (Table 1). All the parameters were compared with the standard guideline values as recommended by the WHO for drinking and public health purposes (Table 2). The table shows the most desirable limits and maximum allowable limits of various parameters. The concentrations of cations and anions are within the maximum allowable limits for drinking except a few samples.
Hydrogen Ion Concentration (pH)
In the study area, very lowest pH value of 6.3 has been observed at Terkumelur and the highest value of 7.7 is found at Ayyampettai. Most of the samples are within the range of 6.5 to 7.3 in Paravanar river Sub-basin. The condition of groundwater is moderately alkaline to acidic in almost all parts of the study area during the pre-monsoon periods.
Total Dissolved Solids (TDS)
The TDS of the groundwater samples ranges from 43.52 ppm to 1094.4 ppm. The maximum permissible quantity is 2000 ppm (WHO, 1983). The TDS values of all the water samples are with permissible limit of 2000 mg/L. In the basin, locations in an around Kummadimulai, Sattapadi and Alappakkam areas has shows concentration more than 1000 ppm value in TDS. It means, water has no problem as for as its suitability for drinking and irrigation purpose.
Irrigation Water Quality Standards Electrical Conductivity (EC)
In the study area, the measured Ec values ranges between 68 – 1710 microsiemens/cm in the groundwater samples. The highest value of 1710 microsiemens/cm is found to occur in the sample near to the coast. In SE part of the study area at Alapakkam and adjacent to SIPCOT industrial complex the doubtful water class was found to occur regarding the concentration of EC to represent the connate nature of groundwater adjacent to the coast to conform the increasing age. Results indicate that almost all the water samples are within the permissible limits of 2250 microsiemens /cm.
Sodium Absorption Ratio (SAR)
The sodium/alkali hazard is typically expressed as the sodium adsorption ratio (SAR). This index quantifies the proportion of sodium (Na+) to calcium (Ca2+) and magnesium (Mg2+) ions in a sample. Sodium concentration is important in classifying the water for irrigation purposes because sodium concentration can reduce the soil permeability and soil structure (Todd 1980; Domenico and Schwartz 1990). The sodium adsorption ratio values for each water sample were calculated by using following equation (Richard 1954).
SAR= [Na+] / {([Ca2+] + [Mg2+]) / 2}1/2
Where the concentration are reported in milligrams per liter. Sodium hazards are very low, and the groundwater can be used on most crops for irrigation purposes. Generally high concentrations of bicarbonate and carbonate are predominant anion in the alkali soils, and chloride and sulfate are the predominant anion in the saline soils. Based on sodium percentage, the prominent groundwater samples are suitable for irrigation except a two samples (Table 3).
Residual Sodium Carbonate
In water having high concentration of bicarbonate there is tendency for calcium and magnesium to precipitate as carbonate. To qualify these effect experimental parameters termed as residual sodium carbonate (Eaton 1950) was used. Residual sodium carbonate (RSC) is calculated as follows:
RSC= (CO32- + HCO3 -) – (Ca2+ + Mg 2+)
All the samples fall in these are good category except two samples (Table 3). The RSC in the study area ranges from -9 to 3.4 during the pre-monsoon seasons.
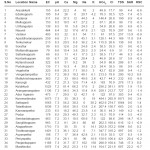 |
Table 1: Chemical parameter of groundwater samples in Paravanar Sub-basin (Pre -monsoon) Click here to View table |
Gibbs Diagram
The groundwater quality for drinking and irrigation purposes was assessed based onWHO(1984), standards. The quality of groundwater is significantly changed by the influence of weathering and anthropogenic inputs. The Gibbs diagram is widely used to establish the relationship of water composition and aquifer lithological characteristics (Gibbs 1970). Three distinct fields such as precipitation dominance, evaporation dominance and rock– water interaction dominance areas are shown in the Gibbs diagram (Fig. 4). The predominant samples fall in the rock– water interaction dominance and few samples evaporation and precipitation dominance field of the Gibbs diagram. The rock–water interaction dominance field indicates the interaction between rock chemistry and the chemistry of the percolation waters under the subsurface.
Gibbs ratio I (for anion) = Cl”/ ( Cl”+HCO3" )
Gibbs ratio II (for cation) = Na++K2+/(Na+ + K2++Ca2+)
Piper Trilinear Diagram
The Piper Trilinear Diagram (Piper 1953) is used to infer hydro-geochemical facies. Chemical data of representative samples from the study area are presented by plotting them on a Piper-tri-linear diagram for pre -monsoon .The plot shows that most of the groundwater samples fall in the field of mixed Ca–Mg–Cl type of water (Fig. 5). Some samples are also representing Ca–Cl and Na–Cl types. From the plot, alkaline earths (Ca2 and Mg2) significantly exceed the alkalis (Na and K) and strong acids (Cl and SO4) exceed the weak acids (HCO3 and CO3).
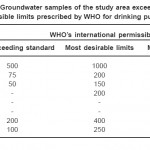 |
Table 2: Groundwater samples of the study area exceeding the permissible limits prescribed by WHO for drinking purposes Click here to View table |
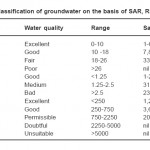 |
Table 3: Classification of groundwater on the basis of SAR, RSC and EC Click here to View table |
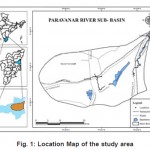 |
Figure 1: Location Map of the study area Click here to View figure |
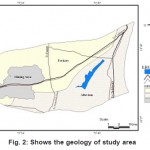 |
Figure 2: Shows the geology of study area Click here to View figure |
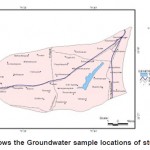 |
Figure 3: Shows the Groundwater sample locations of study area Click here to View figure |
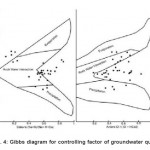 |
Figure 4: Gibbs diagram for controlling factor of groundwater quality Click here to View figure |
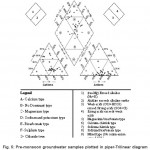 |
Figure 5: Pre-monsoon groundwater samples plotted in piper-Trilinear diagram Click here to View figure |
Conclusion
The concentrations of cations and anions are within the maximum allowable limits for drinking except a few samples. The suitability of water for irrigation is evaluated based on SAR, RSC and salinity hazards. Most of the samples in Paravanar sub basin fall in the suitable range for irrigation purpose either from SAR, RSC values. The type of water that dominates in the study area is Ca-Mg-Cl type during pre-monsoon seasons of the year 2008, based on hydrochemical facies. From the plot, alkaline earths (Ca2 and Mg2) significantly exceed the alkalis (Na and K) and strong acids (Cl and SO4) exceed the weak acids (HCO3 and CO3). Gibb’s diagram reveals that most the groundwater sample fall in the rock dominance field. The rock–water interaction dominance field indicates the interaction between rock chemistry and the chemistry of the percolation waters under the subsurface.
References
- APHA Standard methods for the examination of water and wastewater, 19th edn. American public Health Association, Washington, DC. (1995).
- Aravindan.S, Shankar.K, Poovalinga Ganesh.B and Dharani Rajan.K, “Hydrogeochemical mapping of in the hard rock area of Gadilam River basin, using GIS technique”, Tamil Nadu, Indian Journal of Applied Geochemistry. 12(2): 209-216 (2010).
- Aravindan. S. Manivel, M. and S.V.N. Chandrasekar. “Ground water quality in the hard rack area of the Gadilam river basin, Tamil Nadu” Journal of Geological Society of India, 63(6): 625-635 (2004).
- Brown, E., Skougstand, M. W., & Fishman, M. J. Methods for collection and analyses of water samples for dissolved minerals and gases. Techniques of Water Resources Investigation of the US Geological Survey 5.(1970).
- Domenico, P. A., & Schwartz, F. W. Physical and Chemical Hydrology. New York: John Wiley and Sons. (1990).
- Dasgupta, A. M., & Purohit, K. M. Status of surface and groundwater quality of Mandiakadar—Part II: Agricultural utilities. Pollution Research, 20(2):219-225 (2001).
- Gibbs, R. J., Mechanism controlling world water chemistry. The Sciences, 170: 795-840 (1970).
- Khurshid, S. H., Hasan, N., & ZaheeruddinM. Water quality status and environmental hazards in parts Environ Monit Assess of Yamuna–Karwan sub-basin of Aligarh– Mathura district, Uttar Predesh, India. Journal of Applied Hydrology, 14(4): 30-37 (2002).
- Majumdar, D., & Gupta, N. Nitrate pollution of ground water and associated human health disorders. India Journal of Environmental Health, 42(1): 28-39 (2000).
- Piper, A. M. A graphic procedure I the geo-chemical interpretation of water analysis, USGS Groundwater Note no, 12. (1953).
- Richards LA (ed) Diagnosis and improvement of saline and alkali soils, USDA Handbook no. 60, Washington, 160 pp. (1954).
- Shankar. K, S.Aravindan and S.Rajendran, “Hydrogeochemistry of the Paravanar River Sub - basin, Cuddalore District, Tamil Nadu” E-Journal of Chemistry. 8(2): 835-845 (2011).
- Shankar.K, S.Aravindan and S.Rajendran, “GIS based Groundwater Quality Mapping in Paravanar River Sub- Basin, Tamil Nadu, India”, International Journal of Geomatics and Geosciences. 1(3): 282-296 (2010).
- Sreedevi, P. D. Groundwater quality of Pageru river basin, Cuddepah district, Andhra Pradesh. Journal of the Geological Society of India, 64(5): 619-636. (2004).
- Subba Rao, N. Seasonal variation of groundwater quality in a part of Guntur district, Andhra Pradesh, India. Environmental Geology, 49: 413-429 (2006).
- Sujatha, D., & Reddy, R. B. Quality characterization of groundwater in the south-eastern part of the Ranja Reddy district, Andhra Pradesh, India. Environmental Geology, 44(5): 579-586 (2003).
- Sunitha, V., Sudarsha, V., & Rajeswara Reddy, B. Hydrogeochemistry of groundwater, Gooty area, Anantapur district, Andhra Pradesh, India. Pollution Research, 24(1): 217–224. (2005).
- Todd, D. K. Groundwater Hydrology, 2nd edn. New York: John Wiley and Sons, (p. 535). (1980).
- WHO, Guidelines to drinking water quality. World Health Organisation, Geneva, 186 (1984).
- Wilcox, L. V. Classification and use of irrigation water (p. 19). U.S. Department of Agriculture circular 969, Washington DC, U.S. Department of Agriculture. (1955).


