Statistical analysis of solar-wind hybrid system using SYSTAT software
Prashant Baredar1 * , Bhupendra Gupta3 , Mukesh Pandey2 and Priyanka Sharma1
1
Laxmi Narain College of Technology,
Bhopal,
462 021
India
2
University Institute of Technology,
Rajeev Gandhi Technological University,
Bhopal,
462 026
India
3
Government Engineering College,
Jabalpur,
India
DOI: http://dx.doi.org/10.12944/CWE.4.1.15
Energy plays an indispensable role in modern society. We all depend on a constant and reliable supply of energy - for our homes, businesses and for transport. Most of the renewable energy comes either directly or indirectly from sun and wind and can never be exhausted. It can be expected that possible applications of hybrid systems could be considered for the efficient utilization of these resources round the year together with possibilities of obtaining Carbon credits in the Carbon Trading. In this research paper, experimental data consisting of hourly records over a specified period were recorded in the Energy Park of UIT-RGPV Bhopal for a 1.6.kW SPV- Wind Hybrid System and Feasibility analysis is done using SYSTAT software.
Copy the following to cite this article:
Baredar P, Gupta B, Pandey M, Sharma P. Statistical analysis of solar-wind hybrid system using SYSTAT software. Curr World Environ 2009;4(1):107-112 DOI:http://dx.doi.org/10.12944/CWE.4.1.15
Copy the following to cite this URL:
Baredar P, Gupta B, Pandey M, Sharma P. Statistical analysis of solar-wind hybrid system using SYSTAT software. Curr World Environ 2009;4(1):107-112. Available from: http://www.cwejournal.org/?p=903
Download article (pdf)
Citation Manager
Publish History
Select type of program for download
| Endnote EndNote format (Mac & Win) | |
| Reference Manager Ris format (Win only) | |
| Procite Ris format (Win only) | |
| Medlars Format | |
| RefWorks Format RefWorks format (Mac & Win) | |
| BibTex Format BibTex format (Mac & Win) |
Article Publishing History
| Received: | 2009-03-02 |
|---|---|
| Accepted: | 2009-04-20 |
Introduction
There is rising need for alternate and renewable sources of energy, especially in developing countries, whose progress and economic growth may strongly be indexed to its development. With the ever increasing growth in energy consumption and rapidly depleting fossil fuel reserves, it is feared the world will soon exhaust its fossil fuel reserves. The electrification level in rural areas in south East Asia is about 51%, compared to 90% in urban areas. (Shrestha RM, 2004) It is estimated that wind power in many countries is already competitive with fossil fuel and nuclear power if social/environmental costs are considered. (Beurskens, 2001).
This paper provides a framework for understanding correlation between two power sources. The objective of the current work is to provide a way of using and relating continuous renewable energy sources. The hybrid system is a combination of two energy system or power system. In hybrid system use two or a more fuels for the same device. It is a continuous power generation system for time when intermittent renewable resources, such as wind and solar, are unavailable. The hybrid system provides continuous uninterrupted power supply throughout the year. As the availability of the above power sources is mainly depend on the environment condition. And due to the complementary nature. Only one power source available at a time. The hybrid system provide stable output in case of fluctuating source and it is minimizes the dependence of the output due to seasonal change. Hybrid system can make more reliable sense than that of the wind, solar or biomass alone. (Ulgen K., Hepbasli Arif2003)
Methodology
In the proposed renewable work various statistical analysis methods are used to find out mean variance and standard deviation result the data related to solar and wind power resources is collected from whiter and monitoring seasons installed at Rajiv Gandhi Proudyogiki Vishwavidyalaya (RGPV) Bhopal .the data which we obtained analyses by using Systat software is generally used for plotting various interactive graph, mathematical modeling for performing various statistical analysis. It is very user friendly software is that the potential of power sources of solar and wind is adequate at Bhopal site .but problem is that both are complimentary (only one power source available at time) hence to obtain smooth and sustainable power source data with respect to mean value throughout the year is to be analyses. This analysis will provide roadmap guide line to the future research work. Sigma Stat 3.5 provides a wide range of powerful yet easy-to-use statistical analyses specifically designed to meet the needs of research scientists, engineers, and statisticians, without requiring in-depth knowledge of the math behind the procedures performed. Sigma Stat® 3.5 provides a wide range of powerful yet easy-to-use statistical analyses specifically designed to meet the needs of research scientists, engineers, and statisticians, without requiring in-depth knowledge of the math behind the procedures performed. This chapter describes the organization of this manual and introduces you to most Sigma Stat features. It also covers some basics about using Sigma Stat.(www.systat.com) The correlation between the Solar Power availability and the Wind Power availability can best be explained by calculating the correlation coefficient. (Togrul, M.C. Tris and I.E. True. 1996)
 |
Figure 1: kW solar, wind hybrid system Click here to view figure |
Experimental
A typical solar PV wind hybrid system is having following major components.
- Solar photovoltaic modules
- Mounting structures for solar Photovoltaic modules
- Junction Boxes
- Solar charge controller
- Photovoltaic Batteries
- Wind generator
- Wind charge controller
- Inverter unit
- Installation kits
- Interconnecting cables
- Earthing kit
Instrumentation used for data collection from the Solar- wind hybrid system includes Anemometer, Radiation Pyranometer, Temperature recorders and weather monitoring station etc. (Pecen Recayi etal 2004).
The existing 1.6 kW Solar - wind hybrid system installed at the Energy Park of RGPV is schematically shown at Fig.1. The system consists of 0.3 kW solar arrays and 1.3 kW wind electric generator. The battery bank is of 75 Ah and the inverter together with Power conditioning unit provides AC out put at 220 V and 50 Hz. The output from the system is fed to street lighting system of the university providing sustainable power for over 8 hours every night.
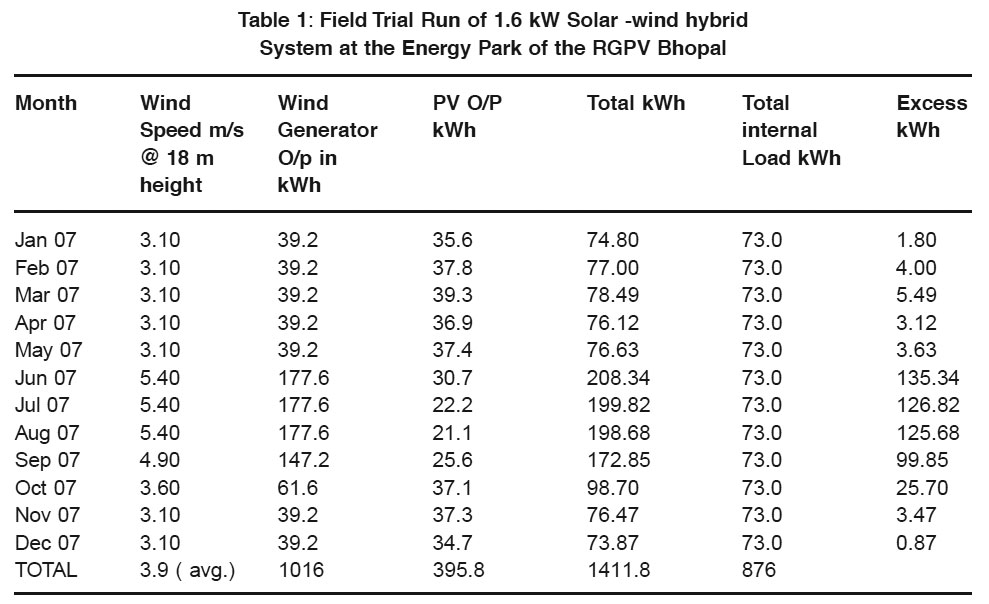 |
Table 1: Field Trial Run of 1.6 kW Solar -wind hybrid System at the Energy Park of the RGPV Bhopal Click here to view table |
Efforts are under way to couple this system with 10 kW biomass Gasifier and a Fuel cell for various R & D projects being taken under the guidance of Ministry of Non Conventional Energy Sources (MNES). For long time operations and consistent records, daily and even monthly averages are better representative figures. (Gunes, M. 2001).
Operation of the System
The Solar radiation falling on the modules is converted in to electricity by photovoltaic principle. The generated current is used to charge the battery bank. Energy generated will be maximum when the solar insolation is maximum vice versa. Accordingly average peak sunshine hours of 5.0 Peak hours/ day have been considered. Energy generated by the module is stored in the battery bank by charging the battery bank. Solar charge controller accomplishes this. The Solar charge controller does the function of charging the battery bank along with preventing battery from overcharged or over discharged. Wind generator on the other side also charges same battery bank through wind charge controller. Interface consisting of a step up gear and a coupling transmits the rotary mechanical energy to an electrical generator. (M. Akhlaque Ahmad, 2006) The output of generator is connected either to load or power grid. The purpose of controller is to sense wind speed, wind direction, shafts speeds and torques, output power and generator temperature. A weather monitoring station is installed in Energy Center University Institute of Technology Bhopal. This gives various data such as wind speed, wind direction, temp, rainfall condition etc. The battery bank is sized to provide load energy requirement for minimum of 3 days of autonomy (2 no sunshine/cloudy days) the battery bank shall be discharged up to 80% of depth of discharge. Energy stored in the battery bank is DC type. This DC energy is inverted using an inverter to get AC supply (Hepbasli A, 2004).
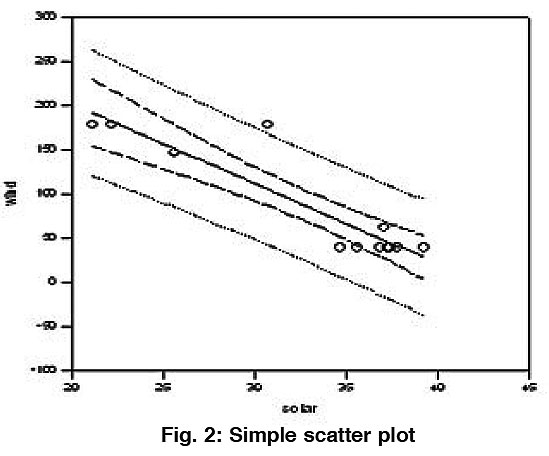 |
Figure 2: Simple scatter plot Click here to view figure |
The set up of hybrid system consist of two power sources solar and wind. These two systems are combine and generating power throughout the year. The solar and wind data is collected from Field Trial Run of 1.6 kW Solar -wind hybrid System at the Energy Park of the RGPV Bhopal.
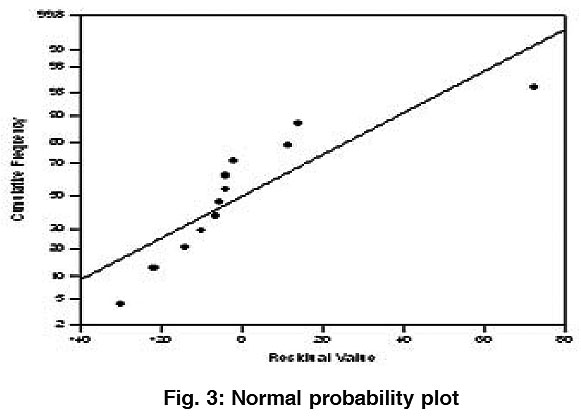 |
Figure 3: Normal probability plot Click here to view figure |
These sources are combined. Which is generate AC voltage and then can be transfer in DC voltage to charge the battery. The controller protects battery from overcharging or a discharging. the inverter used to change DC voltage to AC voltage depending upon using power at different sources. (Ding J, Buckeridge J S, 2000)
Statistical Analysis
Mean
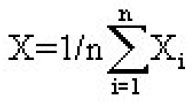
The mean is the average value for a column. If the observations are normally distributed, the mean is the center of the distribution. The arithmetic mean, or average, of all the cells in the column, excluding the missing values. This is defined by:
​​Standard Deviation
Is a measure of data variability about the mean. The sample standard deviation is defined as the square root of the mean of the square of the differences from their mean of the data samples xi in the column. Missing values are ignored
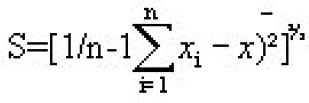
Standard Error
The standard error is the standard deviation of the mean. It is the sample standard deviation divided by the square root of the number of samples. For sample standard deviation

The mean square within groups (also called the residual or error mean square)is

The mean square within groups (also called the residual or error mean square

F Statistic
The F test statistic is the ratio:

Results and Discussion
Multiple Linear Regressions
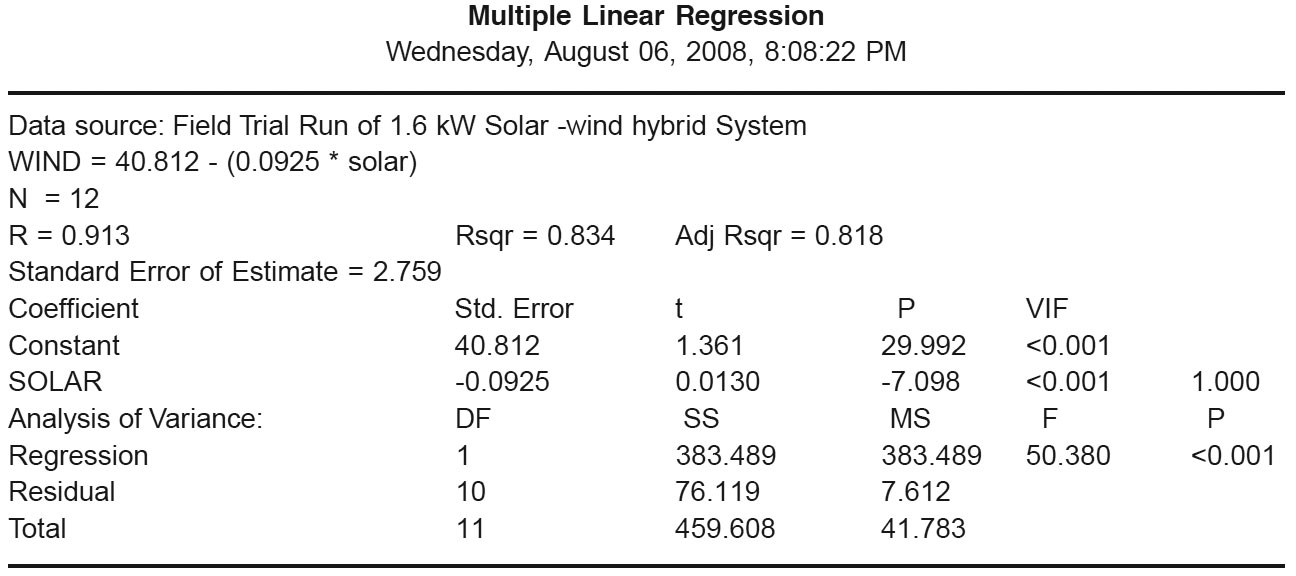
Multiple regressions are a mathematical technique used in both technical and fundamental analysis. The technique uses a number of variables to predict some unknown variable. If for instance it was felt that the growth rate, debt to equity ratio and the yield of a stock might be useful in predicting a valid range for a price earnings ratio, then multiple linear regression would be used by a financial analyst with a range for each input, producing a range of possible Price/Earnings ratios that might be supported by the current and projected fundamentals of a stock or stocks in question (Ray M., Sharma H.S. 2001)
 |
Multiple Linear Regression Click here to view table |
The dependent variable can be predicted from a linear combination of the independent variablesSOLAR <0.001
All independent variables appear to contribute to predicting (P < 0.05).
Normality Test
Passed (P = 0.474)
Constant Variance Test
Passed (P = 0.117)
Power of performed test with alpha = 0.050: 0.996
Conclusion
In this paper taking Solar -wind hybrid energy system consisting two or more renewable energy and provide good stability of power. And due to the complementary nature. Only one power source available at a time. This software correlates the two power source solar and wind and gives a positive result for its relation. And give all results are Passed like Normality Test, Constant Variance Test, etc. The collected data from Field Trial Run Solar -wind hybrid System at the Energy Park of the RGPV Bhopal analyzed in order to plan for the structure of the system.
References
- Shrestha RM, Kumar S, Sharma S, Todoc MJ. Institutional reforms and electricity access lessons from Bangladesh and Thailand. Energy for Sustainable Development; (2004) 8(4): 41-53.
- Beurskens, J., Jensen, P.H., Economics of wind energy prospects and directions. Renewable Energy World (2001) 4(4): 103-121.
- Hepbasli Arif, Ozgener Onder, 'Turkey's renewable energy sources: Historical development' Energy sources. (2004) 26: 961-969.
- Ding J, Buckeridge J S, 'Design Considerations for a sustainable hybrid energy system' IPENZ Transactions, (2000) 27(1/ EMCh): 1-5.
- Ray M., Sharma H.S., A text book of mathematical statistics, Agra, Ram Prasad and sons (2001).
- Gunes, M., Analysis of daily total horizontal solar radiation measurement in Turkey. Energy Sources (2001) 23: 563-570.
- Pecen Recayi, Salim Md, & Mr. Zora Ayhan., 'A lab view based instrumentation system for a wind- solar hybrid power station 'in Journal of Industrial Technology, (2004) 20(3): 2-7.
- Ulgen K.,Hepbasli Arif, 'A Study on evaluating the power generation of solar-wind hybrid system in Izmir,Turkey' Energy Sources (2003) 5: 241-252.
- Togrul, M.C. Tris and I.E. True., Correlations of monthly-average daily global, diffuse and metrological data. Energy Convers. Mgmt (1996) 30:1577-1584.
- M. Akhlaque Ahmed, Firoz Ahmad and M. Wasim Akhtar, Assessment of Wind Power Potential for Coastal Areas of PakistanTurk J Phys., (2006) 30 1(9).


