Mangrove Ecosystems as Blue Carbon Sinks in Mitigating Rising Global Co2 Emissions: A Review Study in India
Mrudula Elayi
 , Sherly Williams
*
and Sabu Joseph
, Sherly Williams
*
and Sabu Joseph
1
Department of Environmental Sciences,
University of Kerala,
Thiruvanathapuram,
Kerala
India
http://dx.doi.org/10.12944/CWE.21.1.4
Copy the following to cite this article:
Elayi M, Williams S, Joseph S. Mangrove Ecosystems as Blue Carbon Sinks in Mitigating Rising Global CO2 Emissions: A Review Study in India. Curr World Environ 2026;21(1). DOI:http://dx.doi.org/10.12944/CWE.21.1.4
Copy the following to cite this URL:
Elayi M, Williams S, Joseph S. Mangrove Ecosystems as Blue Carbon Sinks in Mitigating Rising Global CO2 Emissions: A Review Study in India. Curr World Environ 2026;21(1).
Download article (pdf)
Citation Manager
Publish History

Introduction
Oxygen (20.95%) and nitrogen (78.09%) dominate the Earth’s atmosphere, while carbon dioxide (CO2), though present at only about 0.04%, plays a disproportionately critical role in regulating the global climate. Carbon is a fundamental element of life and circulates continuously among major reservoirs, including the atmosphere, oceans, terrestrial ecosystems, and marine biota, through processes such as photosynthesis, respiration, dissolution, and carbonate precipitation.1 However, anthropogenic activities, particularly the large-scale combustion of fossil fuels and land-use changes, have significantly altered the natural carbon cycle, leading to elevated atmospheric greenhouse gas (GHG) concentrations and accelerating climate change.
The Intergovernmental Panel on Climate Change (IPCC) emphasizes that rapid, sustained, and large-scale reductions in GHG emissions are essential to limit global warming to 1.5°C above pre-industrial levels. In alignment with this objective, Sustainable Development Goal 13 (SDG 13) calls for urgent climate action, including substantial emission reductions by 2030.2 Beyond emission control, carbon sequestration in soils, vegetation, oceans, and geological formations is increasingly recognized as a critical strategy to offset atmospheric CO2. In this context, mangrove ecosystems have gained prominence for their exceptional capacity to capture and store carbon, underscoring their importance in climate change mitigation efforts.
Mangrove habitats can store and retain an extensive amount of carbon. In addition to biomass carbon, mangrove sediment has higher quantities of carbon than bare non-mangrove soil. The biomass and sediment of mangrove forests are significant carbon sinks in the tropical coastal zone. However, rising soil temperatures triggered by global warming will harm the capacity of the mangrove habitat to sequester carbon, as reflected in the negative correlation between temperature and carbon storage.3 Mangrove habitats are considered to be a potentially viable reservoir for prolonged organic carbon storage due to their appealing qualities, such as immediate sedimentation, productivity, and low sediment respiration ratio. The importance of carbon storage in mangroves has frequently been disregarded, either underestimated or exaggerated.
Sources of CO2 emission
Both natural and anthropogenic processes contribute to the atmospheric release of CO2. Natural emissions, including the respiration of plants, animals, and microorganisms, are responsible for 440 gigatonnes of CO2 emissions per year. But each year, photosynthesis takes up enormous volumes of CO2 from the atmosphere. Every year, the world's seas absorb about 340 gigatonnes of CO2, but they also emit 330 gigatonnes of CO2.4 The other causes of natural CO2 emissions are the carbon cycle (soil, ocean, and air), volcanic eruptions that release ash into the atmosphere, clearing of forest covers as a result of natural disasters, including hurricanes, cyclones, forest fires, volcanic eruptions, and tectonic plate movements.5 The primary sources of artificial CO2 emissions into the atmosphere were power stations, clothing, plastic, paper, metal, and vehicle industries, disposal of trash, incineration, forest destruction, urbanisation, firewood combustion, combustion of plastic waste, and fossil fuel combustion.6 The main source of CO2 emissions, accounting for around 146% of global emissions, was the electricity generation industry. The automobile sector releases approximately 121% of CO2, followed by industries (66%), urbanisation (45%), deforestation (45%), agriculture (28%), and building construction (27%). The latter is primarily responsible for 76% of the CO2 that is released indirectly into the atmosphere due to power consumption during building construction. A higher population results in the release of 61% of CO2 to meet daily demands, which indirectly contributes to the elevated CO2 levels in the atmosphere. In 2030, the consumption of fossil fuels alone is expected to generate 111% of CO2 emissions.7
Global Carbon Emissions for the Past Years
The world is currently coping with the problem of global warming, which is largely caused by human activity, especially the overuse of fossil fuels for energy. In consequence of this, a huge amount of gases that are detrimental to the climate have been released into the atmosphere. These emissions worsen climate change by creating a layer of gases that builds up at the lower atmosphere's surface. This layer captures reflected solar energy from the planet, thereby increasing its surrounding temperature.8 Since CO2 is considered the primary cause of the greenhouse effect, the growing amount of emissions worldwide is cause for grave concern. Consumption of fossil fuels and degradation of forests are two contributors to GHGs.8
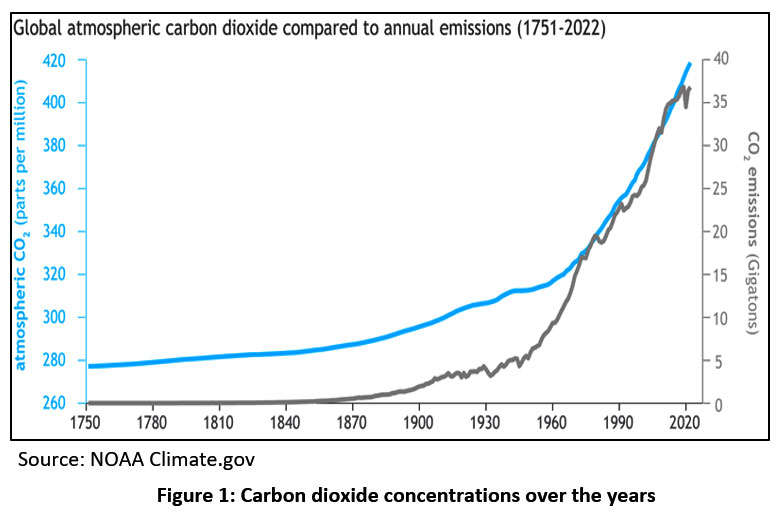 | Figure 1: Carbon dioxide concentrations over the years
|
Source: NOAA Climate.gov
The atmospheric concentration of CO2 had risen by 50% before the onset of industrialisation. In the past 60 years, the pace of atmospheric CO2 rise has been around 100 times greater than previous natural increases. The global average atmospheric CO2 in 2022 was 417.06 ppm, according to the yearly report from NOAA's Global Monitoring Lab. This was a high record. The increase in atmospheric CO2 from 2021 to 2022 was 2.13 ppm.9 According to NOAA's Global Monitoring Lab's annual analysis, the mean global amount of atmospheric CO2 levels in 2024 set a new record of 422.8 parts per million (ppm). The biggest one-year increase ever recorded occurred in 2024, when it increased by 3.75 ppm. Experts on the carbon cycle predict that, over the 2011–2020 decade, natural "sinks" absorb carbon out of the atmosphere. It absorbs the equivalent of around half of the CO2 emitted annually. Every year, the total concentration of CO2 in the atmosphere increases (Fig.1) as human activities generate more CO2 than natural sinks can sequester.10
Consequences of higher atmospheric CO2 concentration
The greenhouse effect is being amplified due to GHG emissions, particularly CO2 from both natural and anthropogenic sources. Decreased CO2 emissions are essential to averting catastrophic changes to the climate, which is essential for the survival of mankind.4 The primary factor causing climate change over time is an increase in CO2 emissions into the atmosphere. The elevated levels of CO2 in the atmosphere have disrupted the natural equilibrium and significantly affected flora, fauna, and humans.
As CO2 concentration rises, precipitation rises as well, indicating an enhanced regional hydrological cycle. Two opposing processes that contribute to this positive precipitation are the radiative and the physiological impacts of CO2. Direct CO2 fertilisation results boost productivity in the grassland region where C4 plants prevail. The photosynthetic saturation assumption limits the direct enhancement of the carbon assimilation rate. However, productivity increases due to both the increase in CO2 induced precipitation and the improvement in water-use efficiency.11
Methods to diminish atmospheric CO2 levels
Planting trees is one of the most well-known methods of removing carbon from the atmosphere. Direct air capture is another cutting-edge method that takes CO2 out of the air and stores it underground. The natural process of photosynthesis in plants allows them to absorb CO2 from the environment. Plants are particularly effective at sequestering this gas. By utilising photosynthesis to transform atmospheric CO2 into carbon stored in wood and soil, increasing, restoring, and maintaining tree cover can promote increased uptake of carbon.12 Although sequestering CO2 in seas and terrestrial geological sites has been extensively studied and is now a crucial part of global CO2 mitigation efforts.
The concept of "biotic sequestration" is based on the regulated extraction of CO2 from the surrounding environment by higher flora and microorganisms. The sequestration of terrestrial and biotic carbon offers numerous further benefits. Among these, the following are significant: (i) enhanced soil and water resource quality; (ii) reduced ecosystem nutrient deficits; (iii) diminished soil erosion; (iv) enhanced animal settings; (v) greater water preservation; (vi) revitalised deteriorated soils; and (vii) improved input usage efficacy.13 Mangroves and coastal wetlands capture carbon on an annual basis at a rate ten times higher than that of mature tropical forests (Fig.2).
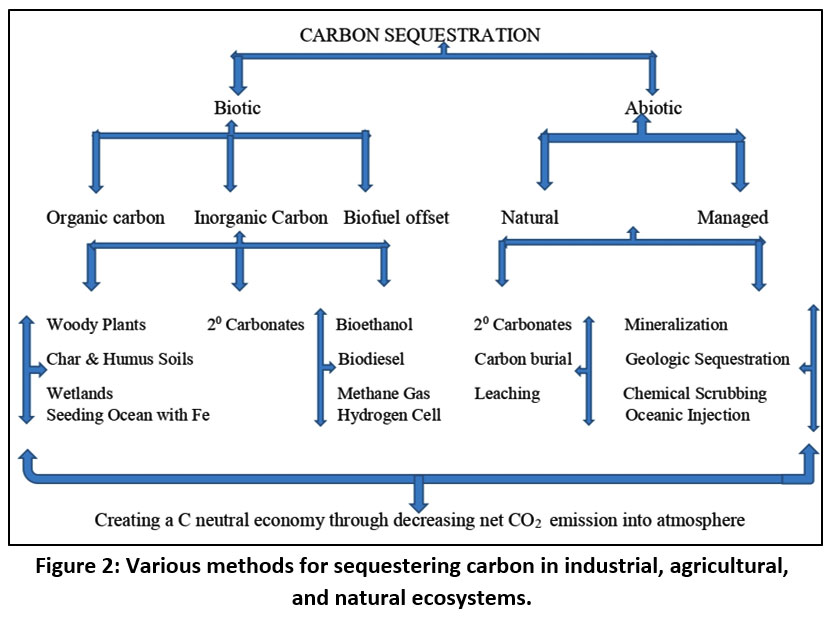 | Figure 2: Various methods for sequestering carbon in industrial, agricultural, and natural ecosystems.
|
Mangrove Ecosystem
Mangroves are often extremely productive forests, and a substantial amount of the soil carbon in these ecosystems originates from plants.14 They are true ecotones, utilising variables from both the marine and terrestrial biomes. However, they also possess an array of peculiar anatomical and physiological modifications, which include viviparous embryos, mechanisms that help them survive salt, and pneumatophores, which allow the trees to breathe in oxygen-deprived, submerged sediments.15 Like other woody plants, mangroves grow new leaves, reproductive systems, stems, branches, and root tissues. They maintain their present tissues, make store reserves, and protect themselves with chemicals. Mangroves emit about half of the CO2 they take in back into the surrounding environment through respiration above and below ground.15,16 Several factors determine how much fixed carbon is spread evenly throughout trees, such as the amount of light, the number of species, the amount of nutrients and water, the amount of salt, the tides, the waves, the temperature, and the climate.16 According to a previous study on carbon allocation,17 mangroves are thought to store more carbon below ground than trees that grow on land. Mangroves have been found to have a greater average economic value than coral reefs, continental shelves, and open seas. They are only second to estuaries and seagrass meadows.18
Processes that foster the accumulation of Sediment in the Mangrove Ecosystem
Mangroves retain sediment and associated components, encompassing both inorganic and organic carbon. Their existence constantly supports the deposition of components. Mangrove carbon is directly added to the soil pool, and mass sediment accumulation rates increase to create carbon in the mangroves. Mangroves do produce carbon, and this carbon can also enter the environment through other channels, like microbial consumption. The carbon that is consumed is remineralised and either exported as dissolved inorganic carbon or released as CO2 back into the atmosphere. Further, tides export dissolved and particulate organic carbon, which might be mineralised, consumed, or deposited offshore. The mean carbon content in mangrove sediments is 2.2%, although it can fluctuate from 0.1% to over 40% based on its dry mass.14 While incoming bottom flow meets outgoing river flow, the unconsolidated sediments build up in response to the dynamics of the turbidity-dominant region. Particle flocculation and settlement in the moving zone are aided by tidal mixing and pumping. Tiny flocs and unconfined particles migrate downstream and mix with surrounding particulates after beginning particle flocculation at salinities of 1.19 A further benefit of the saline environment of healthy mangroves is that they might emit minimal amounts of other GHGs, which are far more potent than CO2, such as methane (CH4) and nitrogen oxide (N2O).20 Mangrove vegetation has a significant impact on sedimentation because it actively captures silt, clay, and organic components, rather than merely passively accumulating small fragments.19
Status of Mangrove Forest in India over the last decades
Mangrove wetlands cover approximately 147,000 km² (14.7 million hectares) globally, of which India accounts for 4991.68 km² (3.4%); globally, mangroves represent only about 2% of coastal/oceanic areas and roughly 5% of total wetland extent.21,22
The mangrove ecosystems of India can be roughly categorised into three classes: deltaic (on the east coast of the country), estuarine and backwater (on the west coast of the country), and insular (on the Andaman and Nicobar Islands).23 The Deltaic group is home to nearly 57% of mangroves, estuarine and backwater to 31%, and the Insular to 12%. In 2024, India occupied 4991.68 km2, making up roughly 3% of the global mangrove cover. However, when compared to the 2019 assessment, the nation's mangrove cover exhibited an overall increase in an area of around 16.68 km2.24,25 Mangrove forest distribution along Indian coasts varies greatly and is governed by physical factors like geography, atmospheric conditions, wave velocity, longevity, and the volume of rainwater influx. The topographic configuration of the east and west coasts is very different. Conversely to the East Coast's smooth slope, the West Coast's coastline strip is fairly narrow, which results in a divergence in the mangrove growth pattern.26 Near the west coast of the Arabian Sea, a considerable number of small rivers discharge enormous volumes of silt; deltas do not form, most likely because of the extreme energy circumstances. As a result, the mangrove wetlands on the East Coast are larger and have greater diversity of species than those on the West Coast. Mangroves are fringing and riverine due to the small intertidal areas with steep elevations.27
The largest formations of mangroves are found in the areas of the Indus, Sundarbans, and Mahanadi deltas, the Gulf of Kutch, and the Andaman and Nicobar group of islands. The Sundarbans delta in Bangladesh has a maximum delta area of 4050 km2.28 Among the world's biggest dry region mangrove forests, the Indus delta has a 1300 km2 surface area.29 More than 70% of India's mangrove coverage is located only in the swampy areas of the eastern coastline and the Gulf of Kutch on the northwestern coast. Except for a tiny patch (500 m2) at Minicoy, the Lakshadweep Island lacks mangroves and are unstable.30
According to FSI,25 the Sundarbans, the largest mangrove delta in the world, which spans Bangladesh and India, comprises approximately half (42%) of India’s mangrove vegetation (~2,100 sq. km). The Sundarbans mangrove forest’s extent, measured from the year 1970 to 2000, exhibits minimal net area change. In the 1970s, the mangrove forest covered 588696.5 ha; in the 1990s, it covered 59682.8 ha; and in the 2000s, it covered 58162.2 ha.31 The Sundarbans mangrove has shrunk by 13,089 hectares over the years 2000 to 2020 and is predicted to shrink by a further 29,387 ha over the years 2020 to 2050.32
Gujarat's mangroves are distributed across four regions (Kutch, the Gulf of Kutch, Saurashtra, and South Gujarat) and have the second-largest mangrove cover (1177 km²) in India, showing a constant rise in area up to 2021. In the early 1980s, the area covered by mangroves was less than 400 km2. With the help of several government restoration projects (including the Mangrove Conservation and Development Project from 1993 and the Excellent Conservation Project) as well as a private initiative (the Restoration of Mangrove Project from 2007), the extent of mangrove cover reached 1177 km2 in 2019 (23). Gujarat’s mangrove cover continues to be among the largest in India, but the latest FSI27 assessment shows a net reduction between 2021 and 2023 (= 36.39 sq km).
Ratnagiri block has 9.49 sq. km of mangroves covered in 2009, and 7.17, 7.56, and 6.52 sq. km in 1989, 1999, and 2004, respectively. In 2024 the mangrove cover in Ratnagiri district is approximately 30.50 sq.km based on the assessment of 2023.25 The Jaigad, Sakhartar, Bhatye, and Purnagad estuaries had the most extensive mangrove coverage, while the Varvade, Malgund, Nevare, Arey, Ranpar, and Ganeshgule estuaries had the least extensive mangrove coverage.33
The area of mangroves in the Godavari delta region of India decreased by approximately 36.6 km2 between 2002 and 2011, although there was a notable growth of 19.88 km2 between 2011 and 2017. The total area of mangroves was 213.03 km2 in 2002; by 2008, that number had dropped to 180.91 km2. The area covered by mangroves decreased to 176.43 km2 in 2011 and then climbed to 196.308 km2 in 2017. The net area of mangrove cover in the Godavari and Krishna region was 421.43 sq.km according to the FSI 2023 assessment.25 Mangrove deforestation and coastal erosion in the Godavari Delta have increased by 7.84 and 18.44%, respectively, over the last 15 years. The degradation of mangroves has a direct impact on coastal erosion.34
The principal mangrove wetlands in Tamil Nadu include the Gulf of Mannar, Pichavaram Mangroves, and Muthupettai Mangroves. The Cauvery River serves as the primary freshwater source for these mangrove wetlands. The mangrove environment in Tamil Nadu covers approximately 225 km, with Pichavaram, Cuddalore District, home to the largest and most pristine mangrove forests, covering an area of 1100 km.35 Merely 0.5% of the nation's total mangroves are found in the state of Tamil Nadu. The overall mangrove cover along Tamil Nadu's coast is 27.55 km2.36 The mangroves of Pichavaram are regarded as some of the healthiest in the world. In 1991, the Pichavaram mangrove covered an area of roughly 4.56 km2. In these extents of mangrove cover, 1.80 km2 was contributed by open mangrove and 2.76 km2 by dense mangrove. In the year 2000, the Pichavaram mangrove cover spanned 6.55 km2, of which 3.17 km2 was densely covered, and 3.38 km2 were open mangrove regions. On the other hand, the Pichavaram mangrove's overall spatial size in 2006 was around 7.06 km2. This includes 2.06 km2 of open mangrove and 5.0 km2 of dense mangrove.37 In 2010, the area of mangrove forest in Pichavaram was 13.5km2.38 Over 15 years, the Pichavaram mangrove exhibited a net rise of 11.41% (2000–2016). This is because the State Forest Department identified the causes of the destruction of mangroves and then implemented conservation measures.39 In 2023, the mangrove cover in Tamil Nadu, becomes 41.91 sq.km.25
Mangrove forest cover in Muthupettai in Tamil Nadu was quite low in 1975, covering an area of 20.1 km2 (2.94 %), and it expanded to roughly 31.9 km2 (4.66 %) in 1985. On the other hand, mangrove forests covered 35.9 km2 (5.25 %) in 1995. In 2005, there was a decrease in the mangrove forest. Mangrove forests left over after the tsunami tragedy covered 29.9 km2 (4.37%). It expanded in 2015 as a result of the strict mangrove management regulations.39
About 700 km² of mangroves were previously found along Kerala's coast. However, it reduced to 17 km 2 in 1991.40-42, and in 1994, a study revealed that the extent of mangrove forest area in Kerala was only 1,095 ha.43 The mangrove forest cover area shrunk to 1650 hectares in 2003; of those, 1450 ha are privately owned, and just 200 ha are under government or quasi-government organisation control as remnants of the past.44 According to research on the allocation and variety of mangrove species, the State government owned 1189 ha of Kerala's total mangrove area (2502 ha), whereas 1313 ha were privately owned.45 By the time the mangroves' ecological significance became apparent, their area had decreased from 700 km2 to roughly 9.45 km2.25 Kerala holds 44 rivers, and an enormous number of backwaters and estuaries experiencing wave activity; however, the state has a comparatively small amount of mangrove land (9 km2). Kannur district has the largest mangrove cover (1100 ha), Ernakulam (600 ha), and Kasaragod (315 ha), following closely behind. Thrissur (30 ha), Thiruvananthapuram (28 ha), and Malappuram (26 ha) were the three districts that represented the minimum extent. Valapattanam, Kunghimangalam, Kasargod-Nileswar, Kavvay, and Puthuvypin are the major mangrove-harbouring sites in the Kerala state, and the mangrove vegetation covers an area of around 6.63 km2.45 Mangrove habitats are generally considered to be the most degraded ecosystem in Kerala, India.46
As previously reported,47 a thorough analysis of the C stocks in Kerala's mangrove ecosystems, in the southwest tip of India, reveals that this area can store 139.82t C/ha within this particular environment. The northern region of Kerala was discovered to retain a comparatively greater amount of carbon than the other mangrove zones due to its greater tree density, soil carbon concentration, and biometric variations in size. 42% of the C stock in the vegetation and 58% of it in the soil pool were allocated to the region's mangrove ecosystem.
Unfortunately, over half of Kerala's mangrove forest is privately owned and are being destroyed for a variety of development-related reasons, including agriculture and aquaculture. 48 The legal preservation of existing mangroves and extensive restoration/rehabilitation of degraded/reclaimed areas have been key components of mangrove conservation over the past three decades.49
A significant asset for people has been their dependence on mangroves for a variety of goods and services. Mangrove loss will also negatively impact nearby coastal habitats, diminish biodiversity, lower the quality of coastal water, destroy fish and crab breeding environments, and alter near marine environments.50,51 As previously reported,52,53 the destruction of mangroves can also release significant amounts of stored carbon, aggravating trends in climate change and global warming.
Mangroves and Greenhouse Gas (GHG) Emissions
Mangrove sediments have been identified as producers of GHGs; however, the air circulations associated with these gases are not well understood, and their detrimental warming effect has rarely been taken into account when evaluating the prospective function of mangrove wetlands in mitigating rising temperatures.54 In addition to being a stronger CO2 sink, the mangrove ecosystem is also identified as a source of GHGs, including CO2, CH4 and N2O. And it has been demonstrated that anthropogenic nutrient inputs can further increase these gas emissions.55 The ecosystem's capacity to either mitigate or exacerbate atmospheric radiative forcing is evidenced by the exchange of GHGs between mangrove vegetation and the environment, highlighting the direct influence of these wetlands on global warming.56 The rising temperatures resulting from gas emissions were subsequently equilibrated with the CO2 sequestration rate of flora to evaluate the environmental cooling induced by mangrove wetlands, predicated on the interchange of GHGs between the mangrove vegetation and the surrounding environment.
Carbon sequestration in Indian mangroves for the last two decades
Mangroves serve as a unique carbon storage facility. The capacity of mangrove forests to sequester carbon depends upon the rates at which wood is produced, microbial respiration, and sediment storage.57 As previously reported,58 the mangrove vegetation sequesters 174 g-C m'2 of carbon annually on average.
Table 1: Amount of carbon sequestered in various mangrove forest covers in India.
Mangrove Cover | Year | Area of mangrove Cover (km 2) | Amount of C Absorption (Tg C) |
Sundarbans | 1970 | 5886.97 | 3.85 |
1990 | 5968.43 | 3.91 | |
2000 | 5816.42 | 3.81 | |
2011 | 4264 | 2.79 | |
2020 | 450.73 | 0.29 | |
Gujarat | 1980 | 400 | 0.26 |
2019 | 1177 | 0.77 | |
Ratnagiri | 1989 | 7.17 | 0.005 |
1999 | 7.56 | 0.005 | |
2004 | 6.52 | 0.004 | |
2009 | 9.49 | 0.006 | |
Godavari | 2002 | 213.03 | 0.14 |
2008 | 180.91 | 0.12 | |
2011 | 176.43 | 0.12 | |
2017 | 196.31 | 0.13 | |
Pichavaram | 1991 | 4.56 | 0.003 |
2000 | 6.55 | 0.004 | |
2006 | 7.06 | 0.005 | |
2010 | 13.5 | 0.009 | |
Muthupettai | 1975 | 20.1 | 0.001 |
1985 | 31.9 | 0.021 | |
2005 | 29.9 | 0.019 | |
Kerala | 1986 | 700 | 0.46 |
1991 | 17 | 0.01 | |
1994 | 10.95 | 0.07 | |
2003 | 16.5 | 0.011 | |
2014 | 25.02 | 0.016 | |
2019 | 9 | 0.006 |
Mangrove biomass is thought to store 4.03 pg of carbon globally, with 70% of that carbon occurring along coastal margins. As previously reported,59 anthropogenic emissions of GHGs jumped by 2.2% every year throughout the 2000–2010 decade, rising to 49 ± 4.5 Pg CO2 equivalent annually in 2010. The Sundarbans ecosystem functions as a complete sink for CO2, sequestering 2.79 Tg C annually, with living above- and below-ground biomass comprising over 96% of the sequestered carbon.60 In 2011, the Indian Sundarbans, which encompass 4264 km2, may take in 2.79 Tg C, or 0.64% of the nation's annual fossil fuel releases.61 Hence 1km2 mangrove forest cover can absorb 0.0006543 Tg C. Based on available data, we can calculate how much carbon is sequestered in various mangrove forest covers in India (Table 1).
Even though most carbon was unassociated with roots, assessment of carbon in Rhizophora mucronata and Avicennia marina in Vellar-Coleroon estuarine complex, India62 and Rhizophora apiculata and Bruguiera gymnorrhiza of Burmanallah coast, South Andaman, India revealed that a significant portion (75-95%) of tree carbon belowground was embedded in deceased, as opposed to alive roots. Further, the study revealed that as stand age increased, the size of the carbon pools in the sediment and decayed roots also grew.63
The knowledge and quantification of carbon dynamics within mangrove ecosystems have seen major scientific developments during the last 30 years. With this tangible advantage, mangroves are now recognised as sinks for CO2 in addition to sediments and nutrients.64 Compared to boreal, temperate, and tropical highland vegetation, mangroves in the Indo-Pacific area constitute the most carbon-dense tropical forests, possessing a mean carbon content of 1023 t C ha-1, predominantly sequestered in soils beyond 30 cm in depth.65 Mangroves tend to collect carbon rather quickly because the majority of belowground carbon is deposited in soil and dead roots rather than in living roots.62,63 The amount of retained carbon to compensate for lost fine roots and root hairs is much more than the 10-15% that belowground roots make up of the total tree biomass.66 It may be further reduced by the net effects of increased biomass production brought on by rising CO2 levels and increased soil organic matter degradation in response to warming climates.67 Various mangrove species may exhibit varied responses to elevated temperatures and CO2 concentrations.68 Avicennia absorbs CO2 through photosynthesis more quickly than numerous different mangrove species.62
The rate determined by diameter breast height (DBH) measurement (2.0TgC a-1) and the total biosphere-atmosphere interchange of CO2 are consistent (2.79 Tg C a-1). The net carbon storage has been quantified at 21.13 Tg C in the mangrove swamp of the Sundarbans reservoir and 5.49 Tg C in the sediment reservoir (30 cm). It absorbs 2.79 Tg C annually, accounting for 0.55% of India's yearly fossil fuel emissions, and sequesters 0.41% of the total 6621 Tg C carbon deposited in Indian forests.69 Avicennia, a notable flora in the Sundarbans mangrove vegetation, may be increasingly susceptible to elevated temperatures and CO2 levels due to changes in climate. The Sundarbans mangrove ecosystem's carbon sink is approximately 3.87 times bigger in terms of living biomass than it is in terms of sediment.60 The total yearly increase in average carbon concentration within the Sundarbans mangrove vegetation may be led to, in part, by higher resource accessibility, which favours species of light-wooded mangroves instead of restoration from previous disturbance.70
Discussion
Temporal changes in mangrove cover in India are caused by an array of human, geomorphological, and climatic factors. These changes have a big impact on the capacity for carbon sequestration. National evaluations indicate a minor net increase in mangrove area over recent decades; nevertheless, this trend obscures significant regional variability, characterised by ongoing losses in urbanised and industrial coastal zones and gains in restoration-focused regions.25 This regional heterogeneity shows that just expanding an area doesn't always mean better ecosystem functioning or carbon storage. The literature study also shows that there are problems with the methods used to estimate carbon stock in Indian mangrove areas, especially when it comes to soil depth and spatial coverage. Future evaluations that combine uniform field measurements with high-resolution remote sensing are important. To keep getting carbon sequestration advantages in India's coastal areas, conservation plans should focus on the quality, age, and water flow of mangrove ecosystems.
Conclusion
Mangrove ecosystems are facing critical degradation everywhere as a result of several human activities. Its afforestation and rehabilitation activities by concerned authorities and non-governmental organisations (NGOs) can offer an affordable means of boosting their potential to store carbon and nutrients.
Is it important to know that mangroves are an essential carbon sink globally? Does their degradation cause a substantial quantity of CO2 to be emitted back into the atmosphere? The outcomes of this study address the information gap regarding the functioning of the Indian mangrove biosphere in relation to GHG emissions and carbon sequestration capacity for reliable and precise management decisions. Globally, substantial initiatives have been undertaken to rebuild and revitalise deteriorated mangrove habitats over the past few decades.
The present study revealed that the mangrove coverage has been increasing gradually during the past twenty years, whereas the present mangrove cover will not be sufficient to sequester the current Carbon emissions. Hence, utmost efforts must be made to augment the mangrove vegetation to sequester atmospheric carbon, to decrease the release of GHGs, to cope with rising temperatures, and to assure a better, sustainable living world.
Acknowledgement
The facilities were provided by the registrar of the University of Kerala, for which the authors are grateful.
Funding Sources
The National Scheduled Castes Finance & Development Corporation (NSFDC) is acknowledged by Mrudula Elayi for providing financial support as NFSC JRF & SRF (NTA Ref No: 200510248646).
Conflict of Interest
The authors do not have any conflicts of interest.
Data availability statement
This statement does not apply to this article
Ethics statement
This research did not involve human participants, animal subjects, or any material that requires ethical approval.
Informed Consent Statement
This study did not involve human participants, and therefore, informed consent was not required.
Permission to reproduce material from other sources
Not Applicable
Author Contributions
Mrudula Elayi: Conceptualisation, Investigation, Data curation, and Writing original draft
Sherly Williams E: Conceptualisation, Editing, and Reviewing
Sabu Joseph: Reviewing
References
- Alongi DM. Coastal Ecosystem Processes. Boca Raton: CRC Press; 1997.
- Bhatt RP. Achievement of SDGs globally in biodiversity conservation and reduction of greenhouse gas emissions by using green energy and maintaining forest cover. GSC Adv Res Rev. 2023;17(3):1-21. https://doi.org/10.30574/gscarr.2023.17.3.0421
CrossRef - Kathiresan K, Gomathi V, Anburaj R, Saravanakumar K, Asmathunisha N, Sahu SK, Anandhan S. Carbon sequestration potential of mangroves and their sediments in the southeast coast of India. VLIZ Spec Publ. 2012;57:87-94.
- Hunt AJ, Sin EH, Marriott R, Clark JH. Generation, capture, and utilization of industrial carbon dioxide. ChemSusChem. 2010;3(3):306-322. doi:10.1002/cssc.200900169
CrossRef - Gale J, Bradshaw J, Chen Z. Sources of CO2. In: IPCC Special Report on Carbon Dioxide Capture and Storage; Cambridge University Press; :77-103.
- Bazzaz FA. The response of natural ecosystems to the rising global CO2 levels. Annual Review of Ecology and Systematics. 1990;21:167-196. http://www.jstor.org/stable/2097022.
CrossRef - Colliver A. Low-Emission Technology Series: Introduction to Carbon Capture and Storage. International Energy Agency; 2012.
- Karl TR, Melillo JM, Peterson TC, eds. Global Climate Change Impacts in the United States. Cambridge University Press; 2009.
- Friedlingstein P, O’Sullivan M, Jones MW, et al. Global carbon budget 2022. Earth Syst Sci Data Discuss. 2022:1-159. doi:10.5194/essd-2022-xxx
- Lindsey R. Climate change: atmospheric carbon dioxide. NOAA Climate.gov. Published 2020. Accessed 2023.
- Wang G, El Fatih AB. Impact of CO2 concentration changes on the biosphere–atmosphere system of West Africa. Global Change Biology. 8. Blackwell Science ltd. 2002:1169-1182.https://doi.org/10.1046/j.1365-2486.2002.00542.x
CrossRef - Baltz J. Six Ways to Remove Carbon Pollution from the Atmosphere. World Resources Institute; 2023.
- Rattan Lal R. Carbon sequestration. Philosophical Transactions of Royal Society . 2008;363(1492):815-830. doi:10.1098/rstb.2007.2185
CrossRef - Kristensen E, Bouillon S, Dittmar T, Marchand C. Organic carbon dynamics in mangrove ecosystems: a review. Aquatic Botany. 2008:89(2):201-219. https://doi.org/10.1016/j.aquabot.2007.12.005
CrossRef - Alongi DM. The forest floor. In: The energetics of mangrove forests. Dordrecht, Netherlands: Springer; 2009.89-127. doi:10.1007/978-1-4020-4271-3_5.
CrossRef - Clough BF, Ong JE, Gong WK. Estimating leaf area index and photosynthetic production in canopies of the mangrove Rhizophora apiculata. Marine Ecology Progress Series. 1997;159:285-292.https://doi.org/10.3354/meps159285
CrossRef - Lovelock CE. Soil respiration and belowground carbon allocation in mangrove forests. Ecosystems. 2008;11:342-354. https://doi.org/10.1007/s10021-008-9125-4
CrossRef - Costanza R, de Groot R, Farber S, et al. The value of the world’s ecosystem services and natural capital. Ecological Economics. Elsevier Science Publishing Company, Inc. 1998;25(1):3-15.
CrossRef - Furukawa K, Wolanski E. Sedimentation in mangrove forests. Mangroves Salt Marshes. 1996;1:3-10.https://doi.org/10.1023/A:1025973426404
CrossRef - Crooks S, Herr D, Tamelander J, Laffoley D, Vandever J. Mitigating Climate Change Through Restoration and Management of Coastal Wetlands and Near-Shore Marine Ecosystems: Challenges and Opportunities. IUCN; 2011. http://www-wds.worldbank.org/external/default/WDSContentServer/ WDSP/IB/2011/04/07/ 000333038_20110407024117/Rendered/PDF/605780REPLACEM10of0Coastal0Wetlands.pdf
- Breithaupt JL, Smoak JM, Smith TJ III, Sanders CJ, Hoare A. Organic carbon burial rates in mangrove sediments: strengthening the global budget. Global Biogeochemical Cycles. 2012;26(3): https://doi.org/10.1029/2012GB004375
CrossRef - Wong PP, Losada IJ, Gattuso JP, et al. Coastal systems and low-lying areas. In: Climate Change 2014: Impacts, Adaptation, and Vulnerability. Cambridge University Press; 2014:361-409.
- Hardik Sha, Ramesh R. Development-aligned mangrove conservation strategy for enhanced blue economy: a successful model from Gujarat, India. Estuarine, Coastal Shelf Science. 2022;274:107929. doi:10.1016/j.ecss.2022.107929
CrossRef - Sreelekshmi S, Nandan SB, Kaimal SV, Radhakrishnan CK, Suresh VR. Mangrove species diversity, stand structure and zonation pattern in relation to environmental factors: a case study at Sundarban delta, east coast of India. Regional Studies in Marine Sciences. 2020;35:101111. doi:10.1016/j.rsma.2020.101111
CrossRef - Forest Survey of India. India State of Forest Report 2023. Dehradun, India: Forest Survey of India, Ministry of Environment, Forest and Climate Change, Government of India; 2023.
- Selvam V. Environmental classification of mangrove wetlands of India. Current Science. Current Science Association: 2003;84(6):757-765. http://www.jstor.org/stable/24107579
- Limaye RB, Kumaran KPN. Mangrove vegetation responses to Holocene climate change along the Konkan coast of south-western India. Quaternary International. 2012;263:114-128.https://doi.org/10.1016/j.quaint.2012.01.034
CrossRef - Jayatissa LP, Dahdouh-Guebas F, Koedam N. A review of the floral composition and distribution of mangroves in Sri Lanka. Botanical Journal of Linnean Society. 2002;138(1):29-43.https://doi.org/10.1046/j.1095-8339.2002.00002.x
CrossRef - Jagtap TG, Murthy P, Komarpant D. Mangrove ecosystems of India: major biotic constituents, conservation and management. In: Wetland Conservation and Management. Pointer Publishers; 2002:34-64.http://drs.nio.org/drs/handle/2264/1450
- Giri C, Pengra B, Zhu Z, Singh A, Tieszen LL. Monitoring mangrove forest dynamics of the Sundarbans in Bangladesh and India using multi-temporal satellite data from 1973 to 2000. Estuarine, Coastal Shelf Science. 2007;73(1-2):91-100. https://doi.org/10.1016/j.ecss.2006.12.019
CrossRef - Jayanthi M, Duraisamy M, Kabiraj S, et al. Are the Sundarbans, the world’s largest mangrove region under threat? An ecosystem-based geospatial approach to assess past, present, and future changes in relation to natural and human-induced factors. Land Degradation and Development. 2023;34(1):125-141. doi:10.1002/ldr.4448
CrossRef - Nakhawa AD, Vichare PS, Markad S, Khandagale PA, Shirdhankar M, Brahmane MP. Mangrove mapping of different estuaries along Ratnagiri block using remote sensing. Ecology Environment and Conservation. 2017: 23(2) 870-875.
- Kavya A, Bhavani AG, Rao PJ, Chandrudu VB. Impact of land use/land cover and mangrove degradation on coastal erosion in the Godavari Delta region, Andhra Pradesh—a geospatial approach. In: Rao P, Rao K, Kubo S, eds. Proceedings of International Conference on Remote Sensing for Disaster Management. Springer Series in Geomechanics and Geoengineering. Cham, Switzerland: Springer; 2019. doi:10.1007/978-3-319-77276-9_37.
CrossRef - Venkataraman K. Coastal and marine wetlands in India. In: Proceedings of the Taal2007: The 12th World Lake Conference; 2008:392–400.
- Selvam V, Ravichandran KK, Gnanappazham L, Navamuniyammal M. Assessment of community-based restoration of Pichavaram mangrove wetland using remote sensing data. Current Science. 2003;85:794-798. https://www.jstor.org/stable/24109889
- Srinivasa Kumar T, Mahendra RS, Nayak S, Radhakrishnan K, Sahu KC. Identification of hot spots and well managed areas of Pichavaram mangrove using Landsat TM and Resourcesat-1 LISS IV: an example of coastal resource conservation along Tamil Nadu Coast, India. Journal of Coastal Conservation. 2012;16:1–12.https://doi.org/10.1007/s11852-011-0162-3
CrossRef - Selvam V, Ravichandran KK, Karunakaran VM, Mani KG, Beula EJ, Gnanappazham L. Pichavaram Mangrove Wetlands: Situation Analysis. Chennai, India: M.S. Swaminathan Research Foundation; 2010:39.
- Vani M, Rama Chandra Prasad P. Geospatial assessment of spatio-temporal changes in mangrove vegetation of the Pichavaram region, Tamil Nadu, India. In: Makowski C, Finkl C, eds. Threats to Mangrove Forests. Coastal Research Library. Vol 25. Cham, Switzerland: Springer; 2018. doi:10.1007/978-3-319-73016-5_5.
CrossRef - Krishnan A, Ramasamy J. An assessment of land use and land cover changes in Muthupet mangrove forest using time series analysis (1975–2015), Tamil Nadu, India. Geosfera Indones. 2022;7(2):119–135.
CrossRef - Ramachandran KK, Mohanan CN, Balasubramonian G, Kurten L, Thomas L. The Mangrove Ecosystem of Kerala: Its Mapping Inventory and Some Environmental Aspects. Project Report (1984–1985). Thiruvananthapuram, India: State Committee on Science, Technology and Environment; 1985:51.
- Basha SC. Distribution of mangroves in Kerala. Indian Forest. 1991;117(6):439–448.
- Kurien N, Samsuddin M, Ramachandran KK, Salim. Resource evaluation using remote sensing for aquaculture site selection.Kerala: Kerala State Council for Scienece, Technology and Environment .In: Proceedings of the 6th Kerala Science Congress; 1994:23–25.
- Unni PN. Conservation of mangroves in Kerala. Dr M N Madhyastha In: Prospects and Problems of Environment: Across the Millennium. New Delhi, India: Daya Publishing House; 2003:16–27.
- Vidyasagaran K, Madhusoodanan VK. Distribution and plant diversity of mangroves in the west coast of Kerala, India. Journal of Biodiversity and Environmental Sciences. 2014;4(5):38–45.
- Space Applications Centre (SAC). Coastal Zones of India. Ahmedabad, India: Indian Space Research Organisation; 2012.
- Jagtap TG, Nagle VL. Response and adaptability of mangrove habitats from the Indian subcontinent to changing climate. AMBIO A J of the Human Environment. 2007;36(4):328–334. https://doi.org/10.1579/00447447(2007)36[328:RAAOMH]2.0.CO;2
CrossRef - Harishma KM, Sandeep S, Sreekumar VB. Biomass and carbon stocks in mangrove ecosystems of Kerala, southwest coast of India. Ecological Processes. 2020;9(1):1–9. https://doi.org/10.1186/s13717-020-00227-8.
CrossRef - Sreelekshmi S, Preethy CM, Varghese R, Joseph P, Asha CV, Nandan SB, Radhakrishnan CK. Diversity, stand structure, and zonation pattern of mangroves in southwest coast of India. Journal of Asia-Pacific Biodiversity. 2018;11(4):573–582. https://doi.org/10.1016/j.japb.2018.08.001
CrossRef - Ragavan P, Kathiresan K, Zimmer M, Zhou R, Amir AA, Mohan PM, Rana TS. Three decades of global mangrove conservation—an overview. Malayan Nature Journal. 2020;72(4):551-576
- Kathiresan K. Mangrove forests of India: an overview. In: Das SC, Pullaiah, Ashton EC, eds. Mangroves: Biodiversity, Livelihoods and Conservation. Singapore: Springer; 2022: 233–270. doi:10.1007/978-981-19-0519-3
CrossRef - Ewel KC, Twilley RR, Ong JE. Different kinds of mangrove forests provide different goods and services. Global Ecology and Biogeography Letters. 1998;7(1):83–94. https://doi.org/10.1111/j.1466-8238.1998.00275.x
CrossRef - Kristensen E, Bouillon S, Dittmar T, Marchand C. Organic carbon dynamics in mangrove ecosystems: a review. Aquatic Botany. 2008;89(2):201–219. https://doi.org/10.1016/j.aquabot.2007.12.005
CrossRef - Ramsar Secretariat. Wetland Values and Functions: Climate Change Mitigation. Gland, Switzerland; 2001.
- Chen G, Chen B, Yu D, Tam NF, Ye Y, Chen S. Soil greenhouse gas emissions reduce the contribution of mangrove plants to the atmospheric cooling effect. Environmental Research Letters. 2016;11(12):124019. DOI 10.1088/1748-9326/11/12/124019
CrossRef - Muñoz-Hincapié M, Morell JM, Corredor JE. Increase of nitrous oxide flux to the atmosphere upon nitrogen addition to red mangrove sediments. Marine Pollution Bulletin. 2002;44(10):992–996. https://doi.org/10.1016/S0025-326X(02)00132-7
CrossRef - Chmura GL, Kellman L, Guntenspergen GR. The greenhouse gas flux and potential global warming feedbacks of a northern macrotidal and microtidal salt marsh. Environmental Research Letters. 2011;6(4):044016. DOI 10.1088/1748-9326/6/4/044016.
CrossRef - Twilley RR, Chen RH, Hargis T. Carbon sinks in mangroves and their implications to carbon budget of tropical coastal ecosystems. Water, Air, and Soil Pollution. 1992; 64:265–288. https://doi.org/10.1007/BF00477106
CrossRef - Alongi DM. Carbon cycling and storage in mangrove forests. Annual Review of Marine Science. 2014;6:195-219. doi:10.1146/annurev-marine-010213-135020
CrossRef - IPCC. Climate Change 2014: Synthesis Report. Contribution of Working Groups I, II and III to the Fifth Assessment Report of the Intergovernmental Panel on Climate Change. Pachauri RK, Meyer LA, eds. Geneva, Switzerland: Intergovernmental Panel on Climate Change; 2014:151.
- Ray R, Ganguly D, Chowdhury C, et al. Carbon sequestration and annual increase of carbon stock in a mangrove forest. Atmospheric Environment. 2011;45(28):5016–5024. https://doi.org/10.1016/j.atmosenv.2011.04.074
CrossRef - Ray R, Jana TK. Carbon sequestration by mangrove forest: one approach for managing carbon dioxide emission from coal-based power plant. Atmospheric Environment. 2017;171:149–154. https://doi.org/10.1016/j.atmosenv.2017.10.019
CrossRef - Kathiresan K, Anburaj R, Gomathi V, Saravanakumar K. Carbon sequestration potential of Rhizophora mucronata and Avicennia marina as influenced by age, season, growth, and sediment characteristics in southeast coast of India. J Coast Conserv. 2013;17(3):397-408. doi:10.1007/s11852-013-0236-5.
CrossRef - Seepana R, Perumal K, Kada NM, Chatragadda R, Raju M, Annamalai V. Evaluation of antimicrobial properties from the mangrove Rhizophora apiculata and Bruguiera gymnorrhiza of Burmanallah coast, South Andaman, India. J Coast Life Med. 2016;4(6):475-478. doi:10.12980/jclm.4.2016J6-52
CrossRef - Preethy CM. The Systematics, Floristics and Ecology of Selected Mangroves of Kerala. Doctoral dissertation. Cochin, India: Cochin University of Science and Technology; 2019.
- Donato DC, Kauffman JB, Murdiyarso D, Kurnianto S, Stidham M, Kanninen M. Mangroves among the most carbon-rich forests in the tropics. Nature Geoscience. 2011;4(5):293–297. https://doi.org/10.1038/ngeo1123
CrossRef - McKee KL, Faulkner PL. Restoration of biogeochemical function in mangrove forests. Restoration Ecology. 2000;8(3):247–259. https://doi.org/10.1046/j.1526-100x.2000.80036.x.
CrossRef - Chmura GL, Anisfeld SC, Cahoon DR, Lynch JC. Global carbon sequestration in tidal, saline wetland soils. Global Biogeochemical Cycles. 2003;17(4):1111. https://doi.org/10.1029/2002GB001917
CrossRef - Luo Z, Sun OJ, Wang E, Ren H, Xu H. Modeling productivity in mangrove forests as impacted by effective soil water availability and its sensitivity to climate change using Biome-BGC. Ecosystems. 2010;13:949–965. https://doi.org/10.1007/s10021-010-9365-y
CrossRef - Kishwan J, Pandey R, Dadhwal VK. India’s Forest and Tree Cover: Contribution as a Carbon Sink. Technical Paper No. 130. Dehradun, India: Indian Council of Forestry Research and Education; 2009.
- Malhi Y, Baker TR, Phillips OL, et al. The above-ground coarse wood productivity of 104 Neotropical forest plots. Global Change Biology. 2004;10(5):563–591.https://doi.org/10.1111/j.1529-8817.2003.00778.x
CrossRef


