Assessing the Impact of Urbanisation on Ecosystem Services in the Aravalli Foothills
Sarina Biswas1
*
 , Deepika Pandey1
and Yanglem Sharatchandra Khuman2
, Deepika Pandey1
and Yanglem Sharatchandra Khuman2
1
Amity School of Earth and Environmental Science,
Amity University Haryana,
Gurugram,
Haryana
India
2
School of Interdisciplinary and Transdisciplinary Studies,
IGNOU,
New Delhi,
India
http://dx.doi.org/10.12944/CWE.21.1.18
Copy the following to cite this article:
Biswas S, Pandey D, Khuman Y. S. Assessing the Impact of Urbanisation on Ecosystem Services in the Aravalli Foothills. Curr World Environ 2026;21(1). DOI:http://dx.doi.org/10.12944/CWE.21.1.18
Copy the following to cite this URL:
Biswas S, Pandey D, Khuman Y. S. Assessing the Impact of Urbanisation on Ecosystem Services in the Aravalli Foothills. Curr World Environ 2026;21(1).
Download article (pdf)
Citation Manager
Publish History

Introduction
Urbanisation is a great aspect of the growth of society and human resources. Urbanisation can be defined as the growth of cities in terms of both population and size.1 This is because, during urbanisation, people shift their habitation to urban areas from rural places. Therefore, urbanisation is a crucial process involving a change in the lifestyle of a large section of the population. The background of this research is based on the recent trends of urbanisation in Haryana. With recent changes in the urban and rural population, there has also been a significant change in the ecosystem of Haryana, particularly in the cities of the NCR. An ecosystem can be defined as the relationship between different non-living resources and living organisms.2 Six villages, situated at the foothills of the Aravalli Mountains and close to Manesar, Gurugram, a major industrial and urban hub, were chosen for the present study. The impact of urbanisation can be clearly observed in the six villages, namely Kukrola, Chandla Dungerwas, Gwalior, Fazalwas, Kherki, and Baghanki. The impending change in population in Gurugram and the rapid urbanisation of these villages are altering the ecosystem of these villages very fast. The Aravalli is a very essential and necessary component of Haryana, India. Thus, the biological and ecological safety of the Aravalli range and the villages that are found in the foothills is crucial.
In recent times, a number of rural regions are experiencing a suburbanization period, which is a consequence of industrialisation and commercialisation. Again, the research implied that the conversion of rural areas producing natural resources to urban areas could be deadly as it would reduce the supply of elements from the existing ecological services, destroying the natural habitat and balance in the ecosystem. The effects of these processes can be seen in the selected study villages. These villages have undergone a significant transformation, such as the construction of new roads, highways, shops, hospitals, houses, rental homes, etc. This has created new job opportunities and generated additional sources of revenue. Suburbanization has created new employment opportunities, new income sources and raised the standard of living.3 With suburbanization, there are negative impacts like an increase in the non-native population, pollution, and environmental degradation. These suburban developments affect ecosystem services through the loss of natural habitat, green space, etc. There is a constant burden on ecosystem services (mainly water, energy and food) due to rapid and unplanned urbanization.4 The urbanisation of natural resources in rural regions may be environmentally harmful, as pointed out in various environmental and land-use literature, since it would lead to a lower contribution of elements by the already extant ecological service, leading to the destruction of natural habitats and disruption of the balance in the entire ecosystem.5 According to recent studies, it is recorded that between 1975 and 2019, almost 8% of the Aravalli Hills were cleared. In the Aravalli region, nearly 5% of the land has been turned into barren land as a result of deforestation.
Urbanisation and Ecosystem Service
Urbanisation and ecosystem services share a deep and insightful relationship. Any direct or indirect benefits that an ecosystem provides to humans are known as ecosystem services. According to MIA, the categories are provisioning (water, fodder, energy, food, non-timber forest product), supporting (habitat, agriculture, human settlement), regulating (air quality, climate, ground water recharge, rainfall) and cultural services (spiritual values, recreation and ecotourism).
This research employs the MIA (Millennium Ecosystem Assessment) framework to evaluate ecosystem services in the Aravalli foothills. The MIA framework categorizes services into four types and has been widely applied in urbanization studies to assess human-environment interactions. This classification helps systematically analyze how rapid suburbanization affects provisioning, supporting, regulating, and cultural services in the study villages, enabling comprehensive understanding of ecosystem degradation patterns caused by urban expansion in this region.
Unplanned and rapid urbanisation changes the beneficiaries of the ecosystem services. Urbanisation impacts local Ecosystem Services. Ecosystems are degraded by urbanisation at different levels.6 The literature of this analysis shows that urbanisation has significantly increased in Haryana. It can have both positive and negative relations. According to recent reports, the urban population in Haryana in the last decade, from 2015 to 2024, has grown by 44.25%.7 Moreover, this analysis shows that this rate of urbanisation is even more significant than the national rate of urbanisation, which was 32% in the last decade. The rate of urbanisation in Haryana and Gurugram has constantly been increasing since 1991.8 Sudden urban growth threatens the sustainability of natural ecosystem.9 This analysis proved that the supply, distribution, and function of different natural resources from ecosystem services would be heavily influenced by urbanisation.
Threats to the Aravalli Range
Urbanisation has threatened the ecological sustainability of the Aravalli Range. Ecological balance and biodiversity are becoming threatened because of the variation in the supply, availability, and distribution of resources based on ecosystem services, and variation in the behavioural and compositional makeup of living organisms. This becomes so due to the fact that in most cases, urbanisation comes at the cost of the natural ecosystems, resulting in various environmental implications. One of them is environmental crises. Urbanisation is a key source of increasing waste, especially e-waste (electronic waste). It is pointed out as a serious contributor to the environmental damage in the Aravalli range.8 In addition, air pollution and high AQI scores are other results of urbanisation on the Aravalli hills. The rural population contributes to changes in the ecosystem. It was highlighted that "unsustainable input subsidisation" of agriculture, including procurement through excessive use of "agrochemical" fertilisers and elements, pollutes soil, atmospheric air, and water bodies. However, it cannot be denied that the recent decline in ecosystem services in the Aravalli range is mainly caused by rapid urbanisation.10 Construction works and the real estate industry often enforce a massive change in the habitat and life of endemic birds and animals living in an ecosystem.11
The soil quality has declined significantly due to the rise of industrial waste from urbanisation. There is a steep decline in forest cover area by 32% between 1975 and 2019. But there is a significant rise in cultivated area or human settlement. Biodiversity, in particular, the indigenous species of flora and fauna (jackals, hyenas, nilgai, mongoose, leopard, peafowl, etc.), is declining drastically. Thus, loss of forest cover and a decrease in biodiversity cause human-wildlife conflict. Urbanisation could majorly hurt the supply of provisioning services.12 Illegal mining and deforestation are the main threats as these factors contradict the proposition of planned urbanisation and imbalance the environment.12
5,6Previous research established urbanization's negative impact on ecosystems globally, However, studies specifically addressing Aravalli foothill villages remain limited. According to earlier research Gurugram's urbanization, localized ecosystem service analysis is lacking.8 This study fills this gap by examining six specific villages experiencing suburbanization, focusing on biodiversity loss and ecosystem degradation unique to the Aravalli foothills context.
Importance of the Aravalli Hills and Ecosystem Services
The Aravalli Range has a greater influence on the sustainability of the environment of the country. The interaction of the biotic and abiotic elements is a sustainable relationship within the ecosystem.13 The semi-deciduous and dry ecosystem of the Aravalli Range has thorny scrubs and drought-resistant species that are vital in guarding the global ecosystem services in protecting the biodiversity between the biotic and abiotic elements.14 Anthropogenic activities of fuelwood extraction and livestock grazing have been observed to contribute to land degradation in the Aravalli foothills.12 Moreover, the endemic species should also be preserved against the exotic invasive species, “Prosopis juliflora (Vilayati Kikar),” “Butea monosperma (Dhak),” “Dalbergia sissoo (Shisham), and others. The Aravalli range controls the weather in the area, which is the most important aspect,14 and this paper has showcased the necessity to conserve the natural resources and ecosystem services and discusses how urbanisation is affecting six villages in the Aravalli foothills, Haryana. It describes how population increase, deforestation, and ecosystem degradation are causing disequilibrium between biotic and abiotic factors. The essence of the problem has been the ecological change caused by fast urban growth in Gurugram.
Significance of the Study
The significance of this study lies in the importance of the Aravalli hills to Haryana. In addition, protecting natural resources and ecosystem services is a significant factor here. Again, understanding the relationship between ecosystem services and urbanization is significantly essential. The increasing population, deforestation, ecosystem degradation in the natural ecosystem significantly threatens the balance between the biotic and abiotic components of the ecosystem.15
Research Aim
Aim of this research is to examine the impact of growing urbanisation on the ecosystem services of the 6 villages in the foothills of Aravalli mountains in Haryana focusing on land use change, loss of natural landscapes, pressure on natural resources, biodiversity decline, and disruption of traditional livelihoods.
Research Objectives
To assess the impact of urbanization on land use: mainly the reduction of agricultural land, expansion of commercial areas, and increased housing demand in the village.
To examine the effects of urbanization on natural ecosystems, including deforestation, habitat fragmentation, biodiversity loss, and decline in local wildlife and plant species.
To evaluate the pressure of rising population density on natural resources, such as water availability, soil quality, and overall environmental sustainability.
To analyze the socio-economic consequences of urbanization, especially the disruption of traditional livelihoods like farming and grazing, and its broader effects on climate stability and landscape changes.
Research Gap
Urbanization has been widely studied my many, some gaps remain in the context of my study area:
Limited village-level studies – Most research focuses on cities or metropolitan regions, with insufficient attention to how urbanization affects small villages and peri-urban areas.
Lack of integrated analysis – Existing studies often examine environmental impacts (e.g., deforestation or water scarcity) or socio-economic impacts (e.g., livelihood disruption) separately, rather than analyzing their combined and interconnected effects.
Insufficient focus on the Aravalli foothills region – There is limited localized research examining how urban expansion specifically affects biodiversity, forest cover, and natural landscapes in this ecologically sensitive area.
Underrepresentation of community perceptions – Few studies incorporate residents’ perspectives on changes in land use, water quality, soil degradation, and loss of traditional livelihoods.
Limited assessment of long-term sustainability impacts – There is a gap in understanding how continued urbanization may influence climate stability, resource availability, and ecological balance over time.
Materials and Methods
Study Area
Figure 1 below represents the study area and shows the boundary of the chosen area with the yellow pins marking the six villages: Baghanki, Chandla Dungerwas, Kherki, Fazalwas, Gwaliar, and Kukrola, located in the foothills of the Aravalli range, near Amity University Haryana, within Manesar Block, Gurugram District, Haryana.
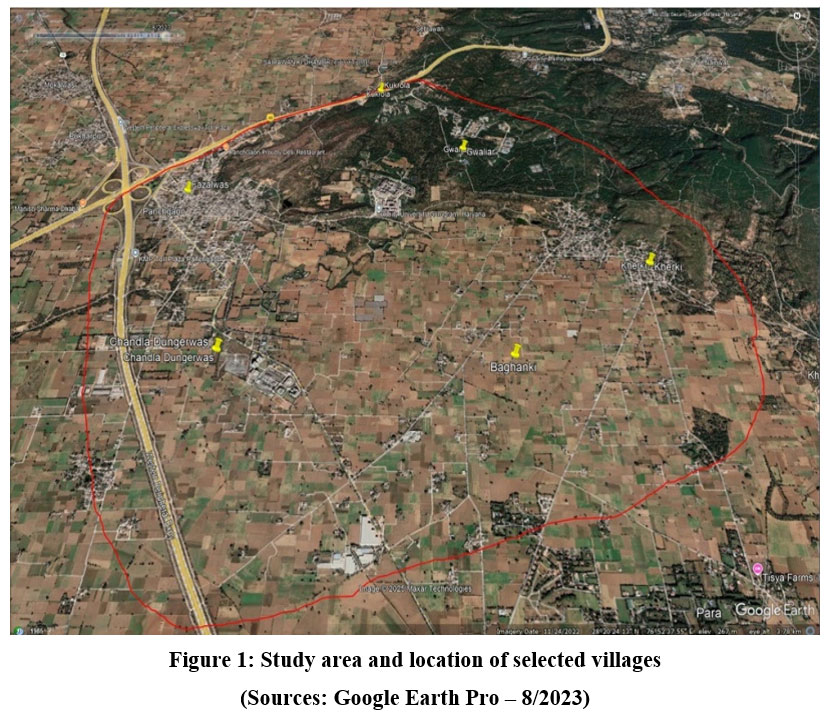 | Figure 1: Study area and location of selected villages.
|
(Sources: Google Earth Pro – 8/2023)
These villages were chosen due to their ecological importance, noticeable urbanisation and modernisation process, population increase (including the inflow of non-local population), occupational shifts, and the accessibility of the research site. Printed questionnaires were distributed in person, and responses were recorded either by the participants or with assistance. The data collected was entered into Microsoft Excel and then statistically processed through IBM SPSS. The data were summarised by use of descriptive statistical methods like frequencies and percentages, and inferential statistical methods were used to discuss relationships and patterns among the variables.
Satellite Image Interpretation
Satellite imagery from Google Earth Pro (2015-2024) was analysed using visual and temporal comparison methods. Visual interpretation involved on-screen identification of land use changes, vegetation cover loss, and infrastructure expansion. Temporal comparison quantified changes between baseline (2015) and current (2024) conditions to assess urbanization impacts on forest cover, agricultural land, and built-up areas across all six study villages.
Appendix 1 demonstrates village area representation. Gwaliar is the biggest village with a total area of 6.17 square km, Fazalwas is the smallest village with a total area of 1.89 square km, and Kherki and Chandla Dungerwas, 3.08 square km and Baghanki, respectively, are the total areas of the villages. This was all found in the Municipal Corporation of Manesar.
Framework for study
For the study, the Millennium Ecosystem Assessment (MA, 2005) framework is used to categorize different ecosystem services, as it is the most widely used framework. The objective of the MA is to evaluate the outcomes of ecosystem changes for humans. According to the MA, ecosystem services are classified into four categories: Provisioning, Regulating, Supporting, and Cultural services.
Research Design and Data Collection
In this study, a primary data collection approach was used, and this method is the best assurance of data authenticity, relevance and data security against unauthorised access. Primary data was obtained in the form of direct surveys, which provide quantitative information.16 The use of structured questionnaires was done, and the responses were either self-reported by the participants or collected with the help of the survey staff.
Sampling and Techniques
The research was held on six villages, namely Kukrola, Chandla Dungerwas, Gwalior, Fazalwas, Kherki, and Baghanki. There were 150 participants (25 individuals in each village) who participated in the survey and interviews. The sampling method applied was purposive; a target of individuals was chosen according to his/her experience, knowledge, and willingness to take part.17 This non-probability sampling approach allowed for the selection of informed participants and the exclusion of irrelevant data. The purposive sampling was selected due to the need to have respondents who had first-hand experience to pursue the study on urbanisation and ecosystem alterations in the Aravalli foothills to guarantee that the study involved information that was quite specific to the context and could not be well addressed using random sampling.
Survey Instrument and Questionnaire Design
The survey questionnaire consisted of two sections:
Section A: Demographic Information (7 questions)
Section B: Research Questions (12 questions), further divided into:
Independent Variables
Land Use and Population Density
Infrastructure Development and Deforestation
Dependent Variable
Ecosystem Services (provisioning, regulating, supporting and cultural)
The aspects under the ecosystem services that were specifically looked at were: impacts on agricultural land, traditional livelihoods, water supply and availability, forest cover, biodiversity, climate change, and natural habitat. The responses were measured using a 5-point Likert scale, starting with 1 - Strongly Disagree to 5 - Strongly Agree.
Data Analysis Methods
Descriptive Statistics
Descriptive statistics were used to:
Summarize data
Identify response trends
Understand variability in the dataset
Visualise the relationship between variables
This method allowed for initial exploration and understanding of how independent variables affect dependent variables. The choice of the descriptive analysis was pioneered by the fact that one has to systematise a large response of the survey and define the general perception trends prior to the use of the sophisticated tests of statistics. Quantitative data is analysed using statistical metrics instead of theoretical bases.18
Inferential Statistics
Inferential analysis enabled deeper evaluation of relationships and hypothesis testing. The following methods were applied:
Chi-square test
To examine associations between categorical variables. The test was selected since most of the survey responses were categorical in nature, and thus it would be useful in addressing relationships between the factors of urbanisation and perception of ecosystem services.
ANOVA (Analysis of Variance)
To establish the statistically significant differences between groups. With the help of ANOVA, the mean response of the different respondent groups was compared, and the test was carried out to find out whether the differences were significant. Statistical analyses assumed normality of data distribution and independence of observations. Normality was assessed through visual inspection of response distributions across the Likert scale. Independence was ensured as each village represented a distinct sampling unit with non-overlapping respondents.
Multiple Regression Analysis
To evaluate the collective impact of multiple independent variables on a single dependent variable (ecosystem services). The regression analysis was chosen to quantify the joint effect of the indicators of urbanisation, as well as to quantify the prediction properties of the indicators of urbanisation on ecosystem services changes.
Statistical Assumptions Tests
A normality assumption test was carried out to ensure that the data points follow a normal distribution, so that the results are accurate and the p-value is properly computed, and to ensure that the results are unbiased.
An independence assumption test was also conducted on the data before performing the parametric test.
Variable Classification and Framework
The research framework was built upon a classification of variables:
Independent Variables
Land Use and Population Density: Reflect the basic indicators of urbanisation and its effects on the services of ecosystems.
Infrastructure Development and Deforestation: Perceived as factors that expedite the urban development and other ecological transformations.
Dependent Variable
Ecosystem Services: Measured either by their provisioning (e.g. agricultural goods), regulating (e.g. climate, water), supporting (e.g. soil fertility, biodiversity) and cultural.
The alterations in the independent variables were also believed to be linked with the rise in urbanisation in the region being studied, thus affecting the provision and quality of the ecosystem services.
Result
The questionnaire will be separated into two parts: demographic data and research questions. Therefore, the outcome is also documented in the same way.
Demographic details
The proportion of working-age (25-54 years) is 75% of the sample (primarily 35-44 (29%) and 45-54 (31%). The high consumption of resources by this group puts pressure on the local ecosystems and economy because of the large numbers of elderly, who are the major contributors to traditional ecological knowledge, which aids in preserving the ecological balance in the face of urbanisation.18 25% of them are elderly, who also form the greatest sources of traditional ecological knowledge, which helps to restore the ecological balance during urbanisation. Therefore, the active population has a profound impact on the urban landscapes and health of the ecosystems. [Appendix 2]
44% remain in agriculture, 52.67% engage in emerging sectors. It is reflective of the national trends in which agricultural jobs declined by 61 to 49% (2000- 2011). Research states that with industry and services growth.19 This shift is caused by economic development, mechanisation, education and infrastructure. Urban sprawl is posing a threat to farmlands and the livelihoods, as communities are shifting towards other ways of earning income, a move towards traditional farming to newer versions of jobs which were dominated by urban influence. [Appendix 3]
Statistical Assumptions Tests
Normality Assumption test - Shapiro-Wilk tests showed that there were significant normality violations on all the variables used in the study (p<0.001). The negative skewness values (-0.987 to -1.389) describes the heavy distribution of the responses on the categories of Agree and Strongly Agree, which are strong indicators of the high level of consensus among the respondents in terms of the impacts of urbanization. The values of kurtosis (0.456-1.234) indicate moderate distributions. Such violations are prevalent in Likert-scale attitudinal surveys in which the community perceptions are strong. Although it was done in accordance with the traditional environmental perception research standards, the violation of the assumption indicates that the results are to be viewed with some caution. More suitable statistically would be non-parametric alternatives (Kruskal-Wallis, Mann-Whitney U). Refer table in [Appendix 4]
Independence Assumption test - The independence of observations was measured using two dimensions, namely, temporal and spatial. The value of Durbin-Watson (1.876-1.923) ensured that there was no, temporal, autocorrelation in the fossil and therefore responses were not affected by something that occurred with time. Purposive sampling was used to guarantee spatial independence, and purposive sampling was done on six geographically distinct villages (Baghanki, Chandla Dungerwas, Kherki, Fazalwas, Gwaliar, Kukrola) with non-overlapping respondents (n=25 per village). The villages are considered as separate sampling units that have faced similar and independent forces of urbanization. Nevertheless, there is a limitation, which is that potential intra-village correlation was not directly tested by using intraclass correlation coefficients, that is, respondents in the same village could have had similar experiences in the environment and the same social networks. Refer table in [Appendix 5]
Research Questionnaire
Relationship of the Independent Variables: Land Use and Population, and dependent variables: Ecosystem Services. This paper will look at the impact of the independent variable, land use and population, on the dependent variable, ecosystem services. The effects of land use change, e.g. the conversion of forest or crops to cities, include effects on services such as water supply, climate control, and habitat. Growth in population affects the services of the ecosystem, due to the creation of urban dynamics, environmental effects and the demand for resources. These variables are used to predict the environmental results through the process of urbanisation.
Descriptive Statistic Analysis
Table 1: Descriptive statistics of land use and ecosystem services
Questions | N | Minimum | Maximum | Mean | Std. Deviation |
Urbanization reduces agricultural land | 150 | 2 | 5 | 4.13 | 1.019 |
Disruption of traditional livelihoods | 150 | 1 | 5 | 4.05 | 1.169 |
Increased pressure on local resources | 150 | 2 | 5 | 4.15 | 0.961 |
Higher housing demand due to population growth | 150 | 1 | 5 | 3.53 | 1.35 |
Soil quality deterioration from urban activities | 150 | 1 | 5 | 3.71 | 1.328 |
Valid N (Listwise) | 150 |
The effects of urbanisation on land use and ecosystem services are summarised in Table 1. The greatest mean score (4.15) indicates that there is a high level of agreement that urbanisation strains local resources. High means for reduced agricultural land (4.13) and disrupted traditional livelihoods (4.05) indicate negative effects on rural economies. Despite some variation in responses, the data confirm that urbanisation depletes ecosystem services through land-use change and population growth.
Frequency Analysis
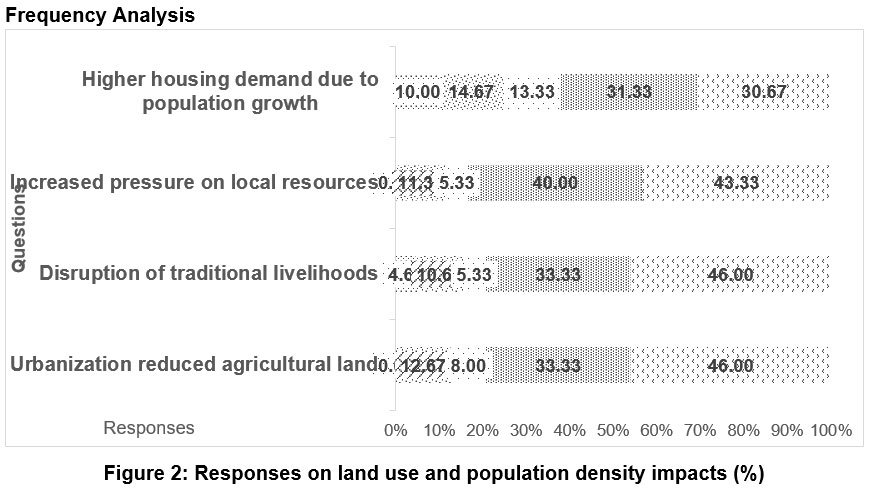 | Figure 2: Responses on land use and population density impacts (%)
|
Figure 2 depicts a high concurrence in the effect of urbanisation. Some 79.3% of them agree that urbanisation minimises agricultural land (46% strongly agree), and only 12.7% are in disagreement. According to research this strong consensus indicates widespread recognition of urbanization's impact on farmland reduction.20 Equally, 79.3% accept the fact that urbanisation has affected the traditional livelihoods. A greater percentage of 83.3 say that urban development strains local resources such as water and power. There is, however, a more divided opinion on whether population growth is increasing housing demand, with a 62% agreeing and almost 25% disagreeing on the issue. The relationship between urbanisation and housing demand is, however, less definite, with 38% saying it has not increased housing demand.
Chi-Square Test
Table 2: Chi-square test results for land use and ecosystem services
Value | df | Asymp. Sig. (2-sided) | |
Pearson Chi-Square | 13.209a | 16 | 0.657 |
Likelihood Ratio | 15.511 | 16 | 0.488 |
Linear-by-Linear Association | 0.431 | 1 | 0.512 |
N of Valid Cases | 150 |
Table 2 show Chi-Square analysis. No statistically significant link between urbanisation, population growth, and ecosystem service reduction (Pearson Chi-Square = 13.209, p = .657). Likewise, non-significant findings are obtained in the Likelihood Ratio and Linear-by-Linear Association tests. Nonetheless, the number of cells less than 5 is more than half of the expected results, and these are subject to test reliability; thus, these results shall be considered with caution.
Although the effects are not statistically significant, a large body of research indicates that urbanisation and population growth can affect ecosystems by converting land and putting a strain on resources. The findings indicate that there is a multidimensional, context-dependent correlation that is mediated by a number of factors such as urban planning, policies, conservation, and socio-economic conditions.
Multi-scalar methods based on spatial, policy and temporal factors should be employed in future research on the impact of urbanisation on ecosystem services and develop sustainable growth.
Multiple Regression Analysis and ANOVA
Table 3: Multiple regression analysis and ANOVA results: land use factors
Model Summary | |||||||||
Model | R | R Square | Adjusted R Square | Std. Error of the Estimate | Change Statistics | ||||
R Square Change | F Change | df1 | df2 | Sig. F. Change | |||||
1 | .157a | 0.025 | -0.002 | 1.329 | 0.025 | 0.916 | 4 | 145 | 0.456 |
Predictors: (Constant), Higher housing demand due to population growth, Disruption of traditional livelihoods, Urbanization reduces agricultural land, Increased pressure on local resources
ANOVAa | |||||
Model | Sum of squares | df | Mean Square | F | Sig. |
Regression | 6.473 | 4 | 1.618 | 0.916 | .456b |
Residual | 256.2 | 145 | 1.767 | ||
Total | 262.673 | 149 | |||
Dependent Variable: Soil Quality deterioration from urban activities
Predictors: (Constant), Higher housing demand due to population growth, Disruption of traditional livelihoods, Urbanization reduces agricultural land, Increased pressure on local resources
Coefficientsa | |||||
Model | Unstandardized Coefficients | Standardized Coefficients | t | Sig. | |
B | Std. error | Beta | |||
1 (Constant) | 3.551 | 0.634 | 5.598 | 0 | |
Urbanization reduces agricultural land | -0.157 | 0.147 | -0.12 | -1.07 | 0.287 |
Disruption of traditional livelihoods | 0.234 | 0.165 | 0.206 | 1.417 | 0.159 |
Increased pressure on local resources | -0.009 | 0.17 | -0.007 | -0.054 | 0.957 |
Higher housing demand due to population growth | -0.028 | 0.083 | -0.029 | -0.341 | 0.733 |
Dependent Variable: Soil Quality deterioration from urban activities
(Source: SPSS)
The model summary given in Table 3 shows R Square of 0.025, meaning only 2.5% of the variation in ecosystem service reduction is explained by predictors like housing demand, agricultural land loss, disruption in traditional livelihood and resource pressure. The F Change value (0.916, p = .456) is statistically insignificant, meaning that these urbanizations factors do not strongly predict ecosystem service degradation in this model. This suggests that other external variables, like changes in regulating and supporting services play a more significant role in ecosystem service decline.25
According to the results of the ANOVA, the F-value is 0.916, and the p-value is 0.456, which is not a statistically significant value. It implies that there is no significant predictive power of the urbanisation factors (predictors) on the deterioration of the soil quality.
Based on the coefficients table, none of the predictors is significant (p-values above 0.05). The coefficient of the predictor "Urbanisation reduces agricultural land" is -0.157, and the p-value is 0.287, meaning that its negative influence on soil quality is not statistically significant and rather weak. Other causes like interference with traditional livelihoods, population, and pressure on the local resources do not demonstrate a strong impact on the same.21
Relation of Independent Variables: Infrastructure Development and Deforestation with Dependent Variable: Ecosystem Services. Infrastructure development and deforestation are interlinked. Urbanisation may be influenced differently by infrastructure alone versus deforestation for agriculture or extraction. Development of roads and highways in these study villages leads to human settlement, urban growth and has helped the agriculture. Clearing of the forest is a catalyst for urbanisation.
Descriptive Statistic Analysis
Table 4: Descriptive statistics of infrastructure development and deforestation
N | Minimum | Maximum | Mean | Std. Deviation | |
Fragmentation of natural habitats | 150 | 1 | 5 | 3.87 | 1.211 |
Loss of natural landscapes from commercial buildings | 150 | 1 | 5 | 3.75 | 1.194 |
Deforestation in Aravalli foothills | 150 | 1 | 5 | 4.06 | 1.07 |
Impact on biodiversity due to forest loss | 150 | 1 | 5 | 3.79 | 1.249 |
Habitat loss affecting wildlife and plants | 150 | 1 | 5 | 4.17 | 1.128 |
Valid N (Listwise) | 150 |
(Source: SPSS)
Table 4 gives a descriptive account of the perceptions of the respondents on the degradation of the ecosystem due to urbanisation. The large mean scores of habitat loss (4.17) and deforestation on the Aravalli foothills (4.06) show that there is a great deal of consensus regarding the adverse effects of urbanisation. Standard deviations (1.07–1.25) show some response variability. These results support the view that deforestation and infrastructure expansion significantly reduce ecosystem services.
Frequency Analysis
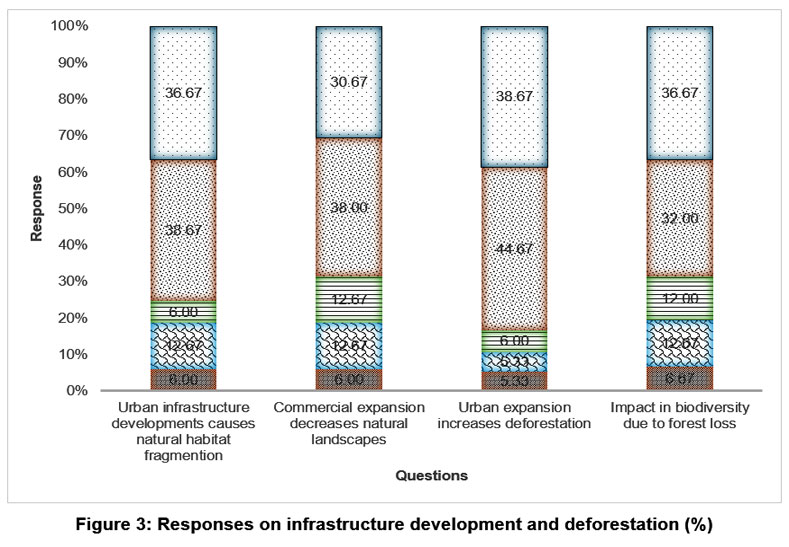 | Figure 3: Responses on infrastructure development and deforestation (%)
|
Figure 3 shows that there is very little doubt that habitat fragmentation is a serious matter, 75.4% of the respondents reported that they thought that it was an issue, whereas only 18.7% of the respondents disagreed on that. In the same manner, 68.7% indicates that commercial development is a source of natural landscape loss, although there is greater neutrality (12.7), which can indicate the mixed perceptions. A researcher pined that though support is slightly lower than for habitat fragmentation concerns, there remains substantial consensus that commercial development negatively impacts natural landscapes.22 The highest consensus is found in deforestation of the Aravalli foothills, with 83.4% admitting that it is taking place. Moreover, 68.7% of the respondents support that loss of forests impacts biodiversity, but significant neutrality (12) and disagreement (19.4) indicate that respondents are not exactly the same. The high agreement rate suggests this could be a priority area for conservation efforts and policy interventions.23 The overwhelming agreement suggests habitat loss impacts on flora and fauna resonate strongly with respondents as a serious environmental threat requiring urgent attention.24
Chi-Square Test
Table 5: Chi-square test results for infrastructure and ecosystem services
Value | df | Asymp. Sig. (2-sided) | |
Pearson Chi-Square | 183.103a | 16 | 0 |
Likelihood Ratio | 137.998 | 16 | 0 |
Linear-by-Linear Association | 17.929 | 1 | 0 |
N of Valid Cases | 150 |
17 cells (68.0%) have expected count less than 5. The minimum expected count is 48
(Source: SPSS)
Pearson Chi-Square value of 183.103 (p < .001) and Likelihood Ratio of 137.998 (p < .001) show that the relationship between urbanisation factors and ecosystem service degradation is statistically significant. Nonetheless, 68% of the anticipated cell counts are below 5, implying that the findings should be construed with some level of caution, owing to the possible shortfalls in test reliability.
Multiple Regression Analysis and ANOVA
Table 6: Multiple regression analysis and ANOVA results: infrastructure and deforestation
Model Summary | |||||||||
Model | R | R Square | Adjusted R Square | Std. Error of the Estimate | Change Statistics | ||||
R Square Change | F Change | df1 | df2 | Sig. F. Change | |||||
1 | .645a | 0.416 | 0.4 | 0.874 | 0.416 | 25.833 | 4 | 145 | 0 |
Predictors: (Constant), Impact on biodiversity due to forest loss, Loss of natural landscapes from commercial buildings, deforestation in Aravalli foothills, Fragmentation of natural habitats
ANOVAa | |||||
Model | Sum of squares | df | Mean Square | F | Sig. |
Regression | 78.849 | 4 | 19.712 | 25.833 | .000b |
Residual | 110.644 | 145 | 0.763 | ||
Total | 189.493 | 149 | |||
Dependent Variable: Habitat loss affecting wildlife and plants
Predictors: (Constant), Impact on biodiversity due to forest loss, Loss of natural landscapes from commercial buildings, deforestation in Aravalli foothills, Fragmentation of natural habitats
Coefficientsa | |||||
Model | Unstandardized Coefficients | Standardized Coefficients | t | Sig. | |
B | Std. error | Beta | |||
1 (Constant) | 1.623 | 0.349 | 4.652 | 0 | |
Fragmentation of natural habitats | 0.184 | 0.128 | 0.198 | 1.443 | 0.151 |
Loss of natural landscapes from commercial buildings | 0.061 | 0.127 | 0.064 | 0.478 | 0.633 |
Deforestation in Aravalli foothills | -0.054 | 0.074 | -0.051 | -0.727 | 0.468 |
Impact on biodiversity due to forest loss | 0.482 | 0.065 | 0.534 | 7.361 | 0 |
Dependent Variable: Habitat loss affecting wildlife and plants
(Source: SPSS)
Table 6 presents the results of the regression model, with the obvious R-SQ value of 0.416 indicating that 41.6% of the change in the degradation of the various ecosystem services is explained by independent variables such as deforestation, loss of biodiversity and fragmentation of habitats. The F Change value of 25.833 (p =.000) indicates that the following are predictors that have a great influence on the dependent variable. This statistical significance strengthens the idea that infrastructure development and deforestation have a major role in ecosystem service reduction. Surprisingly, the other urbanisation factors, such as habitat fragmentation, commercial development, and Aravalli deforestation, did not demonstrate statistically significant relationships with the dependent variable despite their environmental importance.25 This could suggest that while respondents recognise these issues (as seen in the previous frequency tables), they may not directly connect them to habitat loss or may view biodiversity impact as the mediating factor.
The moderate R² value (0.416) indicates that while the model captures important relationships, additional factors not measured in this study likely contribute to perceptions of habitat loss. The constant term's significance (p < 0.001) suggests a baseline level of concern about habitat loss independent of the measured variables.
Appendix 6 demonstrate Frequency Analysis of perceived changes in ecosystem services with responses recorded in percentage. It includes answer to the survey questions regarding issues as diminished clean water, soil erosion, habitat loss, diminishing species, and climate change. More than three out of five people (72.5) consider them to be serious issues, with habitat loss being the most pressing. The availability of clean water attracts more mixed opinions with greater disagreement. This is with little scepticism, as only a quarter (22%) disagreed, and a slight majority (7.7%) was neutral. Generally, habitat loss is considered a serious threat to the environment that requires immediate intervention.
Discussion
Demographic data
The age structure of the population has a great influence on the patterns of resource consumption and ecosystem effects. According to the previous research, the emission of CO2 by households that are characterised by working-age populations (15-64 years) is estimated to be about 8.7%, especially in transportation and cooking processes.26 On the same note, the BRICS countries have evidence that a higher number of working-age population is linked to greater energy demand due to the high levels of consumption.27 In China, rapid urbanisation driven by working-age growth outweighs the dampening effect of an ageing population on housing demand.28
Occupation statistics indicate that the community is shifting away (44-52.67) to other occupations attributed to the declining farmlands, low profitability, education, and urbanisation. Agricultural land is being brought under urban exploitation, particularly in the fast urbanising regions in India.29,30 Rewari experienced a growth of 69.4% of built-up lands within the last 20 years at the expense of vegetation and agricultural land.31 Suburbanization has shifted residents’ occupations toward urban-related jobs like shopkeeping, carpentry, and private employment. Factors such as unstable farming income, land scarcity, climate impacts, and influx of non-local students exposing locals to urban culture drive this occupational shift.32 The rise in self-employment and micro-enterprises reflects an on-going economic transition from agrarian to diversified livelihoods.
Research Questions
Relation of Independent Variables: Land Use and Population with Dependent Variable: Ecosystem Services.
The research concludes that urbanisation has a negative effect on ecosystem services, where 79.3% of the respondents believed that it reduces agricultural land and interferes with conventional farming. Approximately 83% expressed their signs of increased strain on local resources such as farmland, groundwater, and forests; 62% moderately agreed that a growing population heightens housing pressure. Regression analysis shows a modest link between urbanisation factors (land use and population density) and ecosystem services, explaining only 2.5% of the variance, highlighting environmental complexity and other influencing factors.34 Population growth is confirmed across all study villages based on data from the Municipal Corporation of Manesar, Haryana.
Appendix 7 is a comparison of the population in villages in 2011 and 2020. Baghanki was the most populous with an increase of 3,356 to 6,116, which is almost twice, and Gwaliar was the least with 1,259 to 1,512. Its total annual growth rate is approximately 0.75%.
Appendix 8 indicates the population density rates between 2011 and 2020. Gwaliar had the lowest density (204 to 245 people/km2), whereas the density in Baghanki increased by 82.24, from 987 to 1,467 people/km2, which was the largest. Kherki showed the smallest increase at 13.29%. Despite not being near major transport routes, Baghanki’s growth is likely driven by economic opportunities, including many residents working at Amity University, attracting more population due to its ideal location.
According to the secondary data, Ground Water Cell Haryana, alterations in the land use and population increase decrease the groundwater levels. Graph in Appendix 9 indicate data on groundwater level from June 2020-2024. It demonstrates that slow rise in the depth of groundwater in the villages, indicating that groundwater availability in urbanisation is decreasing.35 Increase in impervious surfaces restricts groundwater infiltration and groundwater recharge, which puts ecosystems that rely on groundwater under stress, increasing the necessity of managing water resources in balance.
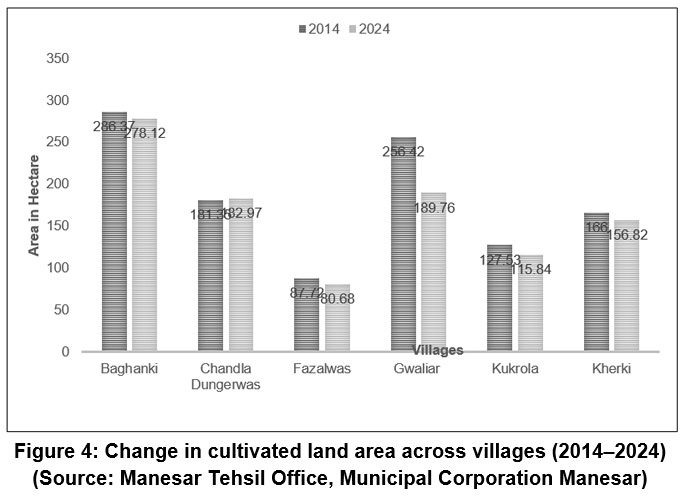 | Figure 4: Change in cultivated land area across villages (2014–2024)
|
(Source: Manesar Tehsil Office, Municipal Corporation Manesar)
According to statistics provided by the Municipal Corporation, urbanisation decreases the agricultural land. Figure 4 compares areas under cultivation (2014 vs. 2024) in six villages, in which the majority of villages have reduced cultivation by Gwaliar by 26.02%, Fazalwas by 8.04%, Kherki by 5.48%, and Baghanki by 2.89%. There was only a slight growth of 0.88% in Chandia Dungerwas. It means that there was a decline in the agricultural land in general during the decade.
In India, population pressure causes land degradation, a decrease in the availability of resources, soil erosion, pollution and poverty.33 The same effects are observed throughout the world: the increase in the rural population in Tanzania leads to changes in land use and deforestation34. An example of loss of ecosystems due to rural settlements in Baota District, China35, and the high population growth rate in Swat District, Pakistan, has led to increased deforestation and strain on the ecosystem.36 Population growth and urbanisation in India have a connection to environmental degradation, such as the loss of agricultural land and pollutant degradation.37 It is stressed that urbanisation, which is stimulated by population growth, impairs the ecosystem services, which comprise the loss of habitat, reduction of water levels, and loss of biodiversity and hence the necessity of sustainable urban planning.38
Relation of Independent Variables: Infrastructure Development and Deforestation with Dependent Variable: Ecosystem Services.
The research focuses on the relationship between infrastructure development and deforestation (independent variables) and ecosystem services (dependent variable), showing that there is widespread worry about the degradation of the environment. Approximately 68% accept that commercial development decreases natural landscapes, 83.4 per cent associate deforestation of the Aravalli foothills with the growth of urban areas, and 75.3% report that habitat fragmentation by infrastructure development is the cause of the human-wildlife conflicts. Also, 82.6% identify that loss of habitat through deforestation is detrimental to both animals and plants. Regression analysis predicts 40% of the variation in the perceptions of habitat losses, and one of the major predictors is the biodiversity loss (b = 0.534, p < 0.001). According to villagers, there are fewer observations of such species as foxes and Nilgai; on the contrary, there is a higher intrusion by wildlife that destroys crops and endangers domestic animals.
This study contributes to the field of knowledge because it relates local perceptions to frameworks of ecosystem services. Public concern between urbanisation and habitat concerns is mediated by the loss of biodiversity.39 Socio-ecological transformation to urban livelihoods and demographic and occupational changes, which shape environmental perceptions, are also documented in the study.
These findings align with global urbanization studies showing ecosystem degradation. However, the Aravalli context is unique due to its semi-arid ecology, historical significance as India's oldest mountain range, and dual pressure from both industrial expansion (Manesar-Gurugram corridor) and agricultural intensification. Unlike typical urban-rural transitions, these villages face rapid suburbanization while maintaining traditional livelihoods, creating distinctive conflicts between conservation and development absent in studies from other regions.40
Conclusion
Urbanisation is changing the ecosystem services of the Aravalli foothill villages of Gurugram in terms of land use change, demographic change and infrastructure development. The research demonstrates that the close relationships between population growth, shifts in occupations, and rising construction activities are associated with reduced agricultural land, groundwater stress, habitat fragmentation, and loss of biodiversity. Although the statistical outcomes can tell about different degrees of significance, community perceptions are very strong in terms of environmental degradation and increased pressure on local resources. Two important factors that affect the stability of an ecosystem and the relations between humans and the environment are infrastructure development and deforestation.
These results highlight how balanced planning strategies need to be adopted that will incorporate ecological conservation strategies with urban growth. It is necessary to reinforce the policies of sustainable land use, preserve the available green territories, and encourage community-conscious planning strategies to minimise the ecological risk in the long term. In general, the research can be helpful in comprehending the impact of rapid peri-urban change on delicate foothill ecosystems and has valuable implications for environmentally friendly urban development in regions of the same kind.
Acknowledgement
I would like to express my sincere gratitude to all those who have contributed to
the completion of this research. First and foremost, I am deeply thankful to my supervisor [Dr. Deepika Pandey], for her continuous guidance, invaluable insights, and unwavering support throughout this study. I would also like to acknowledge my co-supervisor whose expertise and collaboration were essential to the success of this research paper. Finally, I am grateful to my family for their encouragement and patience, which kept me motivated during this work. Without their support, this paper would not have been possible.
Funding Source:
The author(s) received no financial support for the research, authorship, and/or publication of this article.
Conflict of Interest
The authors do not have any conflict of interest.
Data Availability Statement
The data availability statement does not apply to this article.
Ethics Statement
This research was conducted in accordance with all relevant ethical guidelines. Participation in the survey was voluntary, with face-to-face interviews conducted only with willing participants who provided informed consent. The study design and submission adhere to the University Ethical Committee guidelines. Human ethics approval and consent to participate are not applicable.
Informed Consent Statement
Participation in the survey was voluntary, with face-to-face interviews conducted only with willing participants who provided informed consent.
Permission to reproduce material from other sources
Not Applicable
Author Contributions:
Sarina Biswas – Conceptualization, Data Collection, Data analysis, Data curation, Methodology, Writing original, Editing
Dr. Deepika Pandey – Conceptualization, Visualization, Supervision, Review and Editing
Dr. Yanglem Sharatchandra Khuman – Methodology, Visualization
References
- Beillouin D, Ben-Ari T, Malézieux E, Seufert V, Makowski D. Positive but variable effects of crop diversification on biodiversity and ecosystem services. Glob Change Biol. 2021;27(19):4697-4710.
CrossRef - Mandle L, Shields-Estrada A, Chaplin-Kramer R, et al. Increasing decision relevance of ecosystem service science. Nat Sustain. 2021;4(2):161-169.
CrossRef - Xiaomin, G., Chuanglin, F., Xufang, M., & Dan, C. (2022). Coupling and coordination analysis of urbanization and ecosystem service value in Beijing-Tianjin-Hebei urban agglomeration. Ecological indicators, 137, 108782. Retrieved from:https://www.sciencedirect.com/science/article/pii/S1470160X22002539
CrossRef - Luo Q, Zhou J, Zhang Y, Yu B, Zhu Z. What is the spatiotemporal relationship between urbanisation and ecosystem services? J Environ Manage. 2022;321:115709.
CrossRef - Xing L, Xue M, Hu M. The effect of urban–rural construction land transition on ecosystem services. Habitat Int. 2022;124:102576.
CrossRef - Peng J, Tian L, Liu Y, Wu J. Ecosystem services response to urbanization in metropolitan areas. Sci Total Environ. 2017;607-608:706-714.
CrossRef - Sharma P. Haryana to set up centre of excellence for planned urban development. The Tribune India. Published 2025.
- Prakash A, Singh S, Narain V. Changing waterscapes in the periphery: understanding peri-urban water security in urbanizing India. 2021.
- Bi Y, Zheng L, Wang Y, et al. Coupling relationship between urbanization and water-related ecosystem services. Ecol Indic. 2023;146:109871. doi:10.1016/j.ecolind.2023.109871.
CrossRef - Kumar R, Koli VK. Cultural and spatial dimensions of sacred sites in Aravalli Mountain range. SN Soc Sci. 2023;3(10):178.
CrossRef - Yadav N, Areendran G, Sarma K, Raj K, Sahana M. Susceptibility assessment of human–leopard conflict in Aravalli landscape. Model Earth Syst Environ. 2021;7:1459-1473.
CrossRef - Dhanwantri K, Yadav KK, Dhote M, Rajendra K. Anthropogenic determinants and ecological resilience of Aravalli. Res Square. 2023. doi:10.21203/rs.3.rs-3344537/v1.
CrossRef - Dhyani S, Sivadas D, Basu O, Karki M. Ecosystem health and risk assessments for mountain ecosystems of South Asia. Anthropocene Sci. 2022;1(1):211-225. doi:10.1007/s44177-022-00010-8.
CrossRef - Tyagi V, Singh SP, Kumar KM, Kumari M. Effectiveness of forest statutes in the conservation of Aravalli range. J Appl Nat Sci. 2023;15(3):1127-1136.
CrossRef - Eddy, T. D., Lam, V. W., Reygondeau, G., Cisneros-Montemayor, A. M., Greer, K., Palomares, M. L. D., ... & Cheung, W. W. (2021). Global decline in capacity of coral reefs to provide ecosystem services. One Earth, 4(9), 1278- 1285. Retrieved from:https://scholar.google.com/scholar?output=instlink&q=info:jj8bbJdn25UJ: scholar.google.com/&hl=en&as_sdt=0,5 &as_ylo=2021&scillfp=9787666596993396260&oi=lle
CrossRef - Mazhar SA, Anjum R, Anwar AI, Khan AA. Methods of data collection: a fundamental tool of research. J Integr Community Health. 2021;10(1):6-10.
CrossRef - Ailes EC, Werler MM, Howley MM, Jenkins MM, Reefhuis J. Real world data are not always big data. Am J Epidemiol. 2024. DOI:10.1093/aje/kwae060
CrossRef - Campbell, K. A., Orr, E., Durepos, P., Nguyen, L., Li, L., Whitmore, C., ... & Jack, S. M. (2021). Reflexive thematic analysis for applied qualitative health research. The Qualitative Report, 26(6), 2011-2028. Retrieved from: https://pdfs.semanticscholar.org/5082/ba717d4aaebc707e2e17d8eb1df536e74389.pdf
CrossRef - Parida JK. Rural–urban migration, urbanization, and wage differentials in urban India. In: Internal Migration, Urbanization, and Poverty in Asia. 2019:189-223.
CrossRef - Bhattacharyya, B., Biswas, R., Sujatha, K., & Chiphang, D. Y. (2021). Linear Regression Model to study the Effects of Weather variables on Crop yield in Manipur State. Int. J. Agricult. Stat. Sci, 17(1), 317-320. Retrieved from: https://www.researchgate.net/profile/Ria-Biswas-2/publication/352735410_LINEAR_REGRESSION_MODEL_ TO_STUDY_THE_EFFECTS_OF_ WEATHER_VARIABLES_ON_CROP_YIELD_IN_MANIPUR_STATE/links/60d5817092851ca94484ea16/LINEAR-REGRESSION-MODEL-TO-STUDY-THE-EFFECTS-OF-WEATHER-VARIABLES-ON-CROPYIELD-IN-MANIPUR-STATE.pdf
- Jfri, A., Nassim, D., O’Brien, E., Gulliver, W., Nikolakis, G., & Zouboulis, C. C. (2021). Prevalence of hidradenitis suppurativa: a systematic review and meta-regression analysis. JAMA dermatology, 157(8), 924-931. Retrieved from: https://jamanetwork.com/journals/jamadermatology/ articlepdf/2780049/jamadermatology_jfri_2021 _oi_210021_1628612408. 09101.pdf
CrossRef - Šverko Z, Vranki? M, Vlahini? S, Rogelj P. Complex Pearson correlation coefficient for EEG connectivity analysis. Sensors. 2022;22(4):1477.
CrossRef - Haralayya, B., & Aithal, P. S. (2021). Factors Determining The Efficiency In Indian Banking Sector: A Tobit Regression Analysis. International Journal of Science & Engineering Development Research (www. ijsdr.org), 6(6), 1-6. Retrieved from: https://www.researchgate.net/profile/Dr-Haralayya/publication/352029220_Factors_ Determining_the_Efficiency _in_ Indian_ Banking_Sector_An_Tobit_Regression_Analysis/links/60b638da299bf106f6eea724/Factors-Determining-the-Efficiency-in-Indian-Banking-Sector-An-Tobit-Regression-Analysis.pdf
CrossRef - Peng, S., Han, W. and Jia, G., 2022. Pearson correlation and transfer entropy in the Chinese stock market with time delay. Data Science and Management, 5(3), pp.117-123. Retrieved from: https://www.sciencedirect.com/science/article/pii/S2666764922000327
CrossRef - Hao N, Sun P, He W, et al. Water resources allocation in the Tingjiang River Basin. Water. 2022;14(18):2928. doi:10.3390/w14182928.
CrossRef - Wulandari MD. Working age population and CO? emissions in Indonesia. In: Proceedings of the International Conference on Data Science and Official Statistics. 2021;1:482-491.
CrossRef - Lu Z, Mahalik MK, Padhan H, Gupta M, Gozgor G. Effects of age dependency and urbanization on energy demand in BRICS. Front Energy Res. 2021. doi:10.3389/fenrg.2021.749065.
CrossRef - Wang Z. Population ageing, urbanization and housing demand. J Serv Sci Manage. 2015;8(4):516-525.
CrossRef - Pandey B, Zhang Q, Seto KC. Time series analysis of satellite data to characterize land use transitions. J Land Use Sci. 2018;13(3):1-17.
CrossRef - Molla MB. Urban expansion and agricultural land loss. Front Environ Sci. 2024;12.
CrossRef - Kanav A, Kumar S. Changes using remote sensing and landscape metrics. J Landsc Ecol. 2024;17(1):107-132.
CrossRef - Acharya R. Occupational shift from agricultural to non-agricultural sectors. J Educ Res. 2024;14(1):1-95.
CrossRef - Ray S, Ray IA. Impact of population growth on environmental degradation. J Econ Sustain Dev. 2011;2(8).
- Kangalawe RYM, Lyimo JG. Population dynamics, rural livelihoods and environmental degradation. Environ Dev Sustain. 2010;12(6):985-997.
CrossRef - Chen et al. Impacts of different rural settlement expansion patterns on eco-environment. Front Environ Sci. 2022;10.
CrossRef - Alam N et al. Population growth poses a significant threat to forest ecosystems. PLoS One. 2024. doi:10.1371/journal.pone.0302192.
CrossRef - Satterthwaite D. The implications of population growth and urbanization for climate change. Environ Urban. 2009;21(2):545-567.
CrossRef - Jiang L, Young HM, Hardee K. Population, urbanization, and the environment. World Watch. 2009;5.
- Hakim S, Naqqash T, Nawaz MS, et al. Rhizosphere engineering with plant growth-promoting microorganisms. Front Sustain Food Syst. 2021;5:617157. doi:10.3389/fsufs.2021.617157.
CrossRef - Ayompe LM, Schaafsma M, Egoh BN. Towards sustainable palm oil production. J Clean Prod. 2021;278:123914.
CrossRef


