Influence of Meteorological Parameters on Air Quality at Hashemite University, Jordan
Sana A Odat1 * , Mahmoud Abu-Allaban 2 and Khitam Odibat2
1
Department of Water Management & Environment,
The Hashemite University,
Faculty of Natural Resources and Environment,
Zarqa,
Jordan
Corresponding author Email: sanaa.owdat@yu.edu.jo
DOI: http://dx.doi.org/10.12944/CWE.12.2.04
Four threshold air pollutants (SO2, NO, NO2, and O3) in addition to meteorological parameters were monitored at the Campus of the Hashemite University (HU) for two years (1/1/2012 through 30/12/013). Correlations between air pollution and meteorological parameters were derived. The results showed that O3 has a positive correlation with air temperature, wind speed and wind direction, but has a negative correlation with the relative humidity (RH). SO2 was found to have a negative correlation with the RH and wind speed, but positive correlation with air temperature. NO has negative correlation with air temperature, RH, and wind speed. And finally, NO2 has a negative correlation with RH and wind speed, but it has positive correlation with air temperature. Justify the reasons in brief with recommendations to improve the air quality
Copy the following to cite this article:
Odat S, Abu-Allaban M, Odibat K. Influence of Meteorological Parameters on Air Quality at Hashemite University, Jordan. Curr World Environ 2017;12(2). DOI:http://dx.doi.org/10.12944/CWE.12.2.04
Copy the following to cite this URL:
Odat S, Abu-Allaban M, Odibat K. Influence of Meteorological Parameters on Air Quality at Hashemite University, Jordan. Curr World Environ 2017;12(2). Available from: http://www.cwejournal.org/?p=17515
Download article (pdf)
Citation Manager
Publish History
Select type of program for download
| Endnote EndNote format (Mac & Win) | |
| Reference Manager Ris format (Win only) | |
| Procite Ris format (Win only) | |
| Medlars Format | |
| RefWorks Format RefWorks format (Mac & Win) | |
| BibTex Format BibTex format (Mac & Win) |
Article Publishing History
| Received: | 2017-07-12 |
|---|---|
| Accepted: | 2017-08-13 |
Introduction
Air pollution in North Africa and the Middle East is receiving increase attention due to its health consequences.1,2,3,4 The Middle East is impacted by frequent dust storms in addition to regional long range transport of air pollution, carried by winds from three neighboring continents: Europe, Africa, and Asia.5
The Hashemite Kingdom of Jordan with a population of eleven million and a land area of 89,000 square kilometers, has undergone an unprecedented rate of growth in the last fifteen years due to regional political crises. Rapid development of the industrial sector, coupled with the lack of zoning and environmental protection legislation, has contributed to the deterioration of the Jordanian environment. For example, emissions from motor vehicles or old industrial establishments are not regulated throughout the country.6
Anthropogenic sources of air pollution in north Jordan include motor natural dust, vehicles, utility, smelters, cement factories, and open burning. The city of Zarqa at the middle region in Jordan where the Hashemite University Campus (HUC) is located is exhibiting rapid growing industrial activities with a population of about one million inhabitants.7 It contains more than 35% of the Jordanian industry by number including an oil refinery, a thermal power plant, steel factories, a pipe factory, a cement factory, a fertilizers factory, a waste water treatment plant, as well as several other small industrial facilities.4 As a result of such concentrated anthropogenic activities, air quality in Zarqa is questionable.
This paper aims at studying air quality at HUC and examined the influence of weather conditions on the concentrations of NO, NO2, SO2, and Ozone. More than 40,000 students and employees are spending most of their daily hours inside the campus, which is located downwind from the oil refinery and the thermal power plant.
Methodology
Sampling Location
The Hashemite University (Figure 1) is a public Jordanian university commissioned in the academic year 1995/1996. It has become one of the largest universities in Jordan. Total area of the campus is about 8500 hectares; 15% of which are designated for buildings, roads, sport facilities and other structures. The rest is meant to be planted by different tress, but in reality only one fourth of the campus is planted with olive trees. The Hashemite University has 13 Colleges including the Faculty of Natural Resources and Environment which owns and operates the air quality monitoring station that is deployed to collect required data for this study.
![Figure (1): sample location at the campus of the Hashemite University, (32.099207, 36.200353) coordinates.[8]](http://www.cwejournal.org/wp-content/uploads/2017/08/Vol12_No1_Inf_San_Fig1-150x150.jpg) |
|
Data Collection
Instrumentation
Air quality and meteorological parameters were monitored by the air quality monitoring station in the research and teaching laboratory in the faculty of natural resources and environment inside the campus of the Hashemite University. The station is designed to provide continuous readings of criteria atmospheric pollutants including O3, NO2 , NO, NOx and SO2 concentrations; and meteorological parameters such as temperature, relative humidity, and wind speed. Continuous automatic measurement of above parameters were recorded every five minutes for the periods of1/1/2012 to 30/12/2013. Ozone is measured by a UV Photometric O3 Analyzer, NOx by a Chemiluminnescence NO-NO2-NOx Analyzer and SO2 by pulsed Fluorescence SO2 Analyzer (Thermo Fisher Scientific, Waltham, MA-USA). Mention reference for methodology.
Statistical Analysis
Collected air quality data was exported into SPSS software format in order to perform advanced statistical analysis including basic statistics; temporal variability and correlations multivariate.
Results and Discussion
Statistical Characterization of Climatic Variables and Air Pollutants
Data analyses were started by calculating ordinary statistics including mean, standard deviation (SD), maximum, minimum, Coefficient of Variation (CV), Skewness, and Kurtosis (Table 1).
Table 1: Descriptive statistics for Air Pollutants and climatic variables.
|
Parameter |
Min |
Max |
Average |
SD |
CV |
Skewness |
Kurtosis |
|
NOx |
0 |
390.16 |
9.03 |
9.20 |
101.81 |
77.7 |
159.39 |
|
NO2 |
0 |
410.14 |
15.67 |
11.90 |
75.97 |
3.69 |
58.06 |
|
NO |
0 |
228.76 |
1.17 |
2.94 |
250.20 |
16.98 |
744.03 |
|
O3 |
0 |
500.31 |
55.56 |
23.78 |
42.81 |
0.72 |
1.13 |
|
SO2 |
0 |
221.41 |
2.83 |
4.95 |
174.90 |
12.57 |
240.02 |
|
Wind Direction |
0.76 |
350.04 |
225.46 |
70.10 |
31.09 |
-0.66 |
-0.52 |
|
Wind Speed |
0.271 |
29.70 |
3.35 |
2.29 |
68.43 |
1.04 |
1.54 |
|
RH% |
5.31 |
97.90 |
51.50 |
20.89 |
40.55 |
-0.09 |
-1.08 |
|
Temperature |
-4.45 |
43.34 |
18.40 |
7.52 |
40.87 |
0.08 |
-0.61 |
Temporal Variation of Oxides
The results of linear regression analyses for SO2, NO, NO2, NOx and O3 in time, daily, monthly, and yearly basis, using ANOVA tests, are presented in Tables 2-5, respectively. The results indicate that the changes are not exactly linear, however the attenuations could be attributed to many factors such as human induced activities (e.g. daily factories working hours, vacations, diversity of burning fuel type, factory malfunctions, etc) or could be attributed to climatic variables as temperature, wind speed and relative humidity. The severity of the change in pollutant concentration with time can be estimated by the magnitude of the slope.
Table 2: Changes of air pollutants on Time basis
|
Pollutants |
Linear Equation |
F-test |
R2 |
RMSE |
|
SO2 |
SO2 = 36.16 - 9.6879e-9*Time |
<.0001* |
0.001271 |
54.9 |
|
NO |
NO = 5.32 - 1.2099e-9*Time |
0.0002* |
6.426e-5 |
52.7 |
|
NO2 |
NO2 = 515.51 - 1.4533e-7*Time |
0.0000* |
0.049919 |
511.5 |
|
NOx |
NOx = -74.96 + 2.44e-8*Time |
<.0001* |
0.002371 |
9.12 |
|
O3 |
O3 = -1071.84 + 3.28e-7*Time |
<.0001* |
0.061755 |
23.27 |
Table 3: Changes of air pollutants over Day Time
|
Pollutants |
Linear Equation |
F-test |
R2 |
RMSE |
|
SO2 |
SO2 = 2.90 - 0.00459*Day |
0.0002* |
6.64e-5 |
4.95 |
|
NO |
NO = 1.04 + 0.01*Day |
<.0001* |
0.00056 |
2.75 |
|
NO2 |
NO2 = 14.69 + 0.054*Day |
<.0001* |
0.001599 |
11.84 |
|
NOx |
NOx = 8.87 + 0.01*Day |
0.0010* |
5.111e-5 |
9.13 |
|
O3 |
O3 = 55.1 + 0.055*Day |
<.0001* |
0.000404 |
24.02 |
Table 4: Changes of air pollutants over Month Time
|
Pollutants |
Linear Equation |
F-test |
R2 |
RMSE |
|
SO2 |
SO2 = 3.053 - 0.034*Month |
<.0001* |
0.000553 |
4.95 |
|
NO |
NO = 0.66 + 0.08*Month |
0.0000* |
0.009068 |
2.74 |
|
NO2 |
NO2 = 6.49 + 1.38*Month |
0.0000* |
0.159523 |
10.86 |
|
NOx |
NOx = 7.49 + 0.23*Month |
0.0000* |
0.007333 |
9.099 |
|
O3 |
O3 = 36.28 + 3.002*Month |
0.0000* |
0.183735 |
21.71 |
Table 5: Changes of air pollutants over years:
|
Pollutants |
Linear Equation |
F-test |
R2 |
RMSE |
|
SO2 |
SO2 = 549.84 - 0.27*Year |
<.0001* |
0.000754 |
4.95 |
|
NO |
NO = 721.74 - 0.36*Year |
<.0001* |
0.004239 |
2.74 |
|
NO2 |
NO2= 23338.92 - 11.59*Year |
0.0000* |
0.239152 |
10.33 |
|
NOx |
NOx = -230.15 + 0.12*Year |
0.0027* |
4.231e-5 |
9.13 |
|
O3 |
O3 = -3877.79 + 1.95*Year |
<.0001* |
0.001654 |
24.01 |
Comparison between Mean Values using Tukey-Kramer HSD
Monthly Variation
A comparison between mean values calculated using the Tukey-Kramer HSD method is presented in Table (6) for monthly variation of climatic variables and air pollutants. Concentrations are classified into classes where class A denotes highest concentration, while class L represents the lowest concentration or pollution level. For example higher ozone values are recorded in September and August, whereas January and February experienced the lowest O3 concentration. Temperature exhibits a similar trend.
Table 6: Monthly variation and means of Climatic Variables and Air Pollutants through months.
|
Month |
Climatic Variables |
Air Pollutants |
|||||||
|
Temperature |
RH% |
Wind Speed |
Wind Direction |
SO2 |
NOx |
NO |
NO2 |
O3 |
|
|
1 |
11.17J |
62.05A |
3.05G |
194.83JK |
4.01A |
9.14CD |
1.20D |
9.53I |
32.49L |
|
2 |
11.90I |
58.89B |
3.35E |
203.27I |
2.94D |
9.38C |
1.08E |
9.77HI |
37.75K |
|
3 |
15.35G |
55.23D |
3.29EF |
216.37G |
2.59E |
9.38C |
0.92F |
10.05H |
40.28J |
|
4 |
18.44F |
44.03H |
3.23F |
232.51F |
2.41F |
8.88D |
0.81GH |
9.66I |
45.75I |
|
5 |
21.87E |
41.04I |
3.54D |
243.52E |
2.72E |
8.40E |
0.84FG |
11.94G |
51.57H |
|
6 |
23.54B |
46.04G |
4.18A |
247.57D |
3.46C |
7.84F |
1.06E |
18.26C |
60.23D |
|
7 |
23.38B |
53.09E |
3.70C |
257.64A |
3.30C |
6.61G |
0.93F |
17.20D |
59.31E |
|
8 |
24.69A |
48.70F |
4.02B |
254.29B |
1.99H |
5.46I |
0.76GH |
14.84F |
82.17A |
|
9 |
22.50C |
52.67E |
3.65C |
251.00C |
1.33I |
5.83H |
0.74H |
16.64E |
78.62B |
|
10 |
22.18D |
37.31J |
2.65I |
209.22H |
2.19G |
11.06B |
1.32C |
21.55B |
66.25C |
|
11 |
13.32H |
56.99C |
2.57J |
192.58K |
3.37C |
13.18A |
2.06B |
23.34A |
57.01F |
|
12 |
11.11J |
62.48A |
2.80H |
196.11J |
3.78B |
13.25A |
2.20A |
23.19A |
54.35G |
The concentrations of NO, NO2 ,NOx and SO2 are high in winter months (January, February, November and December), and low in Spring and Summer months ( April, May, June, July, August and September). It seems that in June month there is relatively high concentration of these pollutants and the reason for this also, is due to low abnormal temperature or heavily working hours at that time. Whereas the concentration of O3are high in summer months (June, July, August and September) and low in winter and Autumn months ( January, February, November and December) and this because Ozone is a greenhouse gas depends on temperature in its formation which they have a strong positive relationship between them and have the same tend.
All of air pollutants including (NO, NO2, NOx, SO2) have shown a negative relationship with ozone concentration. The levels of various air pollutants are closely correlated with the level of heavily working hours. Therefore heavily working hours affects the concentration of these pollutants.
Annual Variation
Table (7) indicates that there is little deferent between annual means of air pollutants and meteorological parameters as calculated using the nonlinear regression analysis of the Tukey-Kramer HSD. Temperature, SO2 , NO and NO2 are higher in the year of 2012 which take A class, but considered to be class B in 2013. However, O3, NOx, RH%, and wind speed are higher in 2013.
Table 7: Annual variation and means of meteorological parameters and air pollutants
|
Year |
Climatic Variables |
Air Pollutants |
|||||||
|
Temperature |
RH% |
Wind Speed |
Wind Direction |
SO2 |
O3 |
NO |
NO2 |
NOx |
|
|
2012 |
18.9A |
50.6B |
3.33B |
225.13A |
2.96A |
54.96B |
1.34A |
21.44A |
8.92B |
|
2013 |
17.9B |
52.3A |
3.35A |
225.65A |
2.69B |
56.91A |
.098B |
9.85B |
9.04A |
Stepwise Regression Analysis (Fit Model)
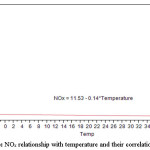
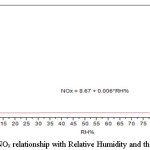
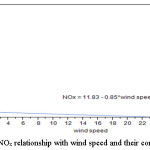
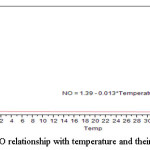
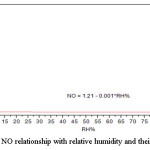
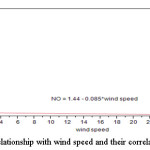
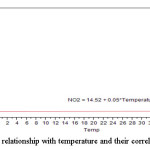
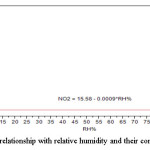
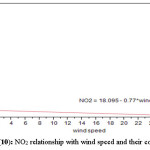
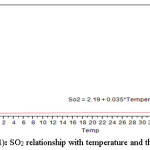
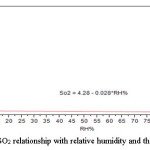
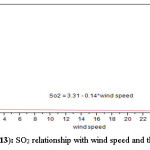
According to stepwise regression analyses using Fit Model algorithm within JMP software, indicated that all climatic variables are highly effective on pollutant concentrations (P<0.0001) and thus cannot be removed from the full model. According to Table (8) the concentration of pollutants varies in its relation to climatic variables. The rate of each climatic variable on the final prediction of the air contaminant can be distinguished by the associated slope that has a scientific meaning Figure (2) to Figure (13).
Table 8: Step wise regression analyses for the measured air pollutants as affected by all Climatic variables.
|
Parameter |
SWR Equation |
F-test |
R2 |
RMSE |
|
SO2 |
SO2= 5.5120626-0.008771*Temperature-0.035511* RH%-0.207024*Wind Speed |
0.0000* |
0.02342 |
4.89 |
|
NO |
NO=2.1239881-0.017782*Temperature-0.007371* RH%-0.077986*Wind Speed |
<.0001* |
0.00671 |
42.7 |
|
NO2 |
NO2=13.049102+0.2281184*Temperature+0.0308087*RH%-0.987845*Wind Speed |
0.0000* |
0.03323 |
511.6 |
|
NOx |
NOx=16.603619-0.138474*Temperature-0.04792* RH%-0.779246*Wind Speed |
0.0000* |
0.05318 |
98.8 |
|
O3 |
O3=5.90+1.92*Temperature+0.159*RH%+1.97*Wind Speed |
0.0000* |
0.37529 |
18.99 |
 |
|
 |
|
 |
|
 |
|
 |
|
 |
|
 |
|
 |
|
 |
|
 |
|
 |
|
 |
|
Multivariance correlation between climatic variables and air pollutants
The Multivariance method is deployed to retrieve correlations between air pollutants and basic meteorological parameters. Results are summarized in Table (9):
Table 9: Correlation between air pollutants and meteorological
|
Temperature |
RH% |
Wind Speed |
SO2 |
NOx |
NO |
NO2 |
O3 |
|
|
Temperature |
1.0000 |
-0.69 |
0.38 |
0.05 |
-0.114 |
-0.035 |
0.035 |
0.58 |
|
RH% |
-0.69 |
1.000 |
-0.23 |
-0.12 |
0.014 |
-0.008 |
-0.002 |
-0.32 |
|
Wind Speed |
0.38 |
-0.23 |
1.0000 |
-0.07 |
-0.21 |
-0.071 |
-0.14 |
0.38 |
|
Wind Direction |
0.31 |
-0.02 |
0.33 |
-0.1 |
-0.04 |
-0.03 |
0.007 |
0.31 |
|
SO2 |
0.05 |
-0.12 |
-0.07 |
1.0000 |
0.25 |
0.24 |
0.14 |
-0.07 |
|
NOx |
-0.114 |
0.014 |
-0.21 |
0.25 |
1.0000 |
0.62 |
0.65 |
-0.25 |
|
NO |
-0.04 |
-0.008 |
-0.07 |
0.24 |
0.62 |
1.0000 |
0.39 |
-0.12 |
|
NO2 |
0.035 |
-0.002 |
-0.15 |
0.14 |
0.65 |
0.39 |
1.0000 |
-0.02 |
|
O3 |
0.58 |
-0.32 |
0.38 |
-0.07 |
-0.25 |
-0.12 |
-0.02 |
1.000 |
Based on the findings presented in Table (9), the following remarks are derived:
Temperature has strong negative relationship with RH%, weak negative relationship with NOx and NO, moderate positive relationship with Wind Speed, Wind Direction, week positive relationship with NO2 and SO2, and strong positive relationship with O3.
RH% has strong negative relationship with temperature, moderate negative relationship with wind speed, weak negative relationship with O3, SO2, NO, and NO2. However, it has weak positive relationship with Wind Speed and NOx.
Wind Speed has weak negative relationship with SO2, NO, NO2, moderate negative relationship with RH%, NOx, and moderate positive relationship with Temperature and Wind Direction and O3.
SO2 has weak negative relationship with Wind Speed, Wind Direction, RH%, and O3, and weak positive relationship with Temperature, NO2, moderate positive relationship with NOx and NO.
O3has weak negative relationship with SO2, NO, NO2, moderate negative relationship with RH%, NOx, moderate positive relationship with Wind Speed, and Wind Direction, and strong positive relationship with temperature.
NO has weak negative relationship with temperature, wind speed and wind direction, RH% and O3, moderate positive relationship with SO2, NO2, strong positive relationship with NOx.
NO2 has weak negative relationship with wind direction, RH%, O3, weak positive relationship with temperature, SO2 and wind Speed, moderate positive relationship with NO, and strong positive relationship with NOx.
NOx has weak negative relationship with temperature, wind direction, and moderate negative relationship with Wind speed, O3 and weak to moderate positive relationship with SO2, RH% and strong positive relationship with NO, NO2.
Conclusion
The findings of this study show that variation trends of SO2, NO, NO2, NOx and O3 correlate well with meteorological conditions parameters. O3 demonstrates a positive correlation with air temperature, wind speed and wind direction and a negative correlation with the relative humidity. SO2 has a negative correlation with the relative humidity and wind speed and a positive correlation with air temperature. NO shows a negative correlation with air temperature, relative humidity and wind speed. And NO2 demonstrates a negative correlation with relative humidity and wind speed and a positive correlation with air temperature.
Acknowledgment
We are grateful to all staff in air quality monitoring station in the research and teaching laboratory in the faculty of natural resources and environment inside the campus of the Hashemite University for the logistic support to conduct our current research work.
References
- Abu-Allaban, M.; Al-Jedaih, M.; Al-Malabeh, A.; Suleiman, Emission Rates of Gaseous Pollutants from Motor Vehicles. JJC, 2: (2), 199-209 (2011).
- Hamasha, K. M.; Almomani, M. S.; Abu-Allaban, M.; Arnot, W. P. Study of Black Carbon Levels In City Centers And Industrial Centers In Jordan. Jordanian Journal of Physics, 3: (1), 1-8 (2010).
- Abu-Allaban, M.; Al-Jedaih, M.; Al-Malabeh, A.; Suleiman, A. Emission Rates of Gaseous Pollutants from Motor Vehicles. JJC, 2: (2), 199-209 (2007).
- Hamasha, S.; Abu-Allaban, M. Modeling Atmospheric Turbidity at Zarqa Area Using Meteorological Data. Jordanian Journal of Physics, 1: (1), 53-60 (2008).
- Kallos, G., Astitha, M., Katsafados, P., Spyroa, C. Long-Range Transport Of Anthropogenically And Naturally Produced Particulate Matter In The Mediterranean And North Atlantic: Current State Of Knowledge. J Applied Meteorology And Climatology ,46: 1230- 1251(2006).
CrossRef - Al-Hasaan, A. T. F. Air Pollution Monitoring In Amman, Jordan. Journal Of The Air & Waste Management Association, 814-816(2012).
- Abu-Allaban, M., El-Khalili, M., M.,. Antiquity Impact of Air Pollution at Gadara, Jordan. Mediterranean Archaeology and Archaeometry, Vol. 14, No 1, Pp. 191-199 (2013).


