Assessment of River and Groundwater Quality and its Suitability for Domestic Uses in Aurangabad, Maharashtra, India
S. D Shinde1 * , K. A Patil1 and P. A Sadgir1
1
Government College of Engineering,
Aurangabad,
M.S
India
DOI: http://dx.doi.org/10.12944/CWE.11.2.12
The ongoing degradation of the water quality of central Maharashtra’s basaltic aquifer is of great concern for different authorities and agencies involved in the water sector in the Maharashtra, India. The Kham river, which is one of the major tributaries of the Godavari river, receives all domestic and industrial waste water from the Aurangabad city. The river, with no natural flow in the dry season, is extensively used for irrigation. In order to evaluate the quality of river and groundwater in the study area, eight river water and forty groundwater samples along right and left bank of the Kham river were collected and analyzed for various parameters. Physical and chemical parameters of the river and groundwater such as pH, TDS, EC, SO4, NO3 and heavy metals like Pb, Cr, Cd, Zn, and Cu were determined. The results show that the river and groundwater of the area is generally unfit for domestic uses. Most of the physico-chemical parameters and heavy metals in the river and groundwater samples have higher value than the World Health Organization (WHO, 2006) and Bureau of Indian Standards (BIS, 2003) guidelines.
Copy the following to cite this article:
Shinde S. D, Patil K. A, Sadgir P. A. Government College of Engineering, Aurangabad, M.S., India. Curr World Environ 2016;11(2) DOI:http://dx.doi.org/10.12944/CWE.11.2.12
Copy the following to cite this URL:
Shinde S. D, Patil K. A, Sadgir P. A. Government College of Engineering, Aurangabad, M.S., India. Curr World Environ 2016;11(2). Available from: http://www.cwejournal.org/?p=15447
Download article (pdf)
Citation Manager
Publish History
Select type of program for download
| Endnote EndNote format (Mac & Win) | |
| Reference Manager Ris format (Win only) | |
| Procite Ris format (Win only) | |
| Medlars Format | |
| RefWorks Format RefWorks format (Mac & Win) | |
| BibTex Format BibTex format (Mac & Win) |
Article Publishing History
| Received: | 2016-03-30 |
|---|---|
| Accepted: | 2016-07-10 |
Introduction
Water is very important life supporting material and required for all biotic communities. We depend on water for domestic, irrigation, sanitation and industrial purposes. Industrialization is considered vital to the nation’s socio economic development as well as to its political standing in the international community. While development aims at bringing about positive changes in human life, uncontrolled consumption of natural resources both in developed and developing countries have inadvertently led to environmental degradation, pollution incurable diseases, poverty social conflicts.1-2 Hence periodic assessment of groundwater becomes necessary to ensure the suitability of water for drinking and irrigation. The impairment of water quality due to the introduction of pollutant is a problem of industrial cities around the world.3-6 Heavy metal is major pollutant in water bodies because of industrial and municipal waste discharge into the environment without proper treatment.7,4,6 Heavy metals in groundwater are toxic even at low concentrations. Health risks of heavy metals include reduced growth and development, cancer, organ damage, nervous system damage, and in extreme cases, death. Exposure to some metals, such as mercury and lead, may also lead to autoimmunity.8 Heavy metals become toxic when they are not metabolized by the body and accumulate in the soft tissues. As noted above, heavy metals may enter the human body via food, water, air, or absorption through the skin in agriculture, industrial. In recent past many researchers have worked on water quality for different purposes.36,9-24
Problems in Study Area
There are three main sources of the river and groundwater pollution in study area which includes domestic waste disposal activities, industrial effluent disposal, leaks and non point source activities such as agricultural management practices. Here in surrounding area of the Kham river the groundwater is spoiled due to waste disposal and improper agricultural practices. Total generation of sewage in Aurangabad city is 107 MLD. Total quantity of industrial effluent generated from Waluj MIDC area is 10.72 MLD and total domestic effluent generated is 3.928 MLD. (Aurangabad MPCB report -2011). Therefore, water quality monitoring is necessary in and around the Kham river. In the present work, attempts have been made to evaluate the water quality of surface and groundwater resources in the Aurangabad district of Maharashtra, India by using conventional hydro-chemical methods and preparing thematic maps for the various water quality parameters.
Experimental
Methodology Adopted
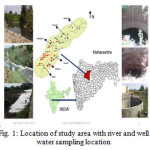
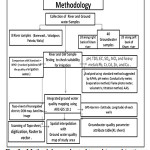
The river and ground water quality parameter were collected and analyzed in the laboratory. The water quality parameters are given in database to ARC-GIS 10.1. The Aurangabad and Gagapur map was scanned and digitized (Fig.1). The spatial interpolation was done on the basis of attribute values of the water quality parameters and for each parameter the spatial analysis was done and map was created. Finally, integrated water quality map of study area was prepared considering the groundwater quality data using ARC VIEW GIS 10.1 (Fig. 2). Geographic information system (GIS) is an effective technique for the zone mapping, risk assessment and also useful for taking quick decisions on environmental health problems.25-29
River and Groundwater Sampling
The river water samples were collected at eight different points along the river Kham as shown in Fig.1. Groundwater samples were collected from 40 dug wells on either side of the kham river from four different villages situated near WALUJ MIDC. Figure 1 shows location of the wells in the study area. The water samples were collected in 2-liter high density polyethylene bottles (pre-cleaned with 10% nitric acid followed by repeated rinsing with bi-distilled water. The collected samples have been stabilized with ultrapure nitric acid (0.5%HNO3), preserved in a cool place (about 4ËšC) and transported to the laboratory for further analysis.
 |
|
 |
|
Analysis of Water Resources
The physico-chemical parameters investigated are pH, electrical conductivity (EC), total dissolved solids (TDS), sulphate, and nitrate was measured in the laboratory immediately after the arrival of the samples according to standard methods. The samples were then analyzed for the following heavy metals Pb, Cr, Cd, Zn, Cu which are dissolved in water by Atomic absorption Spectrophotometer (AAS-7000). All concentrations were determined using the absorbance made with air- acetylene flame. Five working solutions were prepared from the stock solutions for each of the standard solutions was then aspirated into the flame of AAS and the absorbance recorded in each case.
Results and Discussion
River Water
The physico-chemical parameters and heavy metals of the analytical results of river water were compared with the standard guideline values recommended by the World Health Organization35 and Bureau of Indian Standards34 for drinking and domestic uses (Table 1 and 2).
Table 1: Summary of the river water samples analytical data and compare with WHO and Indian Standard (IS 10500) for domestic purposes
|
Sr. No |
Water quality parameters |
RVI |
RVII |
RPI |
RPII |
RNI |
RNII |
RWI |
RWII |
WHO 2006 |
BIS2003(IS 10500) |
|
|
Max. desirable |
Highest permissible |
|||||||||||
|
1 |
pH |
9.5 |
6.3 |
5.8 |
5.7 |
5.68 |
5.5 |
5.8 |
5.76 |
7-8.5 |
6.5–8.5 |
8.5–9.2 |
|
2 |
EC |
3460 |
6340 |
6321 |
6230 |
6800 |
7260 |
7120 |
8320 |
750 |
- |
- |
|
3 |
TDS |
2841 |
3374 |
4552 |
3488 |
3936 |
4552 |
4379 |
4038 |
500 |
500 |
2000 |
|
4 |
NO3 |
130 |
160 |
105 |
132 |
135 |
125 |
130 |
140 |
50 |
45 |
100 |
|
5 |
SO4 |
754 |
630 |
541 |
520 |
550 |
503 |
506 |
580 |
200 |
200 |
400 |
All concentration in mg L-1, except pH, EC (µS cm-1)
Table 2: Summary river water dissolved metals (mg L-1) compared to WHO and Indian Standards (IS: 10500) for domestic purposes.
|
Sr. No |
Water quality parameters |
RVI |
RVII |
RPI |
RPII |
RNI |
RNII |
RWI |
RWII |
WHO 2006 |
BIS2003(IS 10500) |
|
|
Max. desirable |
Highest permissible |
|||||||||||
|
1 |
Pb |
0.0280 |
0.0550 |
7.86 |
6.65 |
4.56 |
6.86 |
7.86 |
5.65 |
0.01 |
0.05 |
No relaxation |
|
2 |
Cr |
0.0063 |
0.0072 |
0.0098 |
0.060 |
0.089 |
0.210 |
1.60 |
2.980 |
0.05 |
0.05 |
No relaxation |
|
3 |
Cd |
0.0031 |
0.0089 |
0.0043 |
1.020 |
1.080 |
1.97 |
1.16 |
1.290 |
0.003 |
0.01 |
No relaxation |
|
4 |
Zn |
17.05 |
19.05 |
21.40 |
22.4 |
22.45 |
25.6 |
24.6 |
23.2 |
4.0 |
5.0 |
15.0 |
|
5 |
Cu |
0.0091 |
0.0820 |
0.129 |
0.15 |
0.19 |
0.20 |
1.85 |
2.30 |
2.0 |
0.05 |
1.5 |
Groundwater Water Quality Mapping
The following parameters were recorded at the site of collection; name of sample; zone and time and date of collection, place of the collection using Garmin instrument to record latitude and longitude of sampling wells in study area (Table 3). To prepare groundwater quality maps, Aurangabad and Gangapur taluka map was scanned and digitized. Scanning results in the conversion of the image into array of pixels that are arranged in rows and columns. Digitization is the process which converts raster to vector format spatial interpolation is a process of using points with known values to estimate values of other point. Spatial interpolation is a means of converting point data to surface data. Finally integrated groundwater quality map was created using ARC-GIS 10.1.
Discussions
Physical and Chemical Parameters
pH
The pH of all river water at villages Valadgaon was not found within the guidelines range of the WHO 2006 and BIS 2003, The pH of river water sample at village Valadgaon is alkaline in nature with pH value 9.83 and pH of river water sample at village was found acidic in nature. Remaining all river and groundwater samples was slightly alkaline in nature.
Electrical Conductivity (EC)
Electrical conductivity (EC) tells about the conducting capacity of water which in turn is determined by the presence of dissolved ions. Higher the ionisable solids, greater will be the EC. EC is a measure of total dissolved solids (TDS) i.e. - it depend upon the ionic strength of the solution. The conductivity exhibited by the water samples obtained from the river water from different villages was higher than the WHO and BIS gridlines with the highest value obtained in river water from village Banewadi having a value of 6520 (Table 1) followed by the river water at village Waluj after the waste water from MIDC with a value of 6400 µS cm-1 (Table 1).
Total Dissolved Solids (TDS)
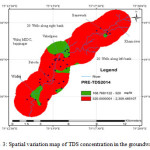
The concentration of total dissolved solids obtained from all river water samples was found to be above the set of the WHO and BIS gridlines. The groundwater samples collected from 40 dug well were greater than 320 mg L-1. The highest concentration was observed in the groundwater from village Waluj had concentration of 2140 mg L-1 (Fig. 3). The high concentration of TDS in the water resources is mainly caused by vegetative decay and disposal of effluent in water from industries through different streams.
 |
|
Nitrate (NO3)
The chief sources of nitrate are atmospheric precipitation, application of fertilizers, animals waste and discharges of municipal or domestic sewage.30,31 The nitrate concentration obtained from all the river water samples were found to be above the set guidelines of the WHO and BIS. The river water exhibits nitrate concentration above MPL at all villages. The groundwater samples from 16 dug-wells along the kham river basin shows a higher concentration than WHO and BIS guidelines. A high concentration of nitrate is due to used of chemical fertilizer in agricultural activities and disposal of sewage/manure in the study area. Excessive NO3 in drinking water can cause a number of disorders including methaemoglobinaemia in infants, gastric cancer, goitre, birth malformations and hypertensions.33
Sulphate (SO4)
Sulphates in the water commonly derived from the oxidative weathering of sulphide bearing minerals, such as pyrite (FeS2); however, gypsum (CaSO4·2H2O) and anhydrite (CaSO4) can also be a sulphate source.32,21,22 All the river water samples and same samples of groundwater exceeded the desirable limit of the WHO and BIS in the study area. Higher concentration of sulphate in drinking water is associated with respiratory problems (Subba1993). Water with 200–400 mg L−1 sulphate has a bitter taste and those with 1000 mg L−1 or more can have laxative effect.21,22
Heavy Metals Content in Water Resources
Chromium (Cr)
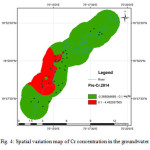
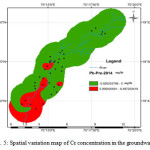
The concentration of chromium found in the four river water samples and eight groundwater samples was significantly higher than the WHO and BIS guidelines for domestic use (Fig. 4).
Lead (Pb)
The concentration of lead in the in the six river water samples and eleven groundwater samples was higher than the WHO and BIS guidelines for domestic use (fig. 5).The groundwater sample of well no. W-RW-1 shows higher value than the MPL. While the river water sample at RV1, RP1 and well water sample were found to be below WHO and BIS guideline value for domestic uses.
 |
|
 |
|
Conclusion
The results of the study indicate that the kham river water is highly polluted. Aurangabad and Gangapur taluka is under threat due to critical issue of the river and groundwater pollution .EC of groundwater increased towards the south of Aurangabad city. The analysis in respect of Physical and chemical parameters of the river and groundwater such as pH, TDS, EC, SO4, NO3 and heavy metals like Pb, Cr, Cd, Zn, Cu revels most of the river water samples have exceeded the permissible limit prescribed by the WHO and BIS . The river water which is contaminated by partly or untreated domestic and industrial sewage has penetrated through the soil and contaminated the groundwater of the village Banewadi, Valadgaon, Patoda and Waluj. This GIS based study suggests that the river and groundwater of the area contaminated due to anthropogenic activities, and water quality status monitoring programme should be needed.
Acknowledgements
The Author is grateful to Dr. K. A. Patil Head of the Department of Civil Engineering, Government Engineering College Aurangabad and sincerely thankful to Dr. P. A. Sadgir for his moral support and guidance in the preparation of the paper. We are also thankful to lab members for their support and encouragement.
References
- Hong IL AHN, Hyo-Taek Chon (1999) Assessment of Groundwater Contamination Using Geographic Information system. Environmental Geochemistry and health 21,273-289
CrossRef - Nosrat Aghazadeh, Asghar Asghari Mogaddam (2010) Assessment of Groundwater quality and its suitability for drinking and agricultural uses in the Oshnavieh Area, Nortwest of Iran. Journal of Environmental Protection. doi:10.4236/jep.2010.11005
CrossRef - Elangovan NS, Dharmendiumar M (2013) Assessment of groundwater quality along the cooum river Chennai, Tamilnadu, India. Journal of Chemistry, id-672372
- Tiwari AK, De Maio M, Singh PK, Mahato MK (2015a) Evaluation of surface water quality by using GIS and a heavy metal pollution index (HPI) model in a coal mining area, India. Bull Environ Contam Toxicol 95:304–310
CrossRef - Panigrahy BP, Singh PK, Tiwari AK, Kumar B, Kumar A (2015a) Assessment of heavy metal pollution index for groundwateraround Jharia coalfield region, India. J Bio Env Sci 6(3):33–39
- Tiwari AK, Singh PK, Singh AK, De Maio M (2016a) Estimation of Heavy Metal Contamination in Groundwater and Development of a Heavy Metal Pollution Index by Using GIS Technique. Bull Environ Contam Toxicol 96(4):508-515.
CrossRef - Mahato MK, Singh PK, Tiwari AK (2014) Evaluation of metals in mine water and assessment of heavy metal pollution index of East Bokaro Coalfield area, Jharkhand, India. Int J Earth Sci Eng 7(04):1611–1618
- Bichi MH, Bello UF (2013) Heavy Metal Pollution in Surface and Ground waters Used for Irrigation along River Tatsawarki in Kano,Nigwria. IOSR Journal of Engineering ,2013, Vol 3, Issue 8 PP 01-09.
- Singh PK, Tiwari AK, Mahato MK (2013a) Qualitative assessment of surface water of West Bokaro Coalfield, Jharkhand by using water quality index method. Int J Chem Tech Res 5(5):2351–2356
- Tiwari AK, Singh AK (2014) Hydrogeochemical investigation and groundwater quality assessment of Pratapgarh district, Uttar Pradesh. J Geol Soc India 83(3):329–343
CrossRef - Singh G, Kamal RK (2014) Application of water quality index for assessment of surface water quality status in Goa. Curr World Environ 9(3):994–1000
- Singh P, Tiwari AK, Singh PK (2014) Hydrochemical characteristic and quality assessment of groundwater of Ranchi township area, Jharkhand, India. Curr World Environ 9(3):804–813
- Tiwari AK, Singh PK, Mahato MK (2014) GIS-based evaluation of water quality index of groundwater resources in West Bokaro Coal field, India. Curr World Environ 9(3):843–850
- Singh P, Tiwari AK, Singh PK (2015) Assessment of groundwater quality of Ranchi township area, Jharkhand, India by using water quality index method. Int J Chem Tech Res 7(01):73–79
- Shinde SD, Patil KA, Sadgir PA (2015b) River and Groundwater Quality Assessment using GIS. International Journal of Innovative Research in science, Engineering and Technology 4 (11). DOI: 10.15680/IJIRSET2015.0411118.
- Shinde SD, Patil KA, Sadgir PA (2016). GIS based Groundwater quality Mapping in Southern part of Aurangabad City, Maharshatra, India. International Journal of Advances in Engineering & Technology 9(1):129-134
- Tiwari AK, Singh AK, Singh AK, Singh MP (2015b) Hydrogeochemical analysis and evaluation of surface water quality of Pratapgarh District, Uttar Pradesh, India. Appl Water Sci. DOI: 10.1007/s13201-015 0313-z
- Panigrahy BP, Singh PK, Tiwari AK, Kumar B (2015b) Variation in Groundwater Quality with Seasonal Fluctuation in Jharia Coal Mine Region, Jharkhand, India. Curr World Environ 10(1):171-178
- Singh Surjeet, NC Ghosh, G Krishan, Ravi Galkate, T Thomas, RK Jaiswal (2015) Development of an Overall Water Quality Index (OWQI) for Surface Water in Indian Context. Curr World Environ 10(3): 813-822
- Krishan G, CP Kumar, BK Purandara, NC Ghosh, S Gurjar, AG Chachadi (2016)Assessment of variation in water quality index (WQI) of groundwater in North Goa, India. Curr World Environ 11(1):39-46.
- Tiwari AK, De Maio M, Singh PK, Singh AK (2016b) Hydrogeochemical characterization and groundwater quality assessment in a coal mining area, India. Arabian Journal of Geosciences 9(3):1-17. DOI: 10.1007/s12517-015 2209-5
- Tiwari AK, Singh PK, Mahato MK (2016c) Environmental Geochemistry and a Quality Assessment of Mine Water of the West Bokaro Coalfield, India. Mine Water and the Environment. DOI: 10.1007/s10230-015-0382-0
- Tiwari AK, Singh PK, Mahato MK (2016d) Hydrogeochemical investigation and qualitative assessment of surface water resources in West Bokaro coalfield, India. J Geol Soc India 87(1):85-96
- Mahato MK, Singh PK, Tiwari AK, Singh AK (2016) Risk Assessment Due to Intake of Metals in Groundwater of East Bokaro Coalfield, Jharkhand, India. Exposure and Health. DOI: 10.1007/s12403-016-0201-2
- Singh PK, Tiwari AK, Panigarhy BP, Mahato MK (2013b) Water quality indices used for water resources vulnerability assessment using GIS technique: a review. Int J Earth Sci Eng 6(6–1):1594–1600
- Chandra S, Singh PK, Tiwari AK, Panigrahy B, Kumar A (2015) Evaluation of hydrogeological factor and their relationship with seasonal water table fluctuation in Dhanbad district, Jharkhand, India. ISH J Hydraul Eng 21(2):193–206.
CrossRef - Ghosh A, Tiwari AK, Das S (2015) A GIS based DRASTIC model for assessing groundwater vulnerability of Katri Watershed, Dhanbad, India. Model Earth Syst Environ 1(3):1–14.
CrossRef - Tiwari AK, Singh PK, Chandra S, Ghosh A (2016e) Assessment of groundwater level fluctuation by using remote sensing and GIS in West Bokaro coalfield, Jharkhand, India. ISH J Hydraul Eng 21(1): 59-67. DOI: 10.1080/09715010.2015.1067575.
- Tiwari AK, Singh PK, De Maio M (2016f) Evaluation of aquifer vulnerability in a coal mining of India by using GIS-based DRASTIC model. Arabian Journal of Geosciences 9(6): 9:1-15. DOI: 10.1007/s12517-016-2456-0
- Appelo CAJ, Postma D (1996) Geochemistry, groundwater and pollution. AABalkema Publication, Rotterdam.
- Singh AK, Raj B, Tiwari AK, Mahato MK (2013c) Evaluation of hydrogeochemical processes and groundwater quality in the Jhansi district of Bundelkhand region India. Environ Earth Sci 70(3):1225–1247
CrossRef - Han Y, Wang G, Cravotta CA, Hu W, Bian Y, Zhang Z, Liu Y (2013) Hydrogeochemical evolution of ordovician limestone groundwater in Yanzhou, North China. Hydrol Process 27(16):2247–2257
- Majumdar D, Gupta N (2000) Nitrate pollution of ground water and associated human health disorders. Indian J Environ Health 42:28–39
- BIS (2003) Indian standard drinking water specifications IS10500:1991, edition 2.2 (2003–2009). Bureau of Indian Standards, New Delhi
- WHO (2006) Guidelines for drinking-water quality, 3rd edn. World Health Organization, Geneva.
- Pradeep K. Nailk, Jayesh A.tambe, Biranch ND (2007) Impact of Urbanization on the groundwater regime in a fast growing city in Central India. Environmental Monitoring Assessment. 146-339. DOI: 10.1007/s10661-007-0084-6
CrossRef


